Chiao Dα Management Review Vol. 33 No.1, 2013 pp.65-104
商業本票利率行為:資料頻率與重大
事件
The Behavior of Commercial Paper Rates: Data
Frequencies and Great Events
張志向 1 Chih-Hsiang Chang
國立高雄大學金融管理學系
Department ofFinance, National University ofKaohsiung
摘要:由於包含貨幣市場金融商品的投資組合逐漸受到投資人的歡迎,所以 許多相關研究已經開始探討短期利率行為。本研究昌在調查 4 種不同頻率 (日、遇、月與季資料)的商業本票利率動態變化與 5 項重大事件(臺海導 彈危機、亞洲金融危機、 921 大地震、 2000 年總統大選與 911 恐怖攻擊)對 商業本票利率行為的影響。實證結果首先發現,商業本票的日、週、月與季 報酬率在「極」 長期(超過 20 年)是負自我相關。其次,重大事件對於商 業本票利率的均數復歸速度產生顯著地衝擊。再者,商業本票利率水準高低 對商業本票利率波動性具有關鍵性的影響。最後,商業本票利率的隨機漫步 假設在低頻率資料(月與季資料)被拒絕的證據是比高頻率資料(日與週資 料)更為明顯。 關鍵詞:商業本票利率;資料頻率;重大事件;均數復歸;隨機漫步
Abstract: The behavior of short-term interest rates has been examined in numerous studies because portfolios, including money market ins甘uments, are popular with investors. This study examines the dynamics of commercial paper rates across the four different 企equencies (i.e., daily, weekly, monthly, and quarter1y data) and the influence of the five great events (i.e.
,
the Taiwan Strait missile crisis, the Asian fmancial crisis, the 921 earthquake, the 2000 presidential1 Corresponding author: Department of Finance, National University of Kaohsiung, Taiwan;
E-mail: [email protected]
Data Frequencies and Great Events
election
,
and the 911 terrorist attacks) on commercial paper rate behavior. The empirical results indicate that first the daily, week1y, monthly, and quarterly retums on commercial papers are all negatively autocorrelated in the“
very" long term (more than 20 years). Second, the great events have an important impact on the mean-reverting speed of commercial paper rates. Third, the level of commercial paper rates is crucial to the determination of commercial paper rate volatility. Finally, the rejection of the random walk hypothesis of commercial paper rates for low frequency data (monthly and quarterly data) is stronger than that for high frequency data (daily and weekly data).Keywords: Commercial paper rates; Data frequencies; Great events; Mean reversion; Random walk
1. Introduction
Although many researchers have examined the dynamics of short-term interest rates
,
there is no consensus among researchers regarding whether short-term interest rates follow a mean reversion process.2 In contrast with a few earlier studies, which found insignificant mean-reverting tendency in short-term interest rates (e.g., Brailsford and Maheswaran, 1998; Christopher, 2003), the majority showed supportive evidence for the mean reversion behavior of short-term interest rates (e.g., Dahlquist, 1996; Adkins and Krehbiel, 1999; Staikouras, 2006; Koutmos and Philippatos, 2007; Smallwood and Norrbin, 2008; Kim and Ji, 2011). The previous studies on mean reversion of short-term interest rates mostly focused on the Treasury bill rate behavior in E叮ope and the US (e.g.,Chan et al., 1992; Dahlquist, 1996; Koutmos, 1998; Staikouras, 2006; Koutmos and Philippatos, 2007; Christiansen, 2010). Some investigated the mean-reverting tendency of LIBOR (e.g., Adkins and Krehbiel, 1999), Eurodollar interest rates
(e.g., Christopher, 2003), and Eurocurrency interest rates (e.g., Smal1wood and
2 Mean reversion refers to a propensity that financial asset prices will move back to their long-term averages.
Chiao Da Management Review Vol. 33 No.1, 2013 67
N orrbin, 2008), but they rarely discussed mean reversion of commercial paper rates (in particular
,
for emerging markets). Like Treasury bills,
commercial papers are also one of the main instruments in the money market. In contrast to Treasury bill rates reflecting government default risk, commercial paper rates reflect the default risk of enterprises. When the default risk of enterprises always responds to the economic c1imate, the examination of commercial paper rate behavior will help us to understand how short-tenn interest rates respond to the business operatlllg enVlronment.If the speed of mean-reverting of commercial paper rates can be detected, then the portfolio perfonnance, inc1uding instruments in the money market,
should obviously improve. Because the participants with different investment horizons in the money market focus on different holding period returns, the issue of short-tenn interest rate behavior across frequencies has at甘acted significant attention in previous studies (e.g., Koutmos, 1998; Engle and Rangel, 2008). Although it is easier to find the mean reversion when adopting low 企equency data
(e.g., quarter1y returns and monthly returns) to investigate the behavior of commercial paper rates
,
the conclusions regarding mean reversion using low 企equency data are more likely to be contaminated by insufficient observations. As a result, a comparison of the mean-reverting speed between low and high企equency data (e.g., weekly returns and daily retums) is necessary for obtaining a complete picture of the price behavior of commercial papers.
Most of the ear1ier studies indicated the dependence of the volatility of interest rates on their level (e.g., Cox, Ingersol1, and Ross, 1980; Chan et al., 1992;
Brenner, Harjes, and Kroner, 1996), but the dependence appe紅s to be sensitive to the 企equency of the data used (Koutmos, 1998). This implies that the dynamics of interest rates may have different features at di旺erent frequencies. Additional1y, the research of interest rate volatility has been limited to the field of matured countries (especially the US) but the benefits of analyzing the features of short-tenn interest rates in emerging markets are obvious. Studies focusing on the sensitivity of interest rate volatility to its level changes across frequencies for the Taiwanese money market are beneficial in understanding the interest rate dynamics in emerging markets.
Data Frequencies and Great Events
The occurrences of great events not only have a big impact on investors' sentiments but also 仕igger changes in their investment strategies. Therefore, great events may yield a shift toward higher volatility of commercial paper rates and structural breaks of commercial paper rate behavior. It is informative to explore the intluence of great events on commercial paper rate behavior of an emerging money market across frequencies. The more sophisticated a money market, the more long-term investors or institutional investors exist that plan their investment strategy using a detailed and complete analysis. This means that the noise traders' intluence on commercial paper rates becomes lower in matured markets. The number of noise traders in the money market of Taiwan, an emerging money market, is more than in a matured money market. The Taiwanese commercial paper rates are able to be affected easily by great eve,nts, which may lead to
irrational tluctuations.
The aim of this study is to investigate the behavior of commercial paper rates across 企equencies and around great events associated with less sophisticated money markets. Several important contributions beyond the scope of previous studies are made. First, this study examines the mean reversion of commercial paper rates across the four different 企equencies (i.e., daily, weekly, monthly, and quarter1y data). Second, this study investigates the elasticity of commercial paper rate volatility to its levels across the four different frequencies. Third, the influence of data 企equencies and great events on the rejection of random walk hypothesis is explored. Finally, this study compares the differences in commercial paper rate behavior before and after the five great events (i. e., the Taiwan Strait missile crisis, the Asian financial crisis, the 921 earthquake, the 2000 presidential election, and the 911 terrorist attacks).
The remainder of the paper is organized as follows. The second section discusses the great events in Taiwan during the research period. The data sources and research methodology are introduced in the third section. The empirical results are presented in the fourth section, while the final section concludes and summarizes the findings of the paper.
Chiao Da Management Review Vol. 33 No.1, 2013 69
2. Great Events in Taiwan during the Research Period
Table 1
The Economic Growth Rate for the Asian Tigers
Year Taiwan Hon皇 Kong Sin臺apore South Korea
1996 5.54% 4.3% 8.2% 7.0% 1997 5.48% 5.1% 8.3% 4.7% 1998 3.47% -6.0% -1.4% -6.9% 1999 5.97% 2.6% 7.2% 9.5% 2000 5.80% 8.0% 10.1% 8.5% 2001 -1.65% 0.5% -2.4% 4.0% 2002 5.26% 1.8% 4.2% 7.2% 2003 3.67% 3.0% 3.8% 2.8% 2004 6.19% 8.5% 9.2% 4.6% 2005 4.70% 7.1% 7.6% 4.0% 2006 5.44% 7.0% 8.7% 5.2% 2007 5.98% 6.4% 8.2% 5.1% 2008 0.73% 2.3% 1.5% 2.3%
Data source: National Statistics, R.O.C.
Taiwan is a saucer-shallow economy composed of a high-tech industry and small and middle-sized enterprises that are easily impacted by great events. A review of both great domestic and intemational events occurring from J anuary 5,
1982 to F ebruary 泣, 2012 (the research period of this study) indicates that the Taiwan Strait missile crisis in 1996, the Asian financial crisis in 1997, the Taiwan's 921 earthquake in 1999, the first political party ruling shift in Taiwan in 2000, and the 911 terrorist attacks in 2001 had a significant impact on the Taiwanese financial market. 3 From Table 1
,
Taiwanese economic growthremained positive during 1996-1998 (with 5.54%
,
5.48%,
and 3.470/0 where otherAsian tigers, Hong Kong, Singapore, and South Korea experienced growth rates in 1998 of -6.00/0, -1.4%, and -6.90/0, respectively). Meanwhile, the Taiwanese
stock market experienced a bullish 甘end (during 1996-1998 the Taiwan Capitalization Weighted Stock Index reached a peak of 10256.10 points on August
3 Although the research period ofthis study is January 5, 1982 to February 22, 2012, the variance ratio test of Poterba and Summers (1998) used by this study requires the sub-period longer than ten years to acquire sufficient observations. Due to the need of the long sub-periods for the comparison of commercial paper rate behavior between pre-event and post-event, this study focuses on the great events that happened during 1993-2001.
Data Frequencies and Great Events
27, 1997 and a low of 4672.67 points on February 7, 1996 while the c10sing prices of the Taiwan Capitalization Weighted Stock Index were 5146.04 and 6418.43 points on January 4, 1996 and December 31, 1998, respectively). With a stable financial system in Taiwan and the proper govemmental response to the Taiwan Strait missile crisis and Asian financial crisis, the above two great events exerted limited impact on the financial market in Taiwan, inc1uding the commercial paper market. Pilbeam (2001) also indicated that the Taiwanese economy experienced less of an impact during the Asian financial crisis than other East Asian coun仕les.
Although Taiwan experienced less impact 企om the Taiwan Strait missile crisis and Asian financial crisis on its economy and financial market, the Taiwanese economy was in a recession during 1999-2001.4 This may have resulted from the bubble burst of the Intemet economy, but after 2002 the rest of the Asian tigers,
Hong Kong, Singapore, and South Korea, experienced economic recovery and more positive growth while Taiwan's economy remained in a downtum and experienced sluggish GDP growth. Thus, great events occurring during 1999-2001 may have affected the confidence of investors or economic structure of Taiwan. In a review of great events during 1999-2001 in Taiwan, first, on September 21
,
1999,
Taiwan was struck by the most serious natural disaster in history, the 921 earthquake. It resulted in a death to11 of 2,455 lives and economicloss ofNT$ 360 bil1ion,5 devastating Taiwan's economic strength. There is a need
to compare commercial paper rate behavior before and after this natural disaster. Second, the first change in a ruling political party occurred in Taiwan on March
時, 2000 when the Nationalist Party (or Kuomintang) lost its 56-year (1945-2000) dominance of the government. This event resulted in China's mistrust of the new ruling political party (Democratic Progressive Party) resulting in the economic cooperation between Taiwan and China being affected by a poor political relationship. It is worth further discussing whether this political power shift
4 Taiwan's annual economic growth rate reaches a historical low of -1.65% in 2001 and an
average of 3.37% during 1999-2001, which is significantly lower than the average growth rate of 4.48% during the 1997-1998 Asian tìnancial crisis and one of 6.78% during 1989-1998 (data source: National Statistics, R.O.C.).
Chiao Da Management Review Vol. 33 No.l, 2013 71
impacted the investors' confidence of commercial paper. The terrorist attacks on September 11
,
2001 were the greatest intemational event during 1999-2001. The attacks on the US impacted financial markets around the wor1d, and since the US is the most important al1y country and major export market of Taiwan, Taiwan was inevitably a:ffected. This study, thus, investigates the impact of this great intemational event on commercial paper rate behavior.As mentioned previously, it is understandable why the Taiwan Strait missile crisis in 1996, the Asian financial crisis in 1997, the 921 earthquake in 1999, the presidential election in 2000, and the 911 terrorist attacks in 2001 are selected as research subjects. This study includes the impact of great events on commercial paper rate behavior because the belief is that: First, interest rate, exchange rate,
and stock price are the three most important financial asset indicators in the tinancial field and research in the tinancial field always focuses on short-term interest rate behavior. After Chan et al. (1992) proposed a comparison of short-term interest rate behavior models raised by previous studies and presented one single continuous-time short-term interest rate model, later studies often used Chan et al. 's model to empirical1y analyze (e.g., Adkin and Krehibel, 1999) or improve the capturing of the interest rate dynamic based on the proposal of Chan et al (e.g., Dahlquist, 1996; Koutmos, 1998; Koutmos and Philippatos, 2007). Previous 1 iterature
,
however,
rarely examined the impact of great events on short-term interest rate behavior and thus, this study inc1udes the impact of great events on commercial paper rate behavior. In addition, the earlier studies examined the impact of great events on stock price 得nd exchange rate behavior(e.g., Samo and Taylor, 1999; Karol抖, 2002; Caporale, Cipolli血, and Demetriades, 2005), but seldom addressed the impact of great events on interest rate behavior, therefore, it deserves an in-depth analysis. In the end, before the occurrence of these five great events
,
during 1982-1995,
the average rate on 90-day commercial paper in the secondary market was 7.481 % and after the occurrence, during 2002-2011, the average rate on 90-day commercial paper in the secondary market was 1.973% (since 1999, the govemment in Taiwan started to stimulate economic recovery by adopting a gradual drop in the rediscount ratData Frequencies and Great Events
Taiwanese short-term interest rates to the lowest level in the past 50 years). Whether the dramatic deviance of interest rate levels results in structural change is one of the motivators behind this study. In short, based on the above three reasons,
which are the importance of short-term interest rate behavior, the neglect of the effect of great events on short-term interest rates, and the possibility of the structural change of short-term interest rates, this study examines the commercial paper rate dynamic and its mean-reverting tendency, as well as whether great events result in a structural change of commercial paper rates to further understand commercial paper rate behavior.
3. Data and Methodologies
3.1. Data
Earlier studies mostly adopted the Treasury bill rates for the approximation of short-term interest rates, but Treasury bill 甘ading in Taiwan remains at a low volume and this approximation is not suitable. In terms of trading volume of financial instruments in the Taiwanese money market, commercial paper is the one with the highest liquidity (in 2008, the secondary market trading ofTaiwanese commercial paper exceeded NT$ 39 trillion accounting for more than 800/0 oftotal bill market trading) and among them, the trading of the second type commercial paper (financing commercial paper; CP2) has the highest volume. In regard to the maturity of financial ins甘umen胞, previous literature indicated the uti1ization of the interest rate of three-month financial instruments in the money market for the approximation of the short-term interest rate (e.g., Larrain and Pagano, 1993; Koutmos, 1998; Staikouras, 2006). Based on the above reasons for high liquidity of commercial papers and the suggestion of previous literature, this study uses the 90-day CP2 rates for the approximation of the short-term interest rates.
The data used in this study consists of the daily, weekly, monthly, and quarterly retums on the CP2 of the secondary market with maturities of 90 days. The daily series of annualized percentage rates on the 90-day CP2 was obtained
Chiao Da Management Reνiew Vol. 33 No.1, 2013 73
started on January 5, 1982 and ended on February 22, 2012. For obtaining the daily, weekly, monthly, and quarter1y retums on the 90-day CP2, the annualized percentage rates were respectively divided by 365, 52, 12, and 4. Weekly, monthly,
and quarter1y series were based on Wednesday's rates, the end of the month rates,
and the end of the quarter rates, respectively. There were 8,281 daily retum observations, 1,572 weekly retum observations, 360 monthly retum observation,
and 119 quarter1Y retum observations. Additionally, this study established ten sub-periods (i.e., before and after the five great events), to analyze the impact of these great events on the behavior of commercial paper rates across f切quencles for less sophisticated money markets.
3.2. The Iovestigatioo
00the Dyoamics of Commercial Paper
Rates
For improving the ability of capturing the dynamics of short-term interest rates, Chan et al. (1992) used a model with a single continuous time process to examine the volatility of interest rates and the speed of mean-reverting. This study adopts the model ofChan et al. (1992) provided below for the investigation on the dynamics of commercial paper rates:
dr = (α + ßr)dt + σrλdw , 、 ‘,/ 唔, EA /SE 、 、
where r is commercial paper rates;6α , β , σ , and λare the parameters; and w follows a Brownian motion (Chan et al., 1992; Koutmos, 1998).
Equation (1) indicates that the level of commercial paper rates, r , has a significant impact on the conditional mean and the conditional variance of changes in the commercial paper rates. In addition, βis a measure of the speed of mean reversion (i.e., the behavior of commercial paper rates will exhibit the tendency of mean reversion ifβ< 0).
According to the argument of Chan et al. (1992), the discrete-time econometric specification of the single continuous time process is as follows:
74
可+1 一月 =α+β月+ &(+1 ,
Et(&t+1) = 0,
E
rC
Ct2+1) = σγλ ,Data Frequencies and Great Events
(2)
(3) (4)
where Et is the conditional expectation for time
t;
&t+ 1 is the error term fortime t + 1; and Et (&t2+ 1) is the conditional variance of the error term for time
t + 1. As can be seen from equations (2), (3), and (4), the conditional variance of the error term for time t + 1 is dominated by the level of commercial paper rates for time t.
To get a more reliable statistical inference, the generalized error dis甘ibution (GED) was used by Koutmos (1998) in the parameter estimation of Chan et al. 's
model (1992). This study also uses the methodology of Koutmos (1998) to investigate the dynamics of commercial paper rates. According to Koutmos' model (1998), the parametersα , β , σ , and λcan be obtained via maximum likelihood estimation. Koutmos (1998), however, found that the sensitivity of interest rate volatility to its level changes was below unity. Therefore, the likelihood function and the functional form of the GED can be described as follows: T-1 L(η) =
L
logf[μ叫 , Et(ε立1 ), τ], (5) f(μ科1+1 ,0"1
+
1υ, 恥 ;計伊『叭
r川f內
/r)叫)刀r
句3/ ε烏丸
t
仆
+1 ~ GED[ μ叫 , E,耳't( ε三ι1)' T]τ吋], (7) μ叫 =α+β巧, (8)where TJ is the parameter vector; r(-) is the density function of the Gamma
dis甘ibution; T is the degrees of 仕的dom; f(-) is the conditional density
function with T degrees of freedom; and f1t+1 is theconditional mean for time
t + 1 (Koutmos, 1998). According to Koutmos (1998), the normal distribution is present if T =2
,
while double exponential distribution is present ifτ= 1.Chiao Da Management Review Vol. 33 No.1, 2013 75
3.3. The Variance Ratio Test of Poterba and Summers (1988) for
the Commercial Papers Rates
This study mainly applies the variance ratio test of Poterba and Summers (1988) to investigate the mean reversion tendency of commercial paper rates. The variance ratio test divides the variance of retums through difIerent horizons by the variance of one-year holding period retums. While the period of this study is 企om
January 5
,
1982 to February 泣, 2012,
for the daily retums,
most materials are selected 企om dates before December 31, 2000 because prior to that date there are six business days a week for the Taiwanese commercial paper market. Therefore,if it is counted as the one-year holding period retum, which is 甘ansferred from the daily retums
,
in this sωdy a 288-day (288 business days) retum,
Rl~88 , is the one-year holding period retum. As mentioned above,
for daily,
weekly,
monthly,
and quarterly retums,
the variance ratios,
VR(k1),
VR(k2 ),
VR(k3 ),
andVR(k4)
,
are specified respectively as follows:(9) 、‘.,/ AU --EA /'.、、 、‘,/ 咀 EEA
---A
' ,'‘、、 (12) KU R R U盯主帥
一一 ﹒叫“ R RMZ
叫 一 KUM R R叫主卅
一 KU R R 卅之卅 一-KU R 戶 uw rA 戶旬 ,n wR去 , R去, and
R;;
denote the holding period retums fork
1 -day,
k
2 -week,
k3 -month and k4 -quarter
,
respectively; Va呵呵1) , Var(科門, Var(R;:),
Data Frequencies and Great Events
R;1 , R;88, R2 , R2 , RC, R;7, R;;and RL ,respectively.
Equations (9) to (12) indicate that when the cross holding periods retums are uncorrelated, then the variance ratios of the daily, weekly, monthly, and quarterly retums 0∞n叭lC∞omme肌r叩rCla凶叫向p仰ape叮r吭 y印'R(圳鳥圳k
l
) , 1川=斗1,以2之υ,3久3丸,4 , 仰 e叫qψu叫 to 1. Ad蚓d“di伽t位ω伽i昀lon∞捌叫na叫a叫lly, a彷s
the variance ratio increases to more than a one-year h01ding period and is affected by the transitory components, then after lagging for a period of time VR(k[) < 1
削 VR(k[) > 1 show negative 叫 positive autocorrelation for commercial p恥r rates, respectively. In the end, as the variance ratio is less than the one-year holding pe訓,喇叭< 1 refers to positive autocorrelation for commercial paper rat成 while VR(k[) > 1 refers to negative autocorrelation for commercial paper rates.
A comparison of the methods of investigating mean reversion between equation (2) and equations (9)-(12) reveals that the methods of Chan et al. (1992) and Koutmos (1998) are more easily affected by data frequency than the variance ratio test of Poterba and Summers (1988). If higher 企equency daily or weekly data is used (the previous term here refers to one day or one week before)
,
it is more likely that the conclusions regarding mean reversion using daily or weekly retum data will be contaminated by other factors (e.g., bid-ask spread, infrequent trading and so on). Furthermore, Poterba and Summers (1988) neglected the effect of commercial paper rate volatilities, which is either positive (increasing interest rates) or negative (reducing interest rates). For example, the dramatic increase or decrease of commercial paper rates will result in the increase of their variance, but the method of Poterba and Summers (1988) cannot determine which (increase or decrease) causes the increasing variance. If the commercial paper rate was first dramatically increased and then slightly increased, the same empirical result wou1d occur as that of,“
the commercial paper rate that dramatically increased and then slightly decreased." The former, however, during the research period did not gradually retum to the 10ng圖term average level. Then, the biased conclusion with mean reversion exhibition of commercial paper rates may be derived.Chiao Da Management Review Vol. 33 No.1, 2013 77
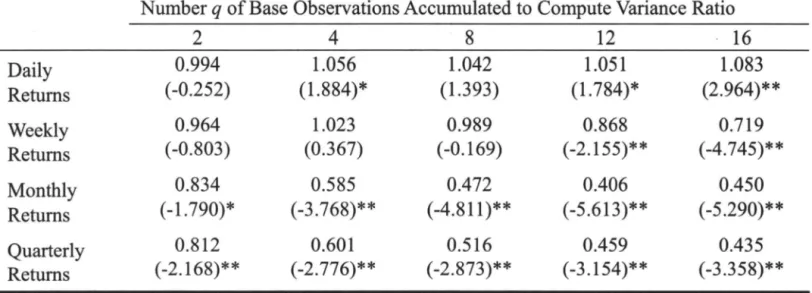
3.4. The Variance Ratio Test of Lo and Mac
Ki
nlay (1988) for the
Commercial Papers Rates
In addition to the investigations on the dynarnics and the mean reversion of
commercial paper rates, this study applies the variance ratio test of Lo and
MacKinlay (1988) to explore whether the commercial paper rates across
企equencies follow random walk in order to completely understand the behavior of commercial paper rates. Compared to the variance ratio test of Poterba and
Summers (1988)
,
the variance ratio test of Lo and MacKinlay (1988) had threefeatures: First, the variance ratio test of Poterba and Summers (1988) used the
variance on the one-year holding period returns as a benchrnark and calculated the
ratio of the variance on the k-year holding period returns divided by k to the
variance on the one-year holding period returns
,
while Lo and MacKinlay (1988)applied the number of the base observations accumulated to compute variance ratio and their autocorrelation coefficient estimators of the first-order differences
to calculate the variance ratio for a certain period with base observations. Second,
the variance ratio test of Lo and MacKinlay (1988) can calculate the standard test statistic for the variance ratios to examine whether the commercial paper rates
follow random walk or fit a mean-reverting process, which is different frorn the
variance ratio test of Poterba and Summers (1988). Finally, Lo and MacKinlay
(1988) used the autocorrelation coefficient estimators ofthe first-order differences
of commercial paper rates to calculate the approximate value of variance ratio,
and the autocorrelation coefficient estimators of the first-order differences of commercial paper rates are affected by the number of the base observations of
commercial paper rates accumulated to compute variance ratio. Thus
,
theaccuracy of variance ratios is dominated by the number of base observations of commercial paper rates accumulated to compute variance ratios.
According to the variance ratio test of Lo and MacKinlay (1988), the
variance ratio [Mr( q) ] and the standard test statistic for the variance ratio [Z
*
(q) ]q-12(q- j) Mr(q) = L 戶(j) j-l q Z *(q)
= 而Mr(q) I而否
q 一 1_2(q- j) θ(q)=
L
[立 ~]δ(j) j=1 q三(可 -rh一1
-û)2(rh_ j -rh
一
j-l
_Û)2 ð(j)=!:.
=j+l [三 (rh - rh-l -û)2fd= 土豆的一月一1)
nq h=lDαta Frequencies αndGreαtEνents
(13)
(14) (15)
(16)
(17)
where, q is the number of base observations accumulated to compute variance ratio. nq is the number of base observations. 力(j) refers to the jth-order autocorrelation coe宜icient estimators of the first-order di缸erences of commercial paper rates across frequencies. rh refers to the h-th base observation of commercial paper rates across frequencies (Lo and MacKinlay, 1988).
Lo and MacKinlay (1988) argued that the null hypothesis ofrandom walk for commercial paper rates should be r司的ted as M川q) was significant1y different
仕om zero. In addition, if commercial paper rates fit a mean reversion process,
then 1+ Mr(2) is significant1y less than 1 [i.e., Mr(2) is significant1y less than zero] and the absolute value of the significant negative Z
*
(q) should be larger as q lncreases.Notably that the methods of Chan et al. (1992), Koutmos (1998), Poterba and Summers (1988), and Lo and Mackinlay (1988) all examined the mean-reverting speed of financial asset prices. If commercial paper rates are mean-reverting, then the behavior of commercial paper rates will demonstrate two types of characteristics as bellow: The first is to be described from the perspective of commercial paper rate level and its first-order di宜erence that believes the higher the commercial paper rate for time t-l, the smaller first-order difference of commercial paper rates will be found for time t. Another type of characteristic is
Chiao Da Management Review Vol. 33 No.1, 2013 79
described from the perspective of volatility of commercial paper rates at different
retum measurement intervals (i. e., holding periods) that believe the average
volatilities of commercial paper rates per unit time interval at the longer retum measurement interval shall be smaller than those at the shorter return
measurement interval. Only when one of two said types of characteristics is
satisfied (or both are satisfied), will commercial paper rates gradually retum to the
long-term average level. Chan et al. (1992) and Koutmos (1998) constructed their
method based on the first type of characteristic and investigated the existence of negative autocorrelation between the commercial paper rates at the previous term
and current term, while Poterba and Summers (1988) used the second type of
characteristics and surveyed whether variance of commercial paper rate for k-unit
time interval divided by k is smaller than that for l-unit time interval (Poterba and
Summers utilized a one-year holding period as the benchmark and one year to distinguish short- and long-term).
The variance ratio test of Lo and Mackinlay (1988) was constructed on both
above characteristics of mean-reverting. Although
,
as the variance ratio test ofPoter切 and Summers (1988) did, the variance ratio test of Lo and Mackinlay
(1988) also measured variance ratios of the research variable (in this s個旬,
research variable refers to commercial paper rates) at the retum measurement
intervals, yet Lo and Mackinlay (1988) used the autocorrelation coe宜icient
estimators of the first-order differences of research variable to calculate the
approximate value of variance ratio. Hence, the empirical results regarding mean
reversion applying the variance ratio test of Lo and Mackinlay (1988) are rationally expected to be approximate to ones exploiting the method of Koutmos (1998).
4. Empirical Results
4.1.
The Dynamics of Commercial Paper Rates across Frequencies This study applies the methodology of Koutmos (1998) to investigate the dynamics of commercial paper rates across four different frequencies for theData Frequencies and Great Eνents
money market in Taiwan (i.e.
,
the less sophisticated market compared with theUS). Before examlnlng the dynamics of commercial paper rates, this study
adopted the augmented Dickey-Fuller (ADF) unit root test of Said and Dickey
(1984) to investigate whether the return data on the commercial paper across the
four 仕equencies exhibit the stationary characteristic for the avoidance of spurious
regression resulting from a non-stationary data structure. The empirical results
indicate that all four return data on the commercial paper for the three models (i. e.,
“the pure random walk model,"“the model with a drift term," and “the model
with a drift and linear time 甘end") display stationary characteristics.7 Therefore
,
this study can use the retum data on the commercial paper across the four
different 企equencies to examine the behavior of commercial paper rates.
Table 2 presents parameter estimates of the model given by equations (2)-(8) using return dataacross the four frequencies. The results of daily returns in Table
2 show that parameterαfor the daily retum data is insignificantly different
企om zero, but parameterβfor the daily retum data is significantly less than
zero. Parameter βrepresents the speed of mean-reverting; its significance
means that there appears to be evidence of mean reversion in the commercial paper rates for the daily retum data. According to the argument of Koutmos
(1998), mean reversion is hard to detect in 企equent data such as daily and weekly;
however, in my findings, the significant evidence of mean reversion using daily
retum data is inconsistent with Koutmos' (1998) studies. The reason for the existence of the mean reversion tendency of the daily retum data in my findings
mayanse 企om the low level of sophistication in the Taiwanese commercial paper
market. The Taiwanese commercial paper market was established in 1976 and it
only has a history of 36 plus years. Comparatively, the development history of
Taiwanese commercial paper market is shorter than that of Europe, the US, and
Japan. Before 1995, there were only three bills financing corporations and by thβ
end of 2008 the number had increased to 14, indicating, few players in the market.
By July 9
,
2001,
when the Act Goveming Bills Finance Business wasimplemented
,
the trading in the money market finally had its legal base. SinceChiao Da Management Review Vol. 33 No.l, 2013 81
then, Taiwanese commercial paper market has experienced significant growth. Overal1, the structure of market participants of commercial paper is mainly institutional investors and its market maturity is greater than that of the Taiwanese stock market composed primarily of retail investors. However, when compared to the commercial paper markets of developed countries, Taiwanese commercial paper is at a comparatively low sophistication level. The low sophistication of the Taiwanese investors causes the prices of money market instruments to deviate
企equently 企om their intrinsic value, and then the behavior of mean reversion is detected in the high frequency data.
Parameters σand λrepresent the linkage between the conditional variance of commercial paper rates and their level (Koutmos, 1998). From the results of daily returns in Table 2, parametersσand λfor the daily retum data are both significantly more than zero. These findings support the c1aims in the previous literature (e.g., Chan et al., 1992; Koutmos, 1998) that showed that the dependence of interest rate volatility on its level is the most important feature of short-term interest rate dynamics. Moreover, in contrast with the findings of Chan
et al. (1992), the elasticity of Treasury bil1 rates is 1.5, this study, as in the findings of Koutmos (1998), finds the estimator of λfor the daily return data is less than one (i.e., 0.613). According to equations (2) to (4), the estimator of the elasticity of commercial paper rates, 0.613, indicates that the volatility of the commercial paper rates will change by approximately 1.226 basis points (i. e., 2 λ)
if their level changes by one basis point. The estimator of λfor daily retum data is less than one, which also means that the commercial paper rates process is statIonary.
The results of daily retums in Table 2 display that the estimator of parameter r for the daily retum data is somewhat less than one and significantly greater than zero. This result is inconsistent with the c1aim that the normal distribution requires the estimated degrees of freedom (i.e., parameterτ) be equal to 2. In other words, according to the argument of Koutmos (1998), the above result regarding the estimator of r means that the shape of the distribution of commercial paper rates for daily retum data may be a double exponential or Laplace density function.
Data Frequencies and Great Events
Table 2
Maximum Likelihood Estimates oftbe Koutmos' (1998) Models Using Daily
,
Weekly,
Monthly,
and Quarterly Returns on the Commercial PapersFrequencies α β σ λ T Daily 2.63xl0-6 -4.54xl0 -4 0.001 0.613 0.784 Retums (0.956) (-2.965)** (78.562)** (56.251)** (59.416)** Weekly 4.59x 10⁻⁵ -0.001 5.36xl0-7 0.662 0.860 Retums (0.696) ( -1.165) (49.770)** (45.978)** (42.385)** Monthly 0.001 -0.008 1.32xl0-6 0.627 1.278 Retums (2.542)** ( -3.156)** (30.172)** (52.760)** (67.802)** Quarter1y 0.029 -0.060 0.001 0.584 1.137 Retums (4.171)** (-5.297)** (40.323)** (49.394)** (59.216)** Note: “*" and “**" refer to significant at the 10 and 5 percent level, respectively; Figures in
parentheses are t-statistic.
The results using weekly retums are also presented in Table 2. Compared with the results of daily retums in Table 2
, excluding the
parameterβ , there are no significant differences between the results of the daily retum data and those of the weekly retum data. The results of weekly retums in Table 2 show that fir帥, theparameterαremains insignificantly different 台om zero, both statistically and numerically. Although the tendency of mean reversion for the weekly retums on the commercial papers (i. e., parameterβ) is statistically insignificant, both the negative value of parameterβand its marginal significance (i.e., the absolute value of t-statistic is greater than 1) indicate the weak evidence of mean-reverting tendency for week1y retum data. Second, the parametersσand λlinking
volatility to the level of commercial paper rates are significantly greater than zero. This implies the positive dependence of commercial paper rate volatility on its level for weekly retum data. Third, the sensitivity of commercial paper rate volatility to its level (i. e., parameterλ) is less than one and implies the process of weekly retums on commercial papers is stationary. Finally, as in the results using the daily retum data, the estimator of T for the weekly retum data is also
Chiao Da Management Review Vol. 33 No.1, 2013 83
somewhat less than one and significantly more than zero. This means that the probability density function of weekly retums on commercial papers violates the assumption of normality.
Although the parameterαin the results of monthly retums in Table 2 is insignificantly different 企om zero, the results using monthly retums are similar to those using the daily and weekly retum data. In detail, both the parametersσ and λare a significant positive value as those of daily and weekly retum data,
indicating the significant interrelationship between commercial paper rate volatility and its level. Additionally, parameterβof monthly retum data is significantly smaller than zero and its absolute t-statistic is greater than those of daily and weekly retum data. The higher statistical significance of parameter β provides supportive evidence for the existence of mean reversion of monthly retums on commercial paper and sustains the argument that 企om low frequency data, it is easier to detect the tendency of mean reversion than from high
企equency data. However, interestingly the parameter r using monthly data is above unity and higher than those using daily and weekly data. According to Koutmos' (1998) argume帥, the distribution of short-term interest rates is normal if r =2. Therefore, the double exponential or Laplace density function is less appropriate for the distribution of monthly retums on commercial papers than for the distribution of the daily and weekly retum data.
F or further investigation of the impact of data frequencies on the commercial paper dynamics, this study also introduces quarter1y retums for empirical analysis that indicate the similar result of monthly retums where the estimators of α , β ,
σ , λand τare 0.029, -0.060, 0.001, 0.584, and 1.137, respectively (as shown in the result of quarter1y retums in Table 2). This result not only finds the dependence of commercial paper rate volatility on its level and the tendency of mean reversion for the quarter1y retum data
,
but also supports the argument: The lower the 企equency data, the easier detection by mean reversion. Meanwhile, the double exponential or Laplace density function is more suitable for the distribution of retum data with a higher frequency.Data Frequencies and Great Events
4.2. The Dynamics of Commercial Paper Rates across Frequencies
for the Periods before and after the Five Great Events
1n terms of the selection of great events, this study selects the most serious impasse in cross-strait relations (the Taiwan Strait missile crisis in 1996), the greatest economic event (the Asian financial crisis in 1997), the most devastating natural disaster (the 921 earthquake in 1999)
,
the greatest political event (the presidential election in 2000), and the most closely linked intemational event (the 911 terrorist attacks in 2001) faced by Taiwan during the research period as research subjects. Great events may lead to an obvious change of commercial paper rate behavior in emerging markets such as Taiwan because Sias, Starks, and Tinic (2001) indicated that when there are more noise traders in a market (i.e., an emerging market), the returns tend to show higher volati1ity and outstanding mean reversion. 1n addition, the five great events selected by this study have different attributes while different types of great events may result in difference of commercial paper rate behavior. As a result, the comparison of the dynamics of commercial paper rates for the periods before and after the above five great events will help understand the difference among the impact of a cross-strait impasse,economic event, natural disaster, political event, and intemational event on commercial paper rate behavior.
Panel A of Table 3 presents parameter estimates of the model given by equations (2)-(8) using daily return data for the periods before and after the five great events
,
respectively. From Panel A ofTable 3,
the majority ofthe estimators of parameterαare statistically insignificant for the periods before and after the five great events. In addition, this study supports that the level of commercial paper rates is a crucial determinant of the volatility of commercial paper rates because the estimators of parametersσand λare all positive and statistically significant using daily return data for the periods before and after the five great events. The result also shows that the sensitivity of volatility on commercial paper rates is less than one and that the volatility is dependent on the level of commercial paper rates. Moreover, in terms of parameter r , its estimators using daily return data are allless than one for the periods before and after the five greatChiaoDa A必nagementReview Vol. 33 No.1, 2013 85
events, and this implies that normality is not an appropriate probability density function for the daily returns on commercial papers. In the end, the estimators of
parameterβare significant1y less than zero for the periods after the Taiwan
S甘ait missile crisis, the Asian financial crisis, and the 921 earthquake, but it is a positive value for the period after the 911 terrorist attacks. The above result indicates that the main inf1uence of the great events on commercial paper rate behavior is the changes in the speed of mean-reverting around the great events.
In short, comparing the difference of the dynamics using daily return data for the periods between before and after the five great events, the changes in the dynamics appear to be insensitive to the five great events excluding the speed of mean-reverting (parameter β). If the five great events are viewed as a single event, the statistical significance of the estimated parameters for the period before the
“
whole" five great events is also similar to that after the“
whole" five great events (as shown in the first three lines and the last three lines in Panel A of Table 3). In terms of the comparison between the impacts of“
individual" great events,the most insensitive evidence among them is the reaction to the Taiwan Presidential election in 2000. The reasoning for this may arise 企om the fact that the effects of the 2000 Taiwan Presidential election on the commercial paper rate volati1ity are smaller than those of the Taiwan Strait missile crisis, the Asian financial crisis, the 921 earthquake, and the 911 terrorist attacks in the US. The empirical results provide evidence that the variation of commercial paper rates depends on fundamental economic factors, and that the impact of political factors on the level of commercial paper rates is limited.
F or determining why cross-strait impasse, financial crisis, natural disasters,
and international events generate a more profound impact on commercial paper rate dynamics than political events, three possible reasons are listed: The difference of substantial economic loss, the changes in investors' sentiments, and the expectation of investors. The 921 earthquake caused Taiwan an economic loss as high as NT$ 360 billion and according to S&P repo此 8 the 911 terrorist attacks generated a loss to the US of US$ 150 billion as the US is one of the leading
Data Frequencies and Great Events
trading partners of Taiwan. However, the presidential election held in 2000 did not cause Taiwan any substantial economic loss. As a result, there is a limited difference of commercial paper rate dynamics between before and after the 2000 presidential election. Furthermore, although the influence of the Asian financial crisis on Taiwan's economy is small in comparison with other Asian countries,
investors' sentiments after the Taiwan Strait missile crisis and the Asian financial crisis are more pessimistic than those after the 2000 presidential election. In the end, since Taiwanese democratic reform in the 1980s, political development has matured. Investors in the financial market speculated that the shift in ruling power in Taiwan and the result of the presidential election in 2000 did not deviate from the expectations of investors, so this political event has less of an impact on financial asset price behavior than the other four.
The estimators of the parameters using weekly retum data for the periods before and after the five great events are presented in Panel B of Table 3. A comparison of the parameters listed in Panel A of Table 3 with those in Panel B of Table 3 reveals that they are similar excluding parameterβ. The results of weekly retum data again indicate that the main influence of the great events on commercial paper rate dynamics is the difference of mean-reverting tendency between before and after the great events. However, in con甘ast to the results of the daily retum data, the results using weekly retum data reveal a significant tendency of mean reversion for the period before the great events excluding the 911 terrorist attacks. This implies that the data 企equencies had an impact on the mean-reverting speed of commercial paper rates around the great events. Additionally, as in the resuIts of the daily retum data, the differences of estimators of parametersσ , λ , and r using weekly retum data for the periods before and after the five great events are all somewhat obscure. This means that the great events did not affect the linkage between the conditional variance of commercial paper rates and their level as well as the shape of the distribution of commercial paper rates.
Panel C of Table 3 presents the estimators of the 5 parameters using monthly retum data for the periods before and after the five great events. As for the findings of weekly retum data
,
Panel C of Table 3 shows that the statisticalChiaoDaMαnagementReνiew Vol. 33 No.1, 2013 87
significance of parametersσ , λ , and r using monthly retum data for the
periods before the five great events are almost identical to those after the five great events. In addition, exc1uding the 921 earthquake, the supportive evidence of mean reversion only exists for the periods before the great events. The above results indicate that the impact of great events on commercial paper rate dynamic using monthly retum data mainly presents a significant1y different picture for the tendency of mean reversion before the events with that after the events.
The estimators of the 5 parameters using quarterly retum data for the periods before and after the five great events are shown in Panel D of Table 3. From Panel D of Table 3
,
the differences of the statistical significance of parametersα , β ,σ , λ , and r using quarterly retum data for the periods between before and
after the five great events are all somewhat obscure. This not only proves the argument that it is easier to detect the tendency of mean reversion from low
仕equency data, but also indicates that the influences of great events on
commercial paper rate dynamic using the low frequency data are lower than those using high frequency data.
Table 3
Maximum Likelibood Estimates of the Koutmos' (1998) Models Using Daily
,
Weekly,
Monthly,
and Quarterly Returns on the Commercial Paper beforeand after the Five Great Events
α β σ λ 7
Panel A: Daily Returns
Before Missile Crisis 6.39x 10⁻⁶ -3.66x 10
-4 0.001 0.586 0.737
(Before Five Great Events) (0.438) (-0.542) (16.345)** (47.582)** (58.745)**
(1982/01105 to 1996/03/07)
After Missile Crisis 4.53xl0-6 -0.001 0.001 0.641 0.860
(1996/03/08 to 2012/02/22) (2.275)** (-4.759)** (59.227)** (56.189)** (63.292)**
Before Financial Crisis 4.40xlO-6 -2.83x 10⁻⁴ 0.001 0.592 0.746
(1982/01105 to 1997/06/30) (0.319) (-0.435) (18.601)** (49.650)** (60.030)**
After Financial Crisis 7.42x 10⁻⁶ -0.001 2.20xlO-4 0.633 0.851
(1997/07/02 to 2012/02/22) (2.568)** (-7.582)** (54.02)** (52.463)** (62.519)**
Before 921 Earthquake 1.32xlO-6 -9.96x 10⁻⁵ 0.001 0.573 0.761
(1982/01/05 to 1999/09/20) (0.101) (-0.159) (23.096)** (48.713)** (59.377)**
After 921 Earthquake 3.28x 10⁻⁶ -0.001 1.58xl0
-4 0.670 0.818
(1999/09/23 to 2012/02/22) (1.363) (-2.630)** (52.730)** (54.704)** (64.311)**
Before Presidential Election 3.36x 10⁻⁶ -2.03x 10
-4 0.001 0.579 0.770
Data Frequencies and Great Events
After Presidential Election 7.60e xlO-7 -1.57xlO-4 1.59xl0-4 0.662 0.805 (2000/03/20 to 2012/02/22) (0.294) (-0.580) (60.806)** (53.812)** (63.557)** Before 911 Terrorist Attacks 2 .2 9x lO周7 -1.95xl0-5
0.001 0.584 0.767
(1982/01105 to 2001109/11) (0.020) (-0.035) (27.370)** (46.955)** (61.970)** After 911 Terrorist Attacks -4.32x 10⁻⁶
0.001 2.56x 10⁻⁴ 0.659 0.812 (After Five Great Events) (-1.331) (1.608) (53.329)** (52.846)** (66.075)** (2001109/12 to 2012/02/22)
Pane1 B: Weekly Retums
Before Missile Crisis 0.002 -0.016 1.49xlO-4 0.634 0.893
(Before Five Great Events) (3.790)** (-4.561)** (55.734)** (42.796)** (48.124)**
(1982/01105 to 1996/03/07)
After Missile Crisis -5.50xlO-6 1.57xlO-4 5.22x 10⁻⁷
0.680 0.836
(1996/03/08 to 2012/02/22) (-0.068) (0.113) (17.680)** (47.573)** (38.955)**
Before Financial Crisis 0.002 -0.016 8.62xl0-5
0.638 0.902 (1982/01105 to 1997/06/30) (3.796)** (-4.652)** (49.978)** (43.814)** (46.139)料
After Financial Crisis -1.06xlO-6 4.65xlO-5 2.74xlO-4
0.672 0.824 (1997/07/02 to 2012/02/22) (-0.012) (0.033) (17.132)** (44.793)** (40.220)**
Before 921 Earthquake 0.002 -0.015 1.49xlO-4 0.624 0.918
(1982/01105 to 1999/09/20) (3.858)** (-4.611)** (60.081)** (39.879)** (45.683)** After 921 Earthquake -3.94xlO-6 1.19xl0-4 2.26x 10⁻⁷
0.715 0.820
(1999/09/23 to 2012/02/22) (-0.045) (0.076) (14.193)** (45.622)** (39.416)** Before Presidential Election 0.001 -0.013 8.93x 10⁻⁷
0.617 0.915
(1982/01105 to 2000/03/17) (3.666)** (-4.613)** (56.143)** (37.331)** (46.292)** After Presidential Election 5.52x 10⁻⁶ -1.63xl0-4 1.35x 10⁻⁶
0.725 0.827 (2000/03/20 to 2012/02/22) (0.067) (-0.098) (17.599)** (51.719)** (41.248)** Before 911 Terrorist Attacks 2.76x 10⁻⁴ -0.003 1.49xl0-4 0.620 0.910
(1982/01105 to 2001109/11) (1.027) (-1.135) (49.984)** (40.183)** (46.205)** After 911 Terrorist Attacks -1.62xlO-5 4.68xlO-4 3.26x 10⁻⁷
0.716 0.838 (After Five Great Events) (-0.116) (0.138) (18.589)** (46.544)料 (37.689)** (2001109/12 to 2012/02/22)
Panel C: Monthly Retums
Before Missile Crisis 0.057 -0.110 3.01xl0-4 0.584 1.386
(Before Five Great Events) (4.365)** (-5.381)** (37.183)** (47.825)** (68.579)**
(1982/01/05 to 1996/03/07)
After Missile Crisis -5.66xlO-5 4.37xlO-4 3.25xl0-7
0.650 1.140 (1996/03/08 to 2012/02/22) (-2.465)** (1.317) (17.220)** (58.318)** (57.662)**
Before Financial Crisis 0.057 -0.111 4.68xlO-4 0.592 1.381
(1982/01105 to 1997/06/30) (4.824)** (-5.796)** (31.259)** (48.133)** (67.392)** After Financial Crisis 5.58xl0-7 -3.98xlO-6 1.73xlO-6
0.649 1.195 (1997/07/02 to 2012/02/22) (1.007) ( -1.185) (22.252)** (56.890)** (58.577)**
Before 921 Earthquake 0.062 -0.124 3.30x 10⁻⁴ 0.595 1.351
(1982/01105 to 1999/09/20) (5.577)** (-6.842)** (37.085)** (50.145)** (66.187)** After 921 Earthquake 1.34xlO-4 -0.010 3.31xl0-7
0.643 1.204
(1999/09/23 to 2012/02/22) (2.583)** (-3.664)** (17.947)** (55.943)** (59.458)** Before Presidential Election 0.054 -0.107 1.96xl0-4 0.598 1.345
(1982/01/05 to 2000/03/17) (5.162)** (-6.133)** (37.332)** (51.714)** (64.894)** After Presidential Election -8.68x 10⁻⁶ 5.82x 10⁻⁵ 1.71 x 10⁻⁶
Chiao Da Management Review Vol. 33 No.1, 2013 89
(2000/03/20 to 2012/02/22) (-0.506) (0.325) (12.835)** (56.806)** (61.539)** Before 911 Terrorist Attacks 0.026 -0.060 3.02xl0-4 0.602 1.348
(1982/01/05 to 2001/09/11) (3.165)** (-3.982)** (36.181)** (51.179)** (65.702)* After 911 Terrorist Attacks 6.55x 10⁻⁶ -4.14xl0-S 1.69xl0-6
0.636 1.212 (After Five Great Events) (1.497) ( -1.496) (18.013)** (53.095)** (58.985)* (2001109/12 to 2012/02/22)
Panel D: Quarter1y Returns
Before Missile Crisis 0.421 -0.261 0.007 0.563 0.958
(Before Five Great Events) (3.442)** (-4.091)** (49.586)** (48.125)** (56.432)**
(1982/01/05 to 1996/03/07)
After Missile Crisis 0.029 -0.068 1.34xl0-4 0.606 1.307 (1996/03/08 to 2012/02/22) (3.409)** (-4.208)** (23.091)** (51.797)** (61.801)**
Before Financial Crisis 0.457 -0.278 0.018 0.568 0.944
(1982/01/05 to 1997/06/30) (3.978)** (-4.557)** (45.348)** (49.879)** (57.624)**
After Financial Crisis 0.023 -0.047 0.002 0.599 1.316
(1997/07/02 to 2012/02/22) (2.646)** (-4.212)** (27.941)** (49.521)** (60.289)**
Before 921 Earthquake 0.342 -0.225 0.001 0.570 1.039
(1982/01105 to 1999/09/20) (3.487)** (-4.271)** (41.615)** (46.545)** (60.524)**
After 921 Earthquake 0.038 -0.081 0.004 0.602 1.245
(1999/09/23 to 2012/02/22) (3.062)料 (-3.905)申* (24.094)牢牢 (52.833) 牢牢 (63.807)串串
Before Presidential Election 0.341 -0.225 0.001 0.575 1.052
(1982/01/05 to 2000/03/17) (3.736)** (-4.537)** (42.647)** (50.630)** (58.409)** After Presidential Election 0.052 -0.110 0.004 0.596 1.241 (2000/03/20 to 2012/02122) (4.529)** (-5.536)** (26.878)** (48.694)** (62.059)** Before 911 Terrorist Attacks 0.331 -0.221 0.007 0.578 1.045
(1982/01105 to 2001109111) (3.963)** (-4.715)** (33.428)** (49.512)** (59.167)** After 911 Terrorist Attacks 0.077 -0.181 0.002 0.595 1.239 (After Five Great Events) (3.692)** (-4.268)** (29.511)** (48.343)** (60.058)** (2001/09/12 to 2012/02/22)
Note: “*" and “**" refer to significant at the 10 and 5 percent level, respectively; Figures in
parentheses are t-statistic.
4.3. The Mean Reversion of Commercial Paper Rates across
Frequencies
This study uses the variance ratio test of Poterba and Summers (1988) to examine the mean-reverting speed of commercial papers rates, and counts the variance ratios of the daily, weekly, monthly, and quarterly return data across different observation periods. The variance ratio [i.e., VR(的] refers to the 叫10 of the variance on the k-year holding period retums divided by k to the variance on the 0肘-year holding period returns. Therefore, as the time interval of a certain holding period increases to more than one year, VR(k[) < 1 shows negative
Data Frequencies and Great Events
autocorrelation (i. e., the commercial paper rates are affected by the transitory components and follow a mean reversion process) while VR(k[) > 1 shows positive autocorrelation. On the other hand
,
as the time interval of a certain holding period is less than the one year, VR(k[) < 1 refers to positive autocorrelation, while VR(k[) > 1 refers to negative autocorrelation. Table 4 displays the Poterba and Summers' (1988) variance ratios of commercial paper rates across the four 企equencles.From Table 4, the results of the daily, weekly, monthly, and quarter1y retum data all show that the commercial paper rates experience positive autocorrelation for the short term (shorter than one year) and negative autocorrelation for the
“
very" long term (more than 20-year or 24-year).9 That is, this study finds the evidence of mean reversion over “veη," long horizons for the Taiwanese commercial paper market. Further, in comparison with the supportive evidence of mean reversion of weekly,
monthly,
and quarter1y retum data after lagging for more than 24 years,
the empirical results of the daily retum data display that mean reversion is pronounced for holding period retums on commercial papers after lagging for more than 20 years. The findings of the daily retum data are inconsistent with the proposition of Balvers,
Wu,
and Gilliland (2000) that higher企equency data offer less additional information to detect a mean-reverting component. This study suggests that the reason for the significant mean-reverting behavior of the high frequency data might be from thin trading in the Taiwanese commercial paper market. In addition
,
the low sophistication of the Taiwanese commercial paper market may also con仕ibute to the negative autocorrelation of high frequency data.The results of monthly retums in Table 4 showing the negative autocorrelation of commercial paper rates after lagging for more than 24 years indicate the mean reversion of monthly retums on commercial papers in Taiwan,
these empirical results vary 企om the findings of Hays et al. (2000) (who declared
the finding of negative autocorrelation of short-term interest rates after lagging for more than one year). Explanations for the inconsistent results may arise from
Chiao Da .A也nagementReview Vol. 33 No.1, 2013 91
different research methods being used and the possible long-time overreaction of
investors in the Taiwanese commercial paper market. Comparatively speaking,
investors in Taiwan are more likely to overreact to information shocks for a longer
period of time than those in the US money markets
,
which leads to the slow speedof mean-reverting.
Table 4
The Poterba and Summers' (1988) Variance Ratios of Commercial Paper Rates across Frequencies
Return Measurement Interval
2 4 8 12 16 20 24
Day Week Month Quarter Years Years Years Years Years Years Years
Daily 0.004 0.026 0.101 0.288 1.764 2.837 4.084 3.497 2.042 0.782 0.338 Returns Weekly 0.023 0.092 0.265 1.781 2.925 4.642 4.417 2.321 1.284 0.379 Returns Mon也ly 0.102 0.287 1.780 2.929 4.645 4.401 2.940 1.233 0.367 Returns Quarterly 0.294 1.772 2.926 4.674 4.469 3.027 1.298 0.377 Returns
Note: “一" refers to the uncountable variance ratio because of the different data types.
On the whole
,
the implication of mean-reverting evidence in this studyregarding 'the Taiwanese commercial paper market coincides with previous
research, which focuses on short-term interest rates in developed coun甘les
(Adkins and Krehbiel, 1999; Casassus and Collin-Dufresne, 2005; Staikouras,
2006). The empirical results suggest that commercial paper rates across
企equencies are negatively autocorrelated in the
‘
very" long term and adopting acon甘anan s仕的egy 10 for commercial paper investment will obtain better
performance compared to using a momentum s甘ategy.ll In addition, this study
shows evidence of countering the weak -form e伍cient commercial paper market
10 The con仕arianinvesting is a s甘ategyof exploiting rnispricing, which buys the underperforrning
financial assets over the past 5 years (past losers) and sel1s the outperforrning ones over the past
5 years (past winners).
11 The momentum investing is a strategy of exploiting mispricing, which buys the outperforming
financial assets over the past 6 months (recent winners) and sells the underperforming ones
92
Data Frequencies and Great Events
and investors' preference for long-term investment as a result of risk consideration.
4.4. The Mean Reversion of Commercial Paper Rates across
Frequencies for the Periods before and after the Five Great
Events
In order to further understand the influence of the great events on the mean
reversion behavior of commercial paper rates, this study analyzes the changes of
mean-reverting speed for the periods before and after the Taiwan Strait missile
cnsls, the Asian financial cnSlS, the Taiwan 921 earthquake, the Taiwan
Presidential election in 2000, and the 911 terrorist attacks, respectively. Moreover,
the influential differences of these great events on the behavior of commercial paper rates across the four frequencies are compared. The empirical results are listed in Table 5.
The empirical results across the four 企equencies in Table 5 all show that both before and after the five great events, the variance ratios of Poterba and Summers (1988) with less than l-year retum measurement interval are smaller than 1. This implies that the commercial paper rates are positively autocorrelated in the short-term (less than 1 year). Additional妙" the commercial paper rates are negatively autocorrelated after lagging 2, 4, 6 or 8 years except for those after the Taiwan Strait missile crisis and the Asian financial crisis (i.e.; the variance ratios
of Poterba and Summers (1988) with 8-year retum measurement interval are
greater than 1). The above results do not contradict the finding of the whole research period in Table 4: The commercial paper rates are positively and negatively autocorrelated in the short-term and
“
very" long-term (more than 20 years),
respectively.Comparing the variance ratios of Poterba and Summers (1988) exploited by this study between before and after the five great events in Table 5, this study
finds that the mean-reverting speeds of commercial paper rates across 企equencles
after the first two (the Taiwan Strait missile crisis and the Asian financial crisis) and the last three (the Taiwan 921 earthquake, the 2000 Presidential election, and the 911 terrorist attacks) are slower and faster than before, respectively. This not
Chiao Da Management Review Vol. 33 No.l, 2013 93
Table 5
The Poterba and Summers' (1988) Variance Ratios of Commercial Paper Rates across Frequencies for the Periods before and after the Five Great
Events
2 4 6 8
Day Week Month Quarter Years Years Years Years Panel A: Daily Returns
Before Missile Crisis
(Before Five Great Events) 0.005 0.032 0.124 0.333 1.581 1.821 1.305 0.236 (1982/01/05 to 1996/03/07)
After Missile Crisis
0.004 0.023 0.089
(1996/03/08 to 2012/02122) 0.264 1.798 2.406 2.058 1.411
Before Financial Crisis
0.005 0.033 0.126 0.338 1.543 1.736 1.242 0.458
(1982/01/05 to 1997/06/30) After Financial Crisis
0.004 0.027 0.106 (1997/07/02 to 2012/02/22) 0.310 1.533 1.685 1.157 0.903 Before 921 Earthquake 0.006 0.033 0.129 0.346 1.512 1.659 1.150 0.451 (1982/01/05 to 1999/09/20) After 921 Earthquake 0.005 0.027 0.108 0.313 1.102 0.480 0.330 0.577 (1999/09/23 to 2012/02/22)
Before Presidential Election
0.006 0.033 0.128 0.344 1.481 1.623 1.119 0.445 (1982/01/05 to 2000/03/17)
After Presidential Election
0.005 0.033 0.129 0.368 0.957 0.327 0.233 0.489 (2000/03/20 to 2012/02122)
Before 911 Terrorist Attacks
0.006 0.033 0.128
(1982/01/05 to 2001/09/11) 0.343 1.488 1.564 1.097 0.499 After 911 Terrorist Attacks
(After Five Great Events) 0.005 0.031 0.121 0.343 1.160 0.403 0.086 0.091 (2001/09/12 to 2012/02/22)
Panel B: Week1y Returns Before Missile Crisis
(Before Five Great Events) 0.030 0.116 0.313 1.571 1.786 1.263 0.214 (1982/01/05 to 1996/03/07)
After Missile Crisis
0.021 0.082 0.241 1.794 2.441 2.221 1.647 (1996/03/08 to 2012/02/22)
Before Financial Crisis
0.030 0.118 0.318 1.533 1.701 1.205 0.432
(1982/01/05 to 1997/06/30) After Financial Crisis
0.024 0.096 0.281 1.547 1.821 1.309 1.020 (1997/07/02 to 2012/02/22) Before 921 Earthquake 0.031 0.121 0.326 1.497 1.618 1.107 0.430 (1982/01/05 to 1999/09/20) After 921 Earthquake 0.024 0.097 0.282 1.217 0.636 0.331 0.507 (1999/09/23 to 2012/02/22)
Before Presidential Election
0.031 0.120 0.324 1.466 1.580 1.075 0.424