行政院國家科學委員會專題研究計畫 成果報告
兒童青少年肥胖,體適能與學業表現關係之長期追蹤研究
(第 2 年)
研究成果報告(完整版)
計 畫 類 別 : 個別型 計 畫 編 號 : NSC 99-2410-H-028-002-MY2 執 行 期 間 : 100 年 08 月 01 日至 101 年 07 月 31 日 執 行 單 位 : 國立臺灣體育運動大學運動健康科學學系 計 畫 主 持 人 : 陳俐蓉 共 同 主 持 人 : 古博文 計畫參與人員: 碩士班研究生-兼任助理人員:方怡潔 報 告 附 件 : 出席國際會議研究心得報告及發表論文 公 開 資 訊 : 本計畫涉及專利或其他智慧財產權,2 年後可公開查詢中 華 民 國 101 年 08 月 21 日
中 文 摘 要 : 目的:本研究主要在探討六年長期追蹤調查之孩童肥胖與學 業成就之關係。 方法:2002 年台中市某國小一年級學生參與本研究,並追蹤 六年時間(樣本數為 409 人)。學業成就來自每年級學期末之 學校校務系統登記之分數;學生身高與體重系於每年級學期 初所測量之紀錄;身體質量指數(BMI)為體重(公斤)除以身高 (公尺)的平方,並以國際肥胖工作小組(IOTF)的標準定義正 常、過重及肥胖。並依據小一和小六體位的差異,將體位改 變情形作分類。多變量線性迴歸用來預測小六成績,並控制 個人基本資料、智商、和學校缺席日數。 結果:小一的肥胖盛行率,男生為 18.8%,女生為 15.2%,男 女生間無顯著差異存在(p=.346)。六年後,肥胖盛行率上 升,男生為 34.3%,女生為 20.7% (p=.002);大約 17.9%的 男生和 12.2%的女生一直都維持肥胖體位,16.9%的男生和 9.5%的女生由正常變成肥胖體位。迴歸結果顯示,不管男生 或女生,六年期間之體位改變與學業成就並無顯著關係存 在。 結論:本研究六年長期追蹤調查結果支持肥胖與學業成就之 間無顯著關係存在,提供現有文獻上體位改變與學業成就關 係更深入的了解。 中文關鍵詞: 肥胖,體適能,學業成就,學業表現,學術表現
英 文 摘 要 : Purpose: This study was designed to examine the association between childhood obesity and academic performance with six-year follow-up.
Methods: The first-grade students from one elementary school district in Taichung City, Taiwan participated in this study in 2002 and followed up for six years (n=409). Academic performance was extracted from the school records at the end of each grade. The weight and height were measured at the beginning of each grade and body mass index (BMI) was calculated as weight in kilograms divided by the square of height in meters. The International Obesity Task Force (IOTF) criteria were used to determine normal, overweight and obesity classifications. A weight change variable was created based on an individual’s weight status differences at grade one and grade six. Multivariate linear regression models for predicting academic performance at grade six were undertaken after adjusting for individual characteristics,
intelligence quotient (IQ) and absenteeism at school. Results: At the first grade, the prevalence of
overweight and obesity was 18.8% in boys and 15.2% in girls. No significant difference was found between genders in obesity prevalence (p=.346). The obesity increased after six years, with 34.3% in boys and 20.7% in girls (p=.002). Around 17.9% of boys and 12.2% of girls were always overweight/obese and 16.9% of boys and 9.5% of girls became overweight/obese. The results of the regression analyses revealed that change in weight status over a six-year period was not significantly associated with academic
performance among either boys or girls.
Conclusion: This study provided additional support of the lack of independent association of obesity on academic performance over six years, extending the understanding of the relationship between weight change and academic performance.
英文關鍵詞: obesity, fitness, academic performance, school performance, school achievement
國科會專題研究計畫期末報告
1
兒童青少年肥胖,體適能與學業表現關係之長期追蹤研究
A longitudinal study on obesity, physical fitness and academic performance
among children and adolescents
z 計畫類別( 單選) :新進人員研究計畫 z 研 究 型 別:個別型計畫 z 計 畫 歸 屬:人文處 z 申 請 機 構 / 系所( 單位): 國立臺灣體育運動大學 運動健康科學學系 z 本 計畫主持人姓名:陳俐蓉 z 本 計 畫 名 稱: 中文:兒童青少年肥胖,體適能與學業表現關係之長期追蹤研究
英 文:A longitudinal study on obesity, physical fitness and academic performance among children and adolescents
國科會專題研究計畫期末報告
2
兒童青少年肥胖,體適能與學業表現關係之長期追蹤研究
A longitudinal study on obesity, physical fitness and academic performance
among children and adolescents
Study one: A longitudinal study on childhood obesity and academic performance
Abstract
Purpose: This study was designed to examine the association between childhood obesity and
academic performance with six-year follow-up.
Methods: The first-grade students from one elementary school district in Taichung City, Taiwan
participated in this study in 2002 and followed up for six years (n=409).Academic performance was extracted from the school records at the end of each grade. The weight and height were measured at the beginning of each grade and body mass index (BMI) was calculated as weight in kilograms divided by the square of height in meters. The International Obesity Task Force (IOTF) criteria were used to determine normal, overweight and obesity classifications. A weight change variable was created based on an individual’s weight status differences at grade one and grade six. Multivariate linear regression models for predicting academic performance at grade six were undertaken after adjusting for individual characteristics, intelligence quotient (IQ) and absenteeism at school.
Results: At the first grade, the prevalence of overweight and obesity was 18.8% in boys and
15.2% in girls. No significant difference was found between genders in obesity prevalence (p=.346). The obesity increased after six years, with 34.3% in boys and 20.7% in girls (p=.002). Around 17.9% of boys and 12.2% of girls were always overweight/obese and 16.9% of boys and 9.5% of girls became overweight/obese. The results of the regression analyses revealed that change in weight status over a six-year period was not significantly associated with academic performance among either boys or girls.
Conclusion: This study provided additional support of the lack of independent association of
obesity on academic performance over six years, extending the understanding of the relationship between weight change and academic performance.
國科會專題研究計畫期末報告 3 中文摘要 Study one: 孩童肥胖與學業成就之長期追蹤調查 目的:本研究主要在探討六年長期追蹤調查之孩童肥胖與學業成就之關係。 方法:2002 年台中市某國小一年級學生參與本研究,並追蹤六年時間(樣本數為 409 人)。 學業成就來自每年級學期末之學校校務系統登記之分數;學生身高與體重系於每年級學期 初所測量之紀錄;身體質量指數(BMI)為體重(公斤)除以身高(公尺)的平方,並以國際肥胖 工作小組(IOTF)的標準定義正常、過重及肥胖。並依據小一和小六體位的差異,將體位改 變情形作分類。多變量線性迴歸用來預測小六成績,並控制個人基本資料、智商、和學校 缺席日數。 結果:小一的肥胖盛行率,男生為18.8%,女生為 15.2%,男女生間無顯著差異存在 (p=.346)。六年後,肥胖盛行率上升,男生為 34.3%,女生為 20.7% (p=.002);大約 17.9% 的男生和12.2%的女生一直都維持肥胖體位,16.9%的男生和 9.5%的女生由正常變成肥胖 體位。迴歸結果顯示,不管男生或女生,六年期間之體位改變與學業成就並無顯著關係存 在。 結論:本研究六年長期追蹤調查結果支持肥胖與學業成就之間無顯著關係存在,提供現有 文獻上體位改變與學業成就關係更深入的了解。
國科會專題研究計畫期末報告
4
A longitudinal study on childhood obesity and academic performance
Introduction
Obesity is increasingly prevalent among children and adolescents (L.-J. Chen, K. R. Fox, A. M. Haase, & J.-M. Wang, 2006; Lobstein, Baur, & Uauy, 2004). Evidence suggests that obesity during early years is associated with risk factors and related physical and psychosocial consequences (French, Story, & Perry, 1995; Must & Strauss, 1999; Regan & Betts, 2006; Williams, Wake, Hesketh, Maher, & Waters, 2005). However, less attention has been paid to the association between obesity and academic performance. A review paper found that from 1994 to 2004, only nine studies examining the link between childhood obesity and school performance were published (Taras & Potts-Datema, 2005), suggesting a lack of understanding in this area.
The previous limited studies showed a possible association between obesity and academic performance, showing obese children had a poor academic performance (Datar & Sturm, 2006; Datar, Sturm, & Magnabosco, 2004; Sabia, 2007; Sigfúsdóttir, Kristjánsson, & Allegrante, 2007). The findings from preceding studies suggested that obesity might have a negative effect on academic performance for children. However, more research is needed for addressing more potential confounders when examining the association between obesity and academic performance. The influence of being overweight or obese on academic performance might differ between genders. Moreover, absenteeism in school and intelligence quotient (IQ) could be important factors when examining the association between obesity and academic performance (Campos, Sigulem, Moraes, Escrivão, & Fisberg, 1996; Li, 1995; Schwimmer, Burwinkle, & Varni, 2003). Nevertheless, these factors have not been put into consideration in a single study. Additionally, longitudinal data are particularly scarce. Therefore, this study is designed to investigate the relationship between childhood obesity and academic performance over six years controlling for several important confounders.
國科會專題研究計畫期末報告
5
Methods
Participants
All of the first-grade students in 2002 in one school district in Taichung City, Taiwan were selected in this study. Data were collected from the beginning of grade one in 2002 as the baseline data and followed up to the end of grade six in 2008. Over a six-year period, 70 children had left the school, resulting in 409 participants (211 boys and 198girls).
Measures
Dependent variable
Academic performance was the mean scores of Language, Mathematics, Science and Social Studies, extracted from the school records at the end of each grade.
Independent variables
The weight and height were measured at school by the school nurse. Body mass index (BMI) was calculated as weight in kilograms divided by the square of height in meters (kg/m2). The International Obesity Task Force criteria (Cole, Bellizzi, Flegal, & Dietz, 2000) were used to determine normal, overweight and obesity classifications at each age and for each gender. As low obesity prevalence was consistently found, both the overweight and obesity figures were combined for some analyses and subsequently referred to as ‘overweight/obesity’. Then, three groups were categorized as ‘Never overweight/obese’ (the child was not overweight/obese at grade one and grade six), ‘Became overweight/obese’(the child was not overweight/obese at grade one but was overweight/obese at grade six), ‘Always overweight/obese’ (the child was overweight/obese at grade one and at grade six). There were very few cases (n=9) that went from being overweight/obese at grade one to not overweight/obese at grade six. These cases were dropped from analyses due to the insufficient statistical power.
國科會專題研究計畫期末報告
6
Absenteeism: the total number of days absent from school was collected from the school record from grade one to grade six.
Intelligence quotient (IQ): The Raven’s Colored Progressive Matrices (CPM) was administered at grade two in school. The Chinese version was developed and validated. The test-retest reliability of the Chinese version was .59 - .83 over a 4-week period and it was significantly associated with the Wechsler Intelligence Scale for Children (γ= .31-.33) (Hsu, 1990).
Demographic characteristics: variables included gender, parental education, having siblings or not, and whether the child belongs to single parent household. Age was not considered since all participants were first graders in 2002 and sixth graders in 2008 who were either 11 or 12 years old.
Statistical analysis
The differences between gender, weight status, and among the groups of weight status change were tested using χ2, T-test or ANOVA. In order to estimate the relationship between change in weight status and academic performance, multivariate linear regressions were used controlling for absenteeism, IQ and demographic characteristics. The dependent variable is academic performance at grade six.
Results Descriptive statistics
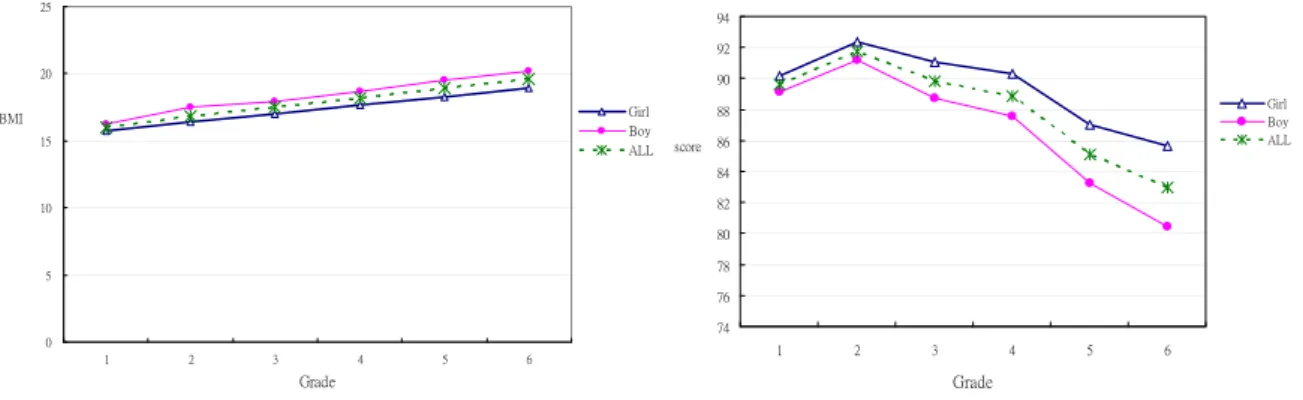
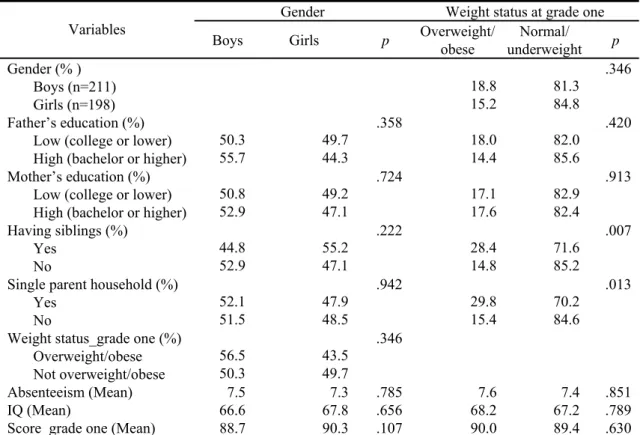
This study showed that 18.8% of the boys and 15.2% of the girls were either overweight or obese at baseline (gender difference: p=.346). However, the overweight/obesity prevalence increased after six years, with 34.3% in boys and 20.7% in girls (gender difference: p=.002). The figure of BMI changes over six years was shown in figure 1. The finding illustrated that the trajectory pattern of BMI was linear. However, the trajectory of changes in academic
國科會專題研究計畫期末報告
7
performance was non-linear, as shown in figure 2. The average score increased at the second grade than dropped sharply.
0 5 10 15 20 25 1 2 3 4 5 6 Grade BMI Girl Boy ALL 74 76 78 80 82 84 86 88 90 92 94 1 2 3 4 5 6 Grade score Girl Boy ALL
Figure 1: BMI change over six years Figure 2: Academic performance over six years
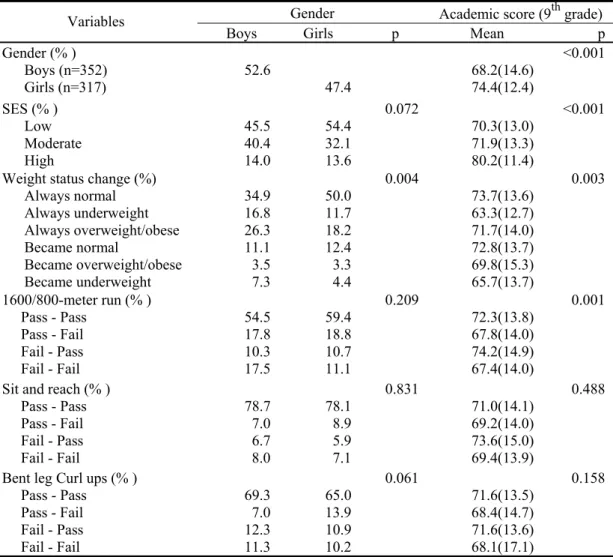
No significant difference was found between genders in demographic variables, IQ, absenteeism or academic performance at grade one (table 1). There was no significant difference between overweight/obese and not overweight/obese groups in gender, parental education, IQ, absenteeism or academic performance at grade one. However, children living in one child family or single parent household were more overweight/obese than the compared group.
國科會專題研究計畫期末報告
8
Table 1: Descriptive statistics by gender and weight status
Gender Weight status at grade one Variables
Boys Girls p Overweight/ obese underweight Normal/ p
Gender (% ) .346
Boys (n=211) 18.8 81.3
Girls (n=198) 15.2 84.8
Father’s education (%) .358 .420
Low (college or lower) 50.3 49.7 18.0 82.0
High (bachelor or higher) 55.7 44.3 14.4 85.6
Mother’s education (%) .724 .913
Low (college or lower) 50.8 49.2 17.1 82.9
High (bachelor or higher) 52.9 47.1 17.6 82.4
Having siblings (%) .222 .007
Yes 44.8 55.2 28.4 71.6
No 52.9 47.1 14.8 85.2
Single parent household (%) .942 .013
Yes 52.1 47.9 29.8 70.2
No 51.5 48.5 15.4 84.6
Weight status_grade one (%) .346
Overweight/obese 56.5 43.5
Not overweight/obese 50.3 49.7
Absenteeism (Mean) 7.5 7.3 .785 7.6 7.4 .851
IQ (Mean) 66.6 67.8 .656 68.2 67.2 .789
Score_grade one (Mean) 88.7 90.3 .107 90.0 89.4 .630
About18.0% of boys and 12.1% of girls were always overweight/obese and 17.0% of boys and 9.5% of girls became overweight/obese. No significant difference was found in absenteeism, IQ, and academic performance between groups.
The results from the multivariate regression analyses controlling for baseline academic performance, demographic variables, absenteeism, and IQ showed that Change in weight status over a six-year period was not significantly associated with academic performance among either boys or girls (all p>.05).
Acknowledgement
This work was funded by the Taiwan National Science Council (No.: NSC-99-2410-H-028-002-MY2)
國科會專題研究計畫期末報告
9 References
Campos, A. L., Sigulem, D. M., Moraes, D. E., Escrivão, A. M., & Fisberg, M. (1996). Intelligent quotient of obese children and adolescents by the Weschler scale. Revista de Saude
Publica, 30(1), 85-90.
Chen, L.-J., Fox, K. R., Haase, A. M., & Wang, J.-M. (2006). Obesity, fitness and health in Taiwanese children and adolescents. European Journal of Clinical Nutrition, 60(12), 1367-1375.
Cole, T. J., Bellizzi, M. C., Flegal, K. M., & Dietz, W. H. (2000). Establishing a standard definition for child overweight and obesity worldwide: international survey. BMJ, 320, 1240-1243.
Datar, A., & Sturm, R. (2006). Childhood overweight and elementary school outcomes.
International Journal of Obesity and Related Metabolic Disorders, 30(9), 1449-1460.
Datar, A., Sturm, R., & Magnabosco, J. L. (2004). Childhood overweight and academic
performance: national study of kindergartners and first-graders. Obesity Research, 12(1), 58-68.
French, S. A., Story, M., & Perry, C. L. (1995). Self-esteem and obesity in children and adolescents: a literature review. Obesity Research, 3, 479-490.
Hsu, C.-C. (1990). Raven’s Colored Progressive Matrices. Taiwan, Taipei: Chinese Behavioral Science Corporation.
Li, X. (1995). A study of intelligence and personality in children with simple obesity.
International Journal of Obesity and Related Metabolic Disorders, 19(5), 355-357.
Lobstein, T., Baur, L., & Uauy, R. (2004). Obesity in children and young people: a crisis in public health. Obesity Reviews, 5(Suppl: 1), 4-85.
Must, A., & Strauss, R. S. (1999). Risks and consequences of childhood and adolescent obesity.
International Journal of Obesity, 23(Suppl: 2), S2-S11.
Regan, F., & Betts, P. (2006). A brief review of the health consequences of childhood obesity. In N. Cameron, N. G. Norgan & G. T. H. Ellison (Eds.), Childhood obesity: contemporary
issues (pp. 39-49). London: Taylor & Francis.
Sabia, J. J. (2007). The Effect of Body Weight on Adolescent Academic Performance. Southern
Economic Journal, 73(4), 871-900.
Schwimmer, J. B., Burwinkle, T. M., & Varni, J. W. (2003). Health-related quality of life of severely obese children and adolescents. JAMA, 289(14), 1813-1819.
Sigfúsdóttir, I. D., Kristjánsson, A. L., & Allegrante, J. P. (2007). Health behaviour and academic achievement in Icelandic school children. Health Education Research, 22(1), 70-80. Taras, H., & Potts-Datema, W. (2005). Obesity and student performance at school. Journal of
School Health, 75(8), 291-295.
Williams, J., Wake, M., Hesketh, K., Maher, E., & Waters, E. (2005). Health-related quality of life of overweight and obese children. JAMA, 293(1), 70-76.
國科會專題研究計畫期末報告
10
兒童青少年肥胖,體適能與學業表現關係之長期追蹤研究
A longitudinal study on obesity, physical fitness and academic performance
among children and adolescents
Study two: Relationship between fitness and academic performance in adolescents
Abstract
Purpose: This study examined the association between fitness and academic performance in
adolescents with three-year follow-up.
Methods: The 7th graders from one junior high school district participated in this study (n=669).
and were followed up for three years (n=669, boys=352). Academic performance was extracted from school records at the end of each grade. Cardiovascular (CV) fitness, sit-and-reach flexibility, bent-leg curl-ups and height and weight for calculating body mass index (BMI) were assessed at the start of each grade. Univariate and multivariate linear regressions for predicting academic performance at grade nine was performed.
Results: The results showed that changes of weight status and cardiovascular fitness significantly
predicted academic performance (p=0.003 and 0.001, respectively), whereas changes of flexibility and muscle strength were unrelated to academic performance (p=0.188 and 0.158, respectively). Those who persisted in being underweight or who became underweight showed worse academic scores than those who were consistently normal weight (p=0.027 and p=0.018, respectively). Those who passed both CV fitness tests and those who failed in the first test but passed in the second had higher academic scores than those who went on to fail both tests (p=0.006 and p=0.017, respectively).
國科會專題研究計畫期末報告
11
A longitudinal study on the association of fitness with academic performance inng adolescents
Introduction
Physical fitness is shown to be associated with obesity, cardiovascular disease, skeletal health, and mental health (L. J. Chen, K. R. Fox, A. M. Haase, & J. M. Wang, 2006; Ortega, Ruiz, Castillo, & Sjöström, 2008). Recently, there is a small but increasing interest on the relationships between physical fitness and academic performance. The limited evidence base generally indicates that physical fitness is positively associated with academic performance (Chomitz et al., 2009; Welk et al., 2010).
One review of research showed that only four studies were found examining the link between physical fitness and academic performance and all studies were cross-sectional and correlational in design (Keeley & Fox, 2009). For example, one study reported a positive relationship between overall physical fitness and academic performance with a large sample size in the US (n=884715). The effect of this relationship was stronger for girls than boys and stronger for high social-economic status (SES) students than lower SES students (Grissom, 2005). Dwyer (Dwyer, Sallis, Blizzard, Lazarus, & Dean, 2001) used numerous subjective tests for measuring physical fitness and a rating of academic ability on a five-point scale to represent academic performance among 7961 Australian schoolchildren (7-15 year olds). Associations were found between cardiovascular fitness, muscular force/power, flexibility and academic ratings. Another research examined the association between various components of fitness and academic performance in 259 third-and fifth-grade American schoolchildren (Castelli, Hillman, Buck, & Erwin, 2007). The results showed that aerobic capacity and body composition was significant associated with academic performance, whereas muscle strength and flexibility fitness were unrelated to academic performance. A recent study with 134 elementary schoolchildren in the US found that aerobic fitness and muscular fitness, but not BMI, were related to mathematics scores
國科會專題研究計畫期末報告
12
(Eveland-Sayers, Farley, Fuller, Morgan, & Caputo, 2009). These findings suggested that a positive relationship existed between mainly cardiovascular fitness and academic performance and different components of fitness might have different effects on academic performance.
However, these cross-sectional studies are unlikely to provide an accurate estimate of the causal effect of physical fitness on academic performance. Longitudinal data controlling potential confounders (e.g., gender and SES) are limited with only one published prospective study found (London & Castrechini, 2011). London and Castrechini (London & Castrechini, 2011) examined the association between academic performance and overall physical fitness longitudinally from fourth to seven (n=1325) and sixth to ninth grades (n=1410) in the US. The results indicated that a combination of fitness tests was more predictive of academic performance than any one test. Students who were persistently fit had higher academic scores than those who were persistently unfit, suggesting improved fitness is associated with increased academic performance over time.
In order to add more evidence to the literature, the present study was designed to explore the longitudinal effects of different forms of fitness on academic performance among adolescents.
Methods
Participants
This study was conducted in one high school district in Taichung City in Taiwan. All students who enrolled in the school at grade seven (n=723) were invited to take part in this study. Any student who moved out of the district, students with disability, or who did not return the consent form was excluded from this study. The final sample was 669 with 352 boys and 317 girls (mean age = 14.6). They participated in this study in 2008 year and were followed up for three years from grade seven to grade nine until 2011.
國科會專題研究計畫期末報告
13
Academic performance was the outcome variable, which was measured as the mean score of Language, Mathematics, Science and Social Studies. All students took exactly the same tests in school and the scores were extracted from the school records at the end of each grade, ranging from 0 to 100.
The fitness tests were completed during physical education (PE) classes between October and November each year, and administered by the Chief of PE to ensure consistency from grade seven to grade nine. The fitness tests included four measures: (1) 1600(boys)/800(girls)-meter run was used to assess cardiovascular endurance; (2) The standardised sit-and-reach test was used to measure the lower back and hip joint flexibility; (3) The number of bent-leg curl-ups attained in 1min was used to test abdominal muscle strength and endurance; (4) Body composition was obtained through measured height and weight by the school nurse.
The raw scores of the 1600(boys)/800(girls)-meter run, sit-and-reach test and bent-leg curl-ups were converted into a percentile rank (PR) based on normative data at each age and for each gender in Taiwan. Then, the above fitness results were grouped into two levels: ‘pass’ and ‘fail’. Those who had fitness PR less than the 25th were classified as ‘fail’, which was suggested by the Taiwan Ministry of Education as ‘needs improvement’. Changes in fitness levels were created based on the difference between each child’s scores in 7th grade and 9th grade. Four groups were
categorized: ‘pass-pass’ (pass at 7th grade and 9th grade), ‘pass-fail’ (pass at 7th grade but fail at 9th grade), ‘fail-pass’ (fail at 7th grade but pass at 9th grade), ‘fail-fail’ (fail at 7th grade and 9th grade).
Weight and height were converted to BMI and children categorized as underweight, normal weight, overweight and obesity using age and gender specific criteria suggested by the Taiwan Ministry of Education (Taiwan Ministry of Education, 2011). Both the overweight and obesity figures were combined for analyses and subsequently referred to as ‘overweight/obesity’. Then, a weight change variable was created based on an individual’s weight status difference between 7th
國科會專題研究計畫期末報告
14
grade and 9th grade. Six groups were categorized as ‘always normal’ (normal weight at 7th grade and 9th grade), ‘always underweight’ (underweight at 7th grade and 9th grade), ‘always overweight/obese’ (overweight/obese at 7th grade and 9th grade), ‘became normal’ (not normal weight at 7th grade but was normal weight at 9th grade), ‘became overweight/obese’ (not overweight/obese at 7th grade but was overweight/obese at 9th grade), ‘became underweight’ (not underweight at 7th grade but was underweight at 9th grade).
Variables including gender and parental socio-economic status (SES) were collected at 7th grade. These factors have been shown to be associated with children’s academic performance (Datar & Sturm, 2006; Sigfúsdóttir et al., 2007). SES was assessed by parents’ occupation and education based on Hollingshead’s ‘Two Factor Index of Social Position’, modified to fit Taiwanese society by Lin (Lin, 1994). Parents’ occupation and education were both divided into 5 levels and scored from 5 to 1. The SES score was obtained with occupational score× 7 + educational score× 4 (Chen, Fox, Haase, & Ku, 2010). Scores were then grouped into tertiles (low, moderate and high). The child’s age was not considered since all participants were 7th graders in 2008-2009 school year.
Statistical analysis
Means and percentages of variables were calculated for gender and academic performance at grade nine. The differences were tested using χ2, t-test or analysis of variance (ANOVA). In order to estimate the relationship between change in fitness levels and academic performance, univariate and multivariate linear regressions were conducted. The dependent variable was academic performance at 9th grade. Variables showing significant relationships with academic performance in the univariate model were then entered into a multivariate model simultaneously. The above analyses were performed with SPSS 16.0 for Windows.
國科會專題研究計畫期末報告
15
Descriptive statistics
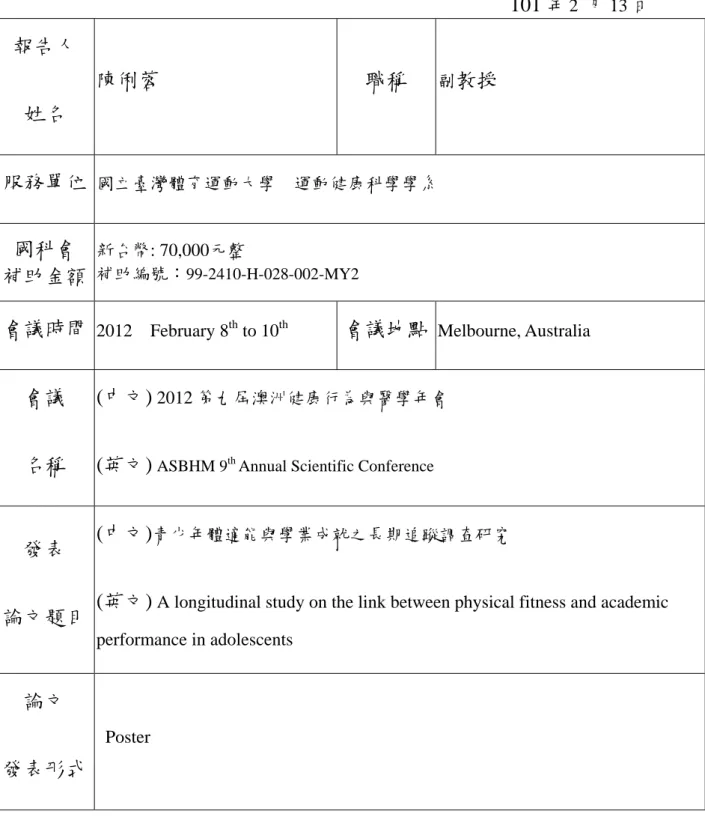
Table 1 provides descriptive statistics by gender and academic performance at grade nine for SES and all fitness components. About one third of boys and half of girls remained normal weight. More than one quarter of boys and 18.2% of girls persisted overweight or obese. Less than 4.0% of students became overweight or obese in either boys or girls. The prevalence of became underweight ranged from 4.4% to 7.3% for girls and boys. No significant gender difference was found in SES, changes of cardiovascular fitness, flexibility and muscular strength (p=0.072, 0.209, 0.831, and 0.061, respectively). Significant associations were found in gender, SES, changes of weight status and cardiovascular fitness with academic performance (p<0.001, p<0.001, p=0.003, p=0.001, respectively).
Table 1: Descriptive statistics by gender and academic performance
Gender Academic score (9th grade) Variables
Boys Girls p Mean p
Gender (% ) <0.001 Boys (n=352) 52.6 68.2(14.6) Girls (n=317) 47.4 74.4(12.4) SES (% ) 0.072 <0.001 Low 45.5 54.4 70.3(13.0) Moderate 40.4 32.1 71.9(13.3) High 14.0 13.6 80.2(11.4)
Weight status change (%) 0.004 0.003
Always normal 34.9 50.0 73.7(13.6) Always underweight 16.8 11.7 63.3(12.7) Always overweight/obese 26.3 18.2 71.7(14.0) Became normal 11.1 12.4 72.8(13.7) Became overweight/obese 3.5 3.3 69.8(15.3) Became underweight 7.3 4.4 65.7(13.7) 1600/800-meter run (% ) 0.209 0.001 Pass - Pass 54.5 59.4 72.3(13.8) Pass - Fail 17.8 18.8 67.8(14.0) Fail - Pass 10.3 10.7 74.2(14.9) Fail - Fail 17.5 11.1 67.4(14.0)
Sit and reach (% ) 0.831 0.488
Pass - Pass 78.7 78.1 71.0(14.1)
Pass - Fail 7.0 8.9 69.2(14.0)
Fail - Pass 6.7 5.9 73.6(15.0)
Fail - Fail 8.0 7.1 69.4(13.9)
Bent leg Curl ups (% ) 0.061 0.158
Pass - Pass 69.3 65.0 71.6(13.5)
Pass - Fail 7.0 13.9 68.4(14.7)
Fail - Pass 12.3 10.9 71.6(13.6)
Fail - Fail 11.3 10.2 68.1(17.1)
國科會專題研究計畫期末報告
16
Univariate and multivariate linear regressions
A small amount variance was explained by gender (4.9%) and SES (6.0%), illustrating that girls and those in the higher SES reported greater academic scores than the reference group. Weight status change was a significant predictor of academic performance (R2=3.0, p=0.003). Students who persisted to be underweight or became underweight had lower academic scores than those who persisted to be normal weight (p=0.002 and 0.001, respectively). Less than 3% of variance was explained by cardiovascular fitness, flexibility and muscular strength separately (2.9%, 0.4% and 0.9%, respectively). Those who went on to pass cardiovascular fitness tests and those who failed in the first test but passed in the second showed higher scores than those who went on to fail both tests (p=0.006 and 0.005, respectively). No relationship was found between changes of flexibility and muscular strength with academic scores (p=0.488 and 0.158, respectively).
Simultaneous multiple regression analysis was performed to explore predictors of academic performance and determine the proportion of variance explained by key variables. Four variables (gender, SES, changes of weight status and cardiovascular fitness) were entered into the multivariate model. Similar results were found between univariate and multivariate models among these variables. Boys and those who went on to be underweight or became underweight had worse academic performance than girls and those who went on to be normal weight (p<0.001, p=0.027 and p=0.018, respectively). Students who were in the high SES, who passed both cardiovascular fitness tests and who failed in the first test but passed in the second had higher academic scores than those who were in the moderate SES and who went on to fail both tests (p<0.001, p=0.006 and p=0.017, respectively).
Conclusions
This research demonstrated that various forms of fitness have different relationships with academic performance with three-year follow-up among schoolchildren. The findings suggested
國科會專題研究計畫期末報告
17
that changes of muscle strength and flexibility fitness were unrelated to academic performance, which is consistent with previous cross-sectional studies (Castelli et al., 2007; Edwards, Mauch, & Winkelman, 2011). Changes of weight status and cardiovascular fitness were significant predictors for overall academic performance
Acknowledgements
This work was supported by the Taiwan National Science Council (NSC-99-2410-H-028-002-MY2).
References
Campos, A. L., Sigulem, D. M., Moraes, D. E., Escrivão, A. M., & Fisberg, M. (1996). Intelligent quotient of obese children and adolescents by the Weschler scale. Revista de Saude
Publica, 30(1), 85-90.
Castelli, D. M., Hillman, C. H., Buck, S. M., & Erwin, H. E. (2007). Physical fitness and academic achievement in third- and fifth-grade students. Journal of Sport & Exercise
Psychology, 29, 239-252.
Chen, L.-J., Fox, K. R., Haase, A. M., & Wang, J.-M. (2006). Obesity, fitness and health in Taiwanese children and adolescents. European Journal of Clinical Nutrition, 60(12), 1367-1375.
Chen, L. J., Fox, K. R., Haase, A. M., & Ku, P. W. (2010). Correlates of body dissatisfaction among Taiwanese adolescents. Asia Pacific Journal of Clinical Nutrition, 19(2), 172-179. Chen, L. J., Fox, K. R., Haase, A. M., & Wang, J. M. (2006). Obesity, fitness and health in
Taiwanese children and adolescents. European Journal of Clinical Nutrition, 60(12), 1367-1375.
Chomitz, V. R., Slining, M. M., McGowan, R. J., Mitchell, S. E., Dawson, G. F., & Hacker, K. A. (2009). Is there a relationship between physical fitness and academic achievement?
Positive results from public school children in the northeastern United States. Journal of
School Health, 79(1), 30-37.
Cole, T. J., Bellizzi, M. C., Flegal, K. M., & Dietz, W. H. (2000). Establishing a standard definition for child overweight and obesity worldwide: international survey. BMJ, 320, 1240-1243.
Datar, A., & Sturm, R. (2006). Childhood overweight and elementary school outcomes.
International Journal of Obesity and Related Metabolic Disorders, 30(9), 1449-1460.
Datar, A., Sturm, R., & Magnabosco, J. L. (2004). Childhood overweight and academic
performance: national study of kindergartners and first-graders. Obesity Research, 12(1), 58-68.
Dwyer, T., Sallis, J. F., Blizzard, L., Lazarus, R., & Dean, K. (2001). Relation of academic performance to physical activity and fitness in children. Pediatric Exercise Science, 13, 225-237.
國科會專題研究計畫期末報告
18
Edwards, J. U., Mauch, L., & Winkelman, M. R. (2011). Relationship of nutrition and physical activity behaviors and fitness measures to academic performance for sixth graders in a midwest city school district. Journal of School Health, 81(2), 65-73.
Eveland-Sayers, B. M., Farley, R. S., Fuller, D. K., Morgan, D. W., & Caputo, J. L. (2009). Physical fitness and academic achievement in elementary school children. Journal of
Physical Activity and Health, 6(1), 99-104.
French, S. A., Story, M., & Perry, C. L. (1995). Self-esteem and obesity in children and adolescents: a literature review. Obesity Research, 3, 479-490.
Grissom, J. B. (2005). Physical fitness and academic achievement. Journal of Exercise
Physiology, 8(1), 11-25.
Hsu, C.-C. (1990). Raven’s Colored Progressive Matrices. Taiwan, Taipei: Chinese Behavioral Science Corporation.
Keeley, T. J. H., & Fox, K., R. (2009). The impact of physical activity and fitness on academic achievement and cognitive performance in children. International Review of Sport and
Exercise Psychology, 2(2), 198-214.
Li, X. (1995). A study of intelligence and personality in children with simple obesity.
International Journal of Obesity and Related Metabolic Disorders, 19(5), 355-357.
Lin, S.-C. (1994). Sociology Education. Kao Hsiung: Fu Wen.
Lobstein, T., Baur, L., & Uauy, R. (2004). Obesity in children and young people: a crisis in public health. Obesity Reviews, 5(Suppl: 1), 4-85.
London, R. A., & Castrechini, S. (2011). A longitudinal examination of the link between youth physical fitness and academic performance. Journal of School Health, 81(7), 400-408. Must, A., & Strauss, R. S. (1999). Risks and consequences of childhood and adolescent obesity.
International Journal of Obesity, 23(Suppl: 2), S2-S11.
Ortega, F. B., Ruiz, J. R., Castillo, M. J., & Sjöström, M. (2008). Physical fitness in childhood and adolescence: a powerful marker of health. International Journal of Obesity, 32, 1-11. Regan, F., & Betts, P. (2006). A brief review of the health consequences of childhood obesity. In N. Cameron, N. G. Norgan & G. T. H. Ellison (Eds.), Childhood obesity: contemporary
issues (pp. 39-49). London: Taylor & Francis.
Sabia, J. J. (2007). The Effect of Body Weight on Adolescent Academic Performance. Southern
Economic Journal, 73(4), 871-900.
Schwimmer, J. B., Burwinkle, T. M., & Varni, J. W. (2003). Health-related quality of life of severely obese children and adolescents. JAMA, 289(14), 1813-1819.
Sigfúsdóttir, I. D., Kristjánsson, A. L., & Allegrante, J. P. (2007). Health behaviour and academic achievement in Icelandic school children. Health Education Research, 22(1), 70-80. Taiwan Ministry of Education. (2011). Fitness norm_body composition. Retrieved 21st
September, 2011, from http://www.fitness.org.tw/model08.php
Taras, H., & Potts-Datema, W. (2005). Obesity and student performance at school. Journal of
School Health, 75(8), 291-295.
Welk, G. J., Jackson, A. W., Morrow, J. R. J., Haskell, W. H., Meredith, M. D., & Cooper, K. H. (2010). The association of health-related fitness with indicators of academic performance in Texas schools. Research Quarterly for Exercise and Sport, 81(3), S16-S23.
Williams, J., Wake, M., Hesketh, K., Maher, E., & Waters, E. (2005). Health-related quality of life of overweight and obese children. JAMA, 293(1), 70-76.
表 Y04
國科會補助出席國際學術會議報告
101
年 2 月 13 日報告人
姓名
陳俐蓉
職稱
副教授
服務單位
國立臺灣體育運動大學 運動健康科學學系國科會
補助金額
新台幣: 70,000元整 補助編號:99-2410-H-028-002-MY2會議時間
2012 February 8th to 10th會議地點
Melbourne, Australia會議
名稱
(中文)
2012 第九屆澳洲健康行為與醫學年會(英文)
ASBHM 9th Annual Scientific Conference發表
論文題目
(中文)
青少年體適能與學業成就之長期追蹤調查研究(英文)
A longitudinal study on the link between physical fitness and academic performance in adolescents論文
發表形式
表 Y04
報告內容
一、會議性質介紹:
第九屆之澳洲健康行為與醫學會(Australian Society for Behavioral
Health and Medicine, ASBHM)學術會議(9
thAnnual Scientific
Conference)於澳洲墨爾本(Melbourne)城市舉辦,會議期間為2012
年2月8日至10日,共計3日。舉辦地點在 Rydge Hotel, Melbourne。本
會議係由澳洲健康行為醫學會主辦,主要會員國為澳洲與紐西蘭等亞
太國家。澳洲健康行為與醫學會之學術研討會係國際間研究健康行為
與醫學領域之重要學術會議,其任務為提供健康行為與醫學領域之研
究者發表與討論的研究空間,在推動健康行為與醫學的發展與實踐,
並促進健康行為與醫學的影響與世界交流,其中身體活動(運動行為)
為該學會之重要議題之ㄧ。
本次研討會主題為:縮減差距:強化夥伴關係以了解與改善民眾
健康行為(Closing the gaps: Strengthening partnerships for understanding
and improving health behaviors)。三天緊湊的會議行程包含下列子題:
Health behaviours (健康行為)、Indigenous health issues (原住民健康議
題)、Cancer (癌症)、Translation of research to policy and practice (研究轉
表 Y04
平)、Intervention and Program Evaluation (介入與方案評估)、Chronic
Disease Prevention and Management (慢性疾病的預防與管理)、Eating
Issues (飲食行為)、Unhealthy Behaviours: Alcohol and Smoking (不健康
行為:喝酒與抽菸)、 Factors Affecting Health Behaviour Change (影響建
康行為改變之因子)、Critical Perspectives (批判觀點)、Quality of Life
Issues (生活品質)、Work-Related Health (職場健康)、Emotional,
Cognitive and Social Issues Related to Health and Illness Behaviours (各種
與健康疾病有關之情緒、認知與社會議題)。
因此,該研討會吸引來自澳洲、紐西蘭、美國、英國及台灣等地
的心理學家、臨床學者、教育學者、研究者、運動教練等共襄盛舉,
相互交流與討論相關研究。
二、參加會議經過;
研討會會議於 2 月 8 日開始至 10 日結束。參與人數中,亞太地區
參與人數佔多數,人員包含癌症研究學會研究員、大學教授、臨床醫
生與學者,另外,有部份為碩博士學生。由於會議議題眾多,內容極
為多元與豐富,會議議程亦相當緊湊。會議議程從早上 9:00 開始,排
到晚上 6:00 結束。除了上述提及研討會議題外,本研討會形式亦包含
專題演講 (keynotes)、專題座談會 (symposia)、專題討論會
表 Y04
(workshops)、口頭發表(oral presentations) 以及海報發表 (posters)等,
同一時段在不同會議廳,各有不同子題同時進行發表。
三、參加會議心得
z 本次會議係屬中型研討會(人數約為 300 人)。主要參與者均對
健康行為與醫學有濃厚興趣,因此在口頭研究發表當中,提問
情況相當踴躍。海報發表之交流情形亦不惶多讓。由於身體活
動為該研討會之主要子題之ㄧ,本人所發表之體適能與學業成
就一文,引起研究者的興趣並接收到許多肯定。其中,澳洲
Deakin University 團隊在學童身體活動之推動促進與介入等研
究相當豐碩,值得學習。
z 本研討會有許多學者進行跨理論模式(Transtheoretical Model,
TTM)研究,及有關影響健康行為之相關因素之探討,可供未
來進行運動行為研究之參考。另外,有學者對 facebook 中的
image 對學生進行身體意象、體型滿意度與飲食及減重行為之
相關研究,議題頗為新穎。
四、相關參考資料
表 Y04
攜回該研討會會議議程及相關書面資料
五、成果照片 (圖 1 - 圖 3)
圖 1:海報發表 1 圖 2:海報發表 2 圖 3:海報發表 3表 Y04
表 Y04
國科會補助計畫衍生研發成果推廣資料表
日期:2012/06/15國科會補助計畫
計畫名稱: 兒童青少年肥胖,體適能與學業表現關係之長期追蹤研究 計畫主持人: 陳俐蓉 計畫編號: 99-2410-H-028-002-MY2 學門領域: 運動心理學無研發成果推廣資料
99 年度專題研究計畫研究成果彙整表
計畫主持人:陳俐蓉 計畫編號:99-2410-H-028-002-MY2 計畫名稱:兒童青少年肥胖,體適能與學業表現關係之長期追蹤研究 量化 成果項目 實際已達成 數(被接受 或已發表) 預期總達成 數(含實際已 達成數) 本計畫實 際貢獻百 分比 單位 備 註 ( 質 化 說 明:如 數 個 計 畫 共 同 成 果、成 果 列 為 該 期 刊 之 封 面 故 事 ... 等) 期刊論文 0 0 100% 研究報告/技術報告 0 0 100% 研討會論文 0 0 100% 篇 論文著作 專書 0 0 100% 申請中件數 0 0 100% 專利 已獲得件數 0 0 100% 件 件數 0 0 100% 件 技術移轉 權利金 0 0 100% 千元 碩士生 0 0 100% 博士生 0 0 100% 博士後研究員 0 0 100% 國內 參與計畫人力 (本國籍) 專任助理 0 0 100% 人次 期刊論文 1 1 100% 目前 1 篇已被國際 SCI 期 刊 接 受 刊 登,另有 1 篇投稿 於國際 SCI 期刊目 前正審查中 研究報告/技術報告 0 0 100% 研討會論文 3 2 100% 篇 截 至 目 前 為 止 已 參加並發表 3 篇論 文 於 國 際 研 討 會 中 論文著作 專書 0 0 100% 章/本 申請中件數 0 0 100% 專利 已獲得件數 0 0 100% 件 件數 0 0 100% 件 技術移轉 權利金 0 0 100% 千元 碩士生 0 0 100% 博士生 0 0 100% 博士後研究員 0 0 100% 國外 參與計畫人力 (外國籍) 專任助理 0 0 100% 人次其他成果