The intraday price discovery of Taiwan’s dual-trading
foreign exchange market
臺灣同步交易外匯市場間之日內價格發現
Dar-Hsin ChenDepartment of Business Administration, National Taipei University
Ying-Hsin Lee1
Department of Business Administration, National Taipei University
Abstract: This paper examines the role of price discovery in Taiwan’s two foreign exchange markets during trading days. The minor market, Cosmos Foreign Exchange International Co., has small optimal trading timing, but has a greater mean saving for liquidity dealers. The major market, Taipei Foreign Exchange Co., contributes more information for transaction price discovery, especially during the market opening and closing periods. However, the minor market dominants price discovery for the bid price, because it has the lowest cost in dealing. The causality is bidirectional between the two markets for transaction price, ask price, and spread, but unidirectional for the bid price. Finally, using high-frequency data is essential for detecting price discovery in the spot foreign exchange market, which is especially valid as larger discrepancies of transaction prices between the two markets disappear.
Keywords: Cointegration, Vector error correction model, Foreign exchange market, Price discovery.
1. Introduction
In terms of market microstructure, incorporating new information into the price adjustment process is a central issue, with informed dealers exploiting their information advantage through trading. Accordingly, the effect of information on trading strategies for informed and uninformed dealers may influence the market
1
Corresponding author: Department of Business Administration, National Taipei University, 151 University Rd., San Shia, New Taipei City, 237 Taiwan,E-mail: [email protected].
equilibrium during the day. Many scholars in the past few decades have investigated information spillover, price discovery, and co-movement in stock, futures, and options markets (e.g., Chan et al., 2007; Chang, Chen, and Yang, 2015; Demian, 2011; Gebka and Serwa, 2006; Giannellis and Papadopoulos, 2011; Hasbrouck, 1995; Lieberman, Ben-Zion, and Hauser, 1999; Lin and Ma,
2014; Wang and Bhar, 2014; Piccotti and Schreiber, 2015; Tse, Xiang and Fung, 2006).
Extensive research on the spot foreign exchange market (FX market) has targeted the relationship of a parallel market in a specific country’s currency or a group of countries’ currencies (Aggarwal and Mougouè, 1996; Aslanidis and Kouretas, 2005; Kanas and Kouretas, 2001) through daily or weekly data. In particular, the interbank New Taiwan dollar relative to the US dollar (NTD/USD) exhibits dual trading at two foreign exchange markets in Taiwan: Taipei Foreign Exchange Co. (TFE) and Cosmos Foreign Exchange International Co. (CFE).2 Subject to data availability, few studies have utilized daily data to look into this issue (Chang, 2007; Kao and Wan, 2012; Wan and Kao, 2009).3 Because little is known about the role of intraday price discovery and the benefits of trading in a parallel FX market, this research aims to fill the gap in the related literature
The transition speed of price information between different markets impacts the returns that informed dealers are expecting to gain in other markets (Lieberman et al., 1999). Not only is the liquidity effect on the foreign exchange market transitory, but the persistence of the intraday exchange rate volatility set off by public information is also extended by traders’ private information for about 15 minutes (Chang and Taylor, 2003). Using lower frequency data should result in a less likely scenario of determining the sequence of information arrival and the correlation of innovations. Thus, we complement the previous research by exploring the intraday price discovery roles of these two foreign exchange markets, and our findings offer an intraday order-submitting strategy for dealers.
According to the Law of One Price (LOP), when transaction costs are near
2
Taipei Foreign Exchange Company, the larger of the two, accounts for 70% market share.
3
Chang (2007) examined the differences and determinants of the NTD/USD bid-ask spread and trading volume in TFE and CFE. Kao and Wang (2012) and Wan and Kao (2009) considered the price adjustment process and the role of price discovery in TFE and CFE, using market opening or market closing data.
zero, prices will be identical across all markets and the markets will be integrated. Lok and Kalev (2006) suggested that if price discovery is asymmetric, then new information that arises may cause a short-run deviation from the equilibrium. When the price difference of a homogeneous good between different locations is greater than the transaction costs of trading that good between these locations, traders will engage in spatial arbitrage (Greb et al., 2013). Consequently, inter-market arbitrage keeps prices cointegrated, thus reducing information asymmetry across markets and increasing liquidity in all markets (Tse, Bandyopadhyay, and Shen, 2006).
Under the situation of two or more markets, the dominant market generally should be both timely and efficient at incorporating new information implicit in dealer trading into market prices (Lehmann, 2002), which means leading the satellite markets in price discovery. In fact, the satellite markets have a larger error-correction when they have only partial contribution to price discovery. Several studies have noted that the market providing greater liquidity and lower transaction costs is likely to play a more important role in price discovery (Lok and Kalev, 2006; Hasbrouck, 1995; Piccotti and Schreiber, 2015; Tse et al., 2006). However, Kao and Wan (2012) and Wan and Kao (2009) found that CFE, as the minor market with less liquidity and trading volume, contributes more information to price discovery in Taiwan’s FX market.
This paper differs from previous studies as follows. First, there was an amendment on July 29, 2011 of the regulations governing Foreign Exchange Brokers in which the Central Bank of Taiwan may revoke or void the license of any foreign exchange broker if evidence exists indicating that the broker’s business operations are unable to meet the financial policy requirements. As such, the market opening or closing price might be influenced by the intervening strategy of the Central Bank of Taiwan in the two markets. We thus utilize recent intraday data of this dual-listed currency, which has the same overlapping trading hours to ensure simultaneity of observed prices across markets.
Second, while observing pre-trade information on both markets’ screens, dealers could freely submit their limit (market) orders in the separate markets to provide (take) liquidity. The dealers’ conditional expectation sequences play central roles in determining trading strategies and pricing (Harsbrouck, 2002). According to the rule of least cost dealing (LCD), dealers are routed to the
market with a better price for a single trade (Kaul and Mehrotra, 2007). Thus, the bid and ask quotes in the process of price formation is asymmetrical (Pascual and Pascual-Fuster, 2014). In this setting, we further explore which FX market contributes more information to the ask and bid prices, aside from the transaction price.
The main findings can be summarized as follows. First, the intraday pattern over our sample implies that the Central Bank steps into TFE alone at 15:30 local time, while intending to simultaneously perform interventions in both CFE and TFE at the end of the trading day. This finding runs contrary to previous studies on the two markets (Chang, 2007; Kao and Wang, 2012; Wan and Kao, 2009). Second, for liquidity dealers where the optimal trading timing in the minor market is lower than that in the major market, the mean saving in the minor market is higher than that in the major market. Third, the major market (TFE) contributes more information in the transaction price, suggesting that TFE dealers react more quickly than CFE dealers to information coming from some sources, especially during the market opening and closing intervals. This finding is contrary to the findings of Kao and Wang (2012) and Wan and Kao (2009). Fourth, this paper finds that the minor market, with a lower bid price, turns out to be the dominant market for the bid price and contributes more information for liquidity providers. Finally, TFE has a significant lead-lag relation to CFE for liquidity.
The rest of the paper is organized as follows. The next section describes the detailed data as well as the rule of least cost dealing and methodology. The third section discusses the major empirical findings. Finally, the last section provides a summary and conclusions for the results.
2. Data and methodology
2.1 Data and primarily analysis
The data employed herein, sample at a 5-minute frequency, are comprised of the NTD/USD price series in TFE and CFE displayed over a three-month period from August 19 to November 18, 2014, including transaction price, ask price,
and bid price.4 Through the results of time aggregation, the longer time interval will yield a less likely scenario of determining the sequence of information arrival and the correlation of innovations, but using too short of a time interval will create a problem for many periods where trades do not occur (Chordia et al., 2008). Moreover, Sapp (2002) studied price discovery in DM/US dealer quotes and found little difference in information share values using 30-second or 5-minute sampling frequency. The two FX markets in Taiwan are not active markets with lower trading frequencies. Thus, we work with the price changes at a 5-minute frequency, as this seems like a good compromise.
The trading hours in the two markets are from 9:00 to 16:00 local time, with a two-hour lunch break from 12:00 to 14:00. We compiled the data from TAIFX (Index code TFE) and COSMOS (Index code CFE) from Reuter’s data center, for a total of 3,840 observations in each of the price series. Table 1 presents descriptive statistics for the price series of the two markets. We also compare the average prices across the two markets via the equality test. The distributional properties of the two market prices are quite similar; the differences between the means of each pair price are insignificant and cannot reject the equality test. Furthermore, the average spread of CFE (0.007) is greater than that of TFE (0.006), implying that TFE’s liquidity is more than CFE’s. The result of the equality test shows that the differences between the means of the spreads in the two markets are significant.
The differences in the trading systems and participants of the two markets likely result in price discrepancies (Wan and Kao, 2009; Kao and Wan, 2012), which is particularly relevant due to intervention by the Central Bank.5 We check whether the price and spread discrepancy change during trading days, by dividing the trading hours into 60 intervals at a 5-minute frequency, excluding the 2-hour lunch break. The 60 intervals include: 1) interval 1, 9:00 to 9:05, representing the market opening; 2) interval 36, 11:55-12:00, signifying the
4
The data sample period is limited to data availability. The announced NTD/USD historical trading data on Reuter’s screens are at a 15-minute frequency. It is quite challenging to accumulate shorter frequency data through manual labor from the data center, because the high frequency data are available online over the past few days. Access to the intraday data of CFE in Reuters was suspended after November 26, 2014.
5
The CFE trading system uses Interactive voice response systems. The TFE trading system is mainly traded via phone through screen display transaction information.
Table 1
Descriptive statistics for the prices and spread
The transaction prices, ask prices, bid prices, and spreads of Taipei Foreign Exchange Co. (TFE) and Cosmos Foreign Exchange International Co. (CFE) are from Reuter’s data center from August 19, 2014 to November 18, 2014, sampled at 5-minute intervals, for a total of 3,840 observations in each price series.
Panel A: Summary of statistics
TFE CFE
Transaction Ask Bid Spread Transaction Ask Bid Spread
Mean 30.282 30.282 30.276 0.006 30.28 30.281 30.275 0.007 Median 30.381 30.382 30.378 0.004 30.38 30.382 30.377 0.004 Maximum 30.775 30.775 30.77 0.158 30.78 30.772 30.716 0.147 Minimum 29.852 29.86 29.85 0.001 29.855 29.86 29.852 0.001 Std. Dev. 0.242 0.242 0.242 0.009 0.243 0.242 0.241 0.009 Skewness -0.253 -0.255 -0.263 6.985 -0.254 -0.263 -0.268 6.423 Kurtosis 1.816 1.814 1.809 70.166 1.822 1.806 1.802 59.415 Jarque-Bera 265 266 271 753039 263 272 275 535759 Prob. 0 0 0 0 0 0 0 0 Panel B: Test for equality of means between series
t-statistic P-value
Transaction price 0.189 0.849
Ask price 0.111 0.911
Bid price 0.220 0.825
Spread -2.675 0.007
closing of the morning session; 3) interval 37, 14:00-14:05, demonstrating the market opening in the afternoon session; 4) interval 60, characterizing the market closing at 16:00.
Panel A of Figure 1 plots the transaction price and the spread discrepancies between TFE and CFE. As seen, the two price discrepancies have different intraday patterns. Furthermore, we investigate how intervention affects the price discrepancy between the two markets. We compare the differences of average price discrepancy between the two subsamples, splitting the full sample into the intervening days reported by the press and the non-intervening days.6
6
The number of intervention days reported by the press is sixteen during the sample period. The related news on the Central Bank of Taiwan intervening in the exchange rate of NTD/USD to aid exports came from the udndata.com data center.
Panel A: Average Price Discrepancies of TFE and CFE
Panel B: Difference of Average Price Discrepancies between Subsamples
Figure 1
Price discrepancies between markets and the differences between subsamples
The figure depicts the average price discrepancies between Taipei Foreign Exchange Co. (TFE) and Cosmos Foreign Exchange International Co. (CFE) from August 19, 2014 to November 18, 2014, with a total of 3,840 observations sampled at a 5-minute frequency. The 60 intervals include: 1) Interval 1, 9:00 to 9:05, representing the market opening; 2) Interval 36, 11:55-12:00, the closing of the morning session; 3) Interval 37, 14:00-14:05, the market opening in the afternoon session; 4) Interval 60, representing the market closing at 16:00. The average discrepancy, in Panel A, equals the average price of TFE minus that of CFE in the full sample. The difference of average discrepancy, in Panel B, is the difference between the two subsamples, for the intervening days and the non-intervening days.
Panel B of Figure 1 depicts the differences of the average price discrepancies of transaction price and spread between the two subsamples. The initial 15-minute interval (09:00-9:15) might be attributed to the impact of market opening effects whereby dealers gather market news released overnight and adjust their market sentiment in the early morning. On the other hand, it is worth noting that the differences of average discrepancies of transaction price and spread simultaneously crop up around 15:30. The differences for the average discrepancy of transaction prices calm down at the end of trading day, but the difference of average spread discrepancy does not. The results might be attributed to the various intervening strategies taken by the Central Bank in the two markets.7
A large proportion of foreign exchange trading is in general day trading, in which dealers typically close their inventory positions within a few minutes and generally maintain inventories close to zero at the end of the day (King, Osler, and Rime, 2013). Hence, the average M-shaped intraday pattern might be attributed to the interactions between the Central Bank of Taiwan and market participants before the end of the trading day.8 The M-shaped patterns imply that the Central Bank steps into TFE alone at 15:30 local time, while intending to simultaneously perform interventions in CFE and TFE at the end of the trading day.9 Why does the Central Bank of Taiwan need to intervene in both markets at the final trading interval? A plausible factor is to minimize evidence of artificial intervention that the currency has significantly different closing prices in the
7
After comparing the two trading interval data of both markets in the intervening days, the average price changes of transaction price, ask price, and bid price of TFE (CFE) are 0.106, 0.106, 0.108 (0.098, 0.098, 0), respectively. The results imply that at the final trading interval the Central Bank tends to simultaneously manipulate the ask price and the bid price in TFE, but only manipulates the ask price in CFE.
8
For example, if the Central Bank singularly steps into TFE and devalues the local currency (NTD) around 15:30, then the information is disseminated to both markets. The dealers will revise their prices for profit taking (Peiers, 1997). Under liquidity pressure before the end of the trading day, the dealers would submit “aggressive limit ask orders” in TFE at the level where counterparties would willingly purchase their aggregate inventory, during the time period when the ask price of TFE is far larger than that of CFE.
9
In practice, simultaneous intervention in separate markets to attain the desired effects is costly. Thus, the Central Bank initiates intervention in TFE alone at 15:30 local time to mitigate the costs. Moreover, intervening in both markets at the final trading interval could reach the desired closing price at a lower cost.
dual-trading markets, as asserted by previous studies and the U.S. Treasury Department.
The findings are contrary to those reported by Chang (2007) and Wan and Kao (2009) in that larger discrepancies of transaction price and spread between the two markets might be attributed to the intervention of the Central Bank of Taiwan in TFE alone. If the time-of-day pattern in returns is caused by regular patterns in order flow, then the intraday pattern gives evidence for liquidity effects (Breedon and Ranaldo, 2013). The results indicate the importance of using intraday high-frequency data for detecting price discovery in the financial markets (Chang, 2013), especially in the FX market.
2.2 Least cost dealing
Interbank dealers typically are free to trade their NTD/USD positions via submitting market (limit) orders into the two brokered markets to take (provide) liquidity. A dealer’s objective in what is often referred to as least cost dealing is to find the best price (Kaul and Mehrotra, 2007). For liquidity providers, they submit limit orders at their desired prices in the two brokered markets, depending on their private information. In particular, liquidity providers can extract more valuable information just based on the results of CFE leading TFE in the bid price and the lower bid price quoted in CFE.10
We follow Kaul and Mehrotra (2007) to examine the extent to which a dealer, as a liquidity taker, could obtain better terms by submitting market buy or market sell orders in the different markets. Assuming that the best limit ask price on CFE is lower than the TFE price, the saving from submitting the market buy order to CFE is:
∆𝐶𝐶𝐶𝐶𝐶𝐶𝑡𝑡= ln (𝑇𝑇𝑇𝑇𝑇𝑇𝑎𝑎𝑎𝑎𝑎𝑎,𝑡𝑡/𝐶𝐶𝑇𝑇𝑇𝑇𝑎𝑎𝑎𝑎𝑎𝑎,𝑡𝑡) ∗ 100, (1)
where TFEask and CFEask are the respective best ask prices on TFE and on CFE at time t. Each of these prices is measured at the end of 5-minute intervals throughout the trading day.
Assuming that the best limit bid price on CFE is lower than TFE price, the saving from submitting the market sell order to TFE is:
10
We are thankful to an anonymous referee for the suggestion.
∆𝑇𝑇𝐶𝐶𝑇𝑇𝑡𝑡= ln (𝑇𝑇𝑇𝑇𝑇𝑇𝑏𝑏𝑏𝑏𝑑𝑑,𝑡𝑡/𝐶𝐶𝑇𝑇𝑇𝑇𝑏𝑏𝑏𝑏𝑑𝑑,𝑡𝑡) ∗ 100. (2) Table 2 provides statistics summarizing the distribution of return on different order submitting strategies. It is optimal for liquidity takers to submit market buy (sell) orders to CFE in 27% (20%) of all 5-minute intervals. Alternatively, it is optimal for the dealers to submit market buy (sell) orders to the TFE market approximately 36% (40%) of the time. When the CFE terms favor the dealer, the mean saving on the market buy (sell) order is about 1.9% (1.2%). In contrast, when the TFE terms favor the dealer, the mean saving on the market buy (sell) order is about 0.9% (0.5%). As we can see, the optimal trading timing in CFE is lower than that in TFE, but the mean saving on trading in CFE is greater than that of TFE. These results reveal opportunities for interbank dealers to save money by executing trades in one of the two brokered markets, depending on the market conditions.
Table 2
Least cost dealing returns
Least Cost Dealing (LCD) returns in the table are based on the differences between the market buy or sell orders in Cosmos Foreign Exchange International Co. (CFE) and in Taipei Foreign Exchange Co. (TFE). For instance, the LCD savings for a dealer submitting a market buy order into CFE as compared to that into TFE is Log (TFEask price/CFEask price), Here, TFEask is the best
ask price in TFE, and vice versa. LCD uses prices measured at the end of 5-minute intervals in the trading day. The table reports 95th and 90th percentile returns, and a fraction of observations has positive returns. The last row reports the mean, conditional on positive returns being earned.
LCD Market buy in CFE Market sell in CFE Market buy in TFE Market sell in TFE Average 0.002 -0.004 -0.002 0.004 Max. 0.473 0.049 0.173 0.463 Min. -0.173 -0.463 -0.473 -0.049 Percentile: 95% 0.020 0.007 0.016 0.016 90% 0.007 0.003 0.010 0.010 Fraction>0 27.47% 20.65% 36.71% 40.91% Mean| R>0 0.019 0.012 0.009 0.005
2.3 Methodology
This paper explores which of the two markets primarily leads the foreign exchange rate. Theoretically, the two markets simultaneously trade the same currency and absorb the same shocks, so that for arbitrage activities one should keep observing discrepancies between the two markets within a certain range at least in the long run. Before performing cointegration analysis, the Augmented Dickey-Fuller (ADF) and the Phillips-Perron (PP) tests are used to test for non-stationarity in each of the price series.
If the price series of the two markets are stationary, then we utilize the simple vector autoregression estimation (VAR) to explore the lead-lag relationship. Let Yt = (y1t, y2t) denote a (2×1) vector of time series variables. The basic p-lag vector autoregressive (VAR (p)) model has the form:
𝑌𝑌𝑡𝑡 = 𝑐𝑐 + П1𝑌𝑌𝑡𝑡−1+ П2𝑌𝑌𝑡𝑡−2+ ⋯ + П𝑝𝑝𝑌𝑌𝑡𝑡−𝑝𝑝 + ε𝑡𝑡, 𝑡𝑡 = 1, 2. . , 𝑇𝑇 (3)
where Πi are (2×2) coefficient matrices, and εt is a (2×1) unobservable zero mean white noise vector process (serially uncorrelated or independent) with time invariant covariance matrix Σ ; c denotes vector constant terms.
If the price series of the two brokered markets are not stationary, and the result indicates that the price series are integrated of order k, I(k), then the vector error correction model (VECM) will be a more appropriate specification in terms of smaller long-term forecast errors when the variables satisfy the cointegration condition (Brailsford, Penm, and Terrell, 2006). To determine the price interaction between the two brokered markets, we use a two-step procedure. In the first step of the analysis, the identification of the cointegration between the two prices is based on an unrestricted vector autoregressive (VAR) model, based on Johansen’s technique (1995).11 In the second step, we use VECM to simultaneously describe both the short-term dynamic and the long-term equilibrium.12
11
There are two popular cointegration test methodologies: the Engle and Granger Test and the Johansen Test. The latter is typically preferred for multivariate tests.
12
This VECM allows one not only to estimate how the variables adjust deviations towards the long-run equilibrium, but also to test for Granger-causality as well as to determine the impact of shocks to the variables using an impulse response function.
Considering the two parallel price series, the prices of TFE and CFEare first-order stationary. Therefore, by the Granger Representation Theorem for cointegrated variables, ΔTFE and ΔCFE can be estimated as a vector error correction model (VECM) as follows:
(4)
(5) where, α1 and α2 denote constant terms; ε1t and ε2t are i.i.d. shocks; 𝑍𝑍𝑡𝑡−1 =
𝑇𝑇𝑇𝑇𝑇𝑇𝑡𝑡−1− 𝛾𝛾 ∗ 𝐶𝐶𝑇𝑇𝑇𝑇𝑡𝑡−1 and is the error correction term, describing the long-run
equilibrium of the system; the coefficients of the error correction term, β1 and β2, measure the single-period response of the dependent variable to departure and indicate how the system responds to deviations from the long-run equilibrium. If the price on TFE is higher than the price of CFE, then we would expect a negative price change on TFE, and vice versa. The two dummy variables, OP (09:00-09:15) and CL (15:30-16:00), are used to capture the foreign exchange markets’ intraday pattern effects, during the market opening and the near the closing trading intervals. The short-run dynamics are captured through the individual coefficients of the lag difference terms.
In this setting, if the prices of the two markets respond to the efficient price to the same degree, then they form a cointegrating vector (1, −1, C), where C denotes a constant term representing institutional factors such as the difference in transaction costs (Baba and Inada, 2009). Based on the VECM model, there are two approaches that have attracted academic attention for investigating the mechanism of price discovery: (i) information shares (IS, Hasbrouck, 1995) and (ii) common factor component weights (CS, Gonzalo and Granger, 1995). De Jong (2002) found that the two measures are closely related and suggested that the major difference between the two approaches is the role in the variance of the innovations. Moreover, Lehmann (2002) offered that IS correctly measures price discovery when price change innovations are uncorrelated, while CS generically do well when price change innovations have the same variance. The CS weights are applied to the current prices, while the IS weights are applied to
the current price innovations (Hasbrouck, 2002).
We note that IS is concerned with the amount of variation in the prices, and how much of that is explained by the price changes on market i. The variances of the right-hand side in Equations 4 and 5 might vary in size, because of the difference in variances of the shock terms. We follow Baba and Inada (2009) to estimate Hasbrouck’s information share measure as follows:
𝐼𝐼𝑇𝑇𝑙𝑙𝑙𝑙𝑙𝑙𝑙𝑙𝑙𝑙 = 𝛽𝛽22(𝜎𝜎12−(𝜎𝜎12 2 𝜎𝜎22 )) 𝛽𝛽22𝜎𝜎 12−2𝛽𝛽1𝛽𝛽2𝜎𝜎12+𝛽𝛽12𝜎𝜎22, 𝐼𝐼𝑇𝑇𝑢𝑢𝑝𝑝𝑝𝑝𝑙𝑙𝑙𝑙 = (𝛽𝛽2𝜎𝜎1−𝛽𝛽1(𝜎𝜎12𝜎𝜎1 ))2 𝛽𝛽22𝜎𝜎 12−2𝛽𝛽1𝛽𝛽2𝜎𝜎12+𝛽𝛽12𝜎𝜎22 , (6) where 𝜎𝜎12, 𝜎𝜎22, and 𝜎𝜎12 are factors in the covariance matrix of ε1t and ε2t . If this Hasbrouck measure is larger than 0.5, then TFE has a more dominant role in price discovery than does CFE. Hasbrouck’s method leads to upper and lower IS bounds instead of a unique measure. Hence, several researchers have been devoted to modifying the IS model to provide incremental information about market information shares (Lien and Shrestha, 2009; 2014). Alternatively, the average of the upper and lower bounds could provide a sensible estimate of price discovery when data frequency is high (Baba and Inada, 2009; Baillie et al., 2002; Tse et al., 2006).
Harris, McInish and Wood (2002) suggested, on the other hand, that the Gonzalo-Granger common factor components (CS) provide a way to detect and calibrate these informed trades that permanently move the markets and offer a direct test of inter-market price adjustment. It is useful that the coefficients βi tell how much weight to attach to the innovation in the price from market i when constructing the innovation in the efficient price (De Jong, 2002). Thus, the contribution of price discovery could depend on the relative absolute value of the coefficients of the error correction term (Baba and Inada, 2009; Delatte et al., 2012; Lok and Kalev, 2006), |𝛽𝛽1| and |β2|. The dominant market in the price discovery process has lower adjustment speed than that of the satellite market. Moreover, an alternative method to identify the dominant-satellite relationship is the Gonzalo-Granger measure (GG measure), which is calculated as follows (Baba and Inada, 2009; Delatte et al., 2012):
Based on equation 7, if the GG measure is higher than 0.5, then TFE is the dominant market; otherwise, it is not.
3. Empirical results
3.1 Unit root test
In order to check against obtaining spurious results from running regression tests using non-stationary data, ADF and PP tests are used to test for unit roots and stationarity. The lag length is selected based on the AIC criteria in the three price series and on the SC criteria in the spread series. The results in Table 3 indicate that the price series of the two markets are not stationary, but are integrated of order one, which is a prerequisite for using the Johansen-type tests for cointegration. However, the spread series of the two markets are stationary on the level and first difference.
3.2 Cointegration test and VECM modeling
In the analysis of cointegration, we follow Johansen’s technique (1995). The appropriate lag length for VAR was chosen according to the Hannan-Quinn criteria (HQC), the Akaike Information Criterion (AIC), and the Schwarz information criterion (SCI), which is parsimonious. The lag lengths of the transaction price, ask price, and bid price are six, seven, and one, respectively. Overall, in the cointegration specifications, AIC suggests a VAR of order one (with intercept and no trend), and the Max-eigenvalue test indicates one cointegrating equation at the 5% level in each pair price series.
According to the results of the cointegration test, we run separate VECM models as in Equations 4 and 5. Model 1 focuses on the price dynamic in the entire trading day, omitting the two dummy variables. Model 2 aims to explore the role of price discovery after controlling for the liquidity effect of the intraday pattern.
Table 4 shows the estimates of the cointegrating relationship of the transaction price, ask price, and bid price, respectively. The results in Panel A of Table 4 represent the estimates of the unrestricted cointegrating vectors of the transaction price, ask price, and bid price, indicating significance at the 1% level.
Table 3
Unit root and stationarity tests
This table reports the unit root and stationarity tests for the transaction price ask and bid prices of Taipei Foreign Exchange Co. (TFE) and Cosmos Foreign Exchange International Co. (CFE), respectively. Both the Augmented Dickey-Fuller (ADF) and the Phillips-Perron (PP) tests include an intercept. The critical value of the ADF test and the Phillips-Perron (PP) test is -2.86 at the 5% level. The maximum lags are selected by the Akaike Information Criterion in the three prices and by the Schwarz information Criterion in spread. ***, **, and * indicate statistical significance at the 1%, 5%, and 10% levels, respectively.
Variable Test Level First difference
Test statistic Test statistic
Panel A: Transaction price
ADF TFE 0.010 -23.036 *** CFE -0.101 -25.865 *** PP TFE -0.012 -123.348 *** CFE 0.168 -78.791 ***
Panel B: Ask price
ADF TFE 0.051 -22.781 *** CFE 0.035 -30.887 *** PP TFE 0.099 -115.185 *** CFE 0.193 -78.881 ***
Panel C: Bid price
ADF TFE 0.104 -38.291 *** CFE -0.200 -62.387 *** PP TFE 0.205 -104.933 *** TFE -0.184 -62.387 *** Panel D: Spread ADF TFE -20.937 *** -18.145 *** CFE -27.158 *** -18.611 *** PP TFE -42.139 *** -438.133 *** TFE -32.037 *** -32.984 ***
Table 4
Estimates of the cointegrating vectors
This table presents the estimation of the cointegrating vectors, with and without restricctions, for the transaction prices, ask prices, and bid prices of Taipei Foreign Exchange Co. (TFE) and Cosmos Foreign Exchange International Co. (CFE), respectively. The t-statistics are in parentheses. ***, **, and * indicate statistical significance at the 1%, 5%, and 10% levels, respectively. The restriction test on the cointegrating vector is conducted by the LR (Likelihood Ratio) test.
Variables Model 1 Model 2
Panel A: Cointegration restrictions
Transaction price (1, -0.998, -0.040) *** (1, -0.998,0.044) *** Ask price (1, -1.004, -0.044) *** (1, -1.001,0.045) *** Bid price (1, -1.001, 0.023) *** (1, -1.001, 0.023) ***
Panel B: Cointegration restrictions: B(1,1)=1, B(1,2)=-1
Transaction price (1,-1,-0.001) (1,-1,-0.001)
Ask price (1,-1,-0.001) * (1,-1,-0.001) ***
Bid price (1,-1,-0.001) (1,-1,-0.001) *
The estimates of the restricted integrating vectors are then presented in Panel B of Table 4. Both models of transaction price indicate that accepting the hypothesis of the Law of One Price (LOP) has an integrating vector with coefficient (1, -1), by the LR (Likelihood Ratio) test. On the other hand, the estimated cointegrating vectors for the ask prices of both models are found to be some extent different from the theoretically suggested vector by the LR test at the 10% and the 1% levels, respectively. Finally, the estimated cointegrating vectors for bid prices indicate that they do not reject the hypothesis of LOP for model 1 and weakly reject the hypothesis of LOP at the 10% level for model 2, by the LR test.
Table 5 presents the results of the estimates of the restricted VECM model for the transaction prices, ask prices, and bid prices, respectively. First, Column 2 of Panel A shows the estimation based on the restricted VECM model for transaction price as in Equations 4 and 5, but omitting the intraday liquidity variables. The first row presents that the coefficients of error correction term (Zt-1) of both models on TFE and CFE are also statistically significant at the 1% level. This indicates that both markets respond to a deviation from the equilibrium
Table 5
Estimation results of contribution to price discovery
The table presents the results of the estimates of the VECM model, Information Share, and Common Factor Measure for the transaction, ask, and bid prices of Taipei Foreign Exchange Co. (TFE) and Cosmos Foreign Exchange International Co. (CFE). Zt-1 denotes the coefficients of
error correct terms on TFE/CFE, respectively. The Information Share (IS) and GG measure (GG) help identify the dominant-satellite relationship, depending on the value > 0.5. Here, a, b, and c indicate statistical significance at the 1%, 5%, and 10% levels, respectively. The two dummy variables, OP (09:00-09:15) and CL (15:30-16:00), are used to capture the foreign exchange markets’ intraday pattern effects, during the market opening and closing trading intervals.
Panel A: Contribution to price discovery
Transaction price Ask price Bid price Model 1 Model 2 Model 1 Model 2 Model 1 Model 2
Zt-1 -0.09a/0.58a -0.23a/0.58a -0.31a/0.35a -0.53a/0.45a -0.81a/0.16a -0.77a/0.17a
IS-lower 0.72 0.58 0.26 0.2 0.04 0.05
IS-upper 0.98 0.93 0.86 0.81 0.54 0.58
IS-mean. 0.85 0.76 0.56 0.5 0.29 0.31
GG 0.87 0.72 0.53 0.46 0.16 0.18
Panel B: Intraday pattern effects on TFE/CFE
Variable Transaction price Ask price Bid price
OP -0.012a/-0.004a -0.010a/-0.010a -0.001/-0.001
CL 0.009a/0.001b 0.011a/0.002a 0.005a/-0.000
prices and contribute to the price discovery process. An important finding is that the mean-reverting coefficient of Zt-1 for TFE has a negative sign and that for
CFE has a positive sign. This implies that if the transaction price discrepancies are above their equilibrium level, then the price of the TFE market will be lower and that of the CFE market will be higher.
A comparison of the absolute values of the coefficients of Zt-1 shows that the CFE market (0.58) is larger than the TFE market (0.09). The results imply that the CFE market reacts to a greater extent to a price differential between the two markets. In general, the satellite market has the larger error-correction when it has a partial contribution to price discovery (Lok and Kalev, 2006). On the other hand, the average ratio of Information Shares (IS) in model 1 is 0.85, and in the Gonzalo-Granger measure (GG measure) it equals 0.87. The results further confirm the dominant-satellite relationship.
We next run the second VECM model as in Equations 4 and 5 for transaction price, after controlling the intraday pattern (liquidity) effect. As expected, a comparison of the absolute values of the coefficients of Zt-1 shows
that the CFE market (0.58) is still larger than the TFE market (0.23). The results further confirm that the CFE market reacts to a greater extent to a price differential between the two markets, after controlling the intraday pattern. The average ratio of Information Shares (IS) in model 2 is 0.76, and the GG measure equals 0.72. These results lead to the conclusion that CFE is the satellite market and TFE is the dominant market for transaction prices, even after controlling the intraday pattern effects.
Comparing the difference between both models, the levels of IS and GG measured in model 2 are lower than those in model 1. The results imply that TFE plays a more dominant role in price discovery not only during the market opening interval, but also during the market closing period. This finding is in contrast to the findings by Kao and Wan (2012) and Wan and Kao (2009), who contended that CFE contributes more information to price discovery, using daily frequency data. However, it is in line with prior reports that the dominant market is generally the one that has more liquidity and trading volume (Aslanidis and Kouretas, 2005; Hasbrouck, 1995; Lok and Kalev, 2006; Piccotti and Schreiber, 2015; Tse et al., 2006).
For exploring information asymmetry, we extend to examine the VECM model for ask and bid prices, respectively. Columns 4 and 5 of Table 5 also present the coefficients of Zt-1, the GG measure, and the Hasbrouck measure of price discovery for the ask price in models 1 and 2, respectively. For model 1, the coefficients of Zt-1 of TFE and CFE are respectively -0.31 and 0.35, the average ratio of Information Shares (IS) is 0.56, and the GG measure equals 0.53. These results imply that TFE contributes more information than CFE in the price discovery of the ask price. After controlling the liquidity effect, the averages of IS and the GG measure in model 2 are 0.5 and 0.46, respectively. Comparing the results of both models, this indicates that the dominant-satellite relationship is competing and ambiguous. At the same time, TFE has more information for the ask price during the market opening and the closing periods.
Columns 6 and 7 of Table 5 finally present the coefficients of Zt-1, the GG measure, and the IS measure of price discovery for the bid prices in both models.
For model 1, the coefficients of Zt-1 of TFE and CFE are respectively -0.81 and 0.16. The average ratio of Information Shares (IS) is 0.29, and the GG measure equals 0.16, implying that CFE contributes more information than TFE in price discovery. After controlling for the liquidity effect, the averages of IS and the GG measure in model 2 are 0.31 and 0.18, respectively. It is worth noting that the mean of the best bid prices of CFE is lower than that of TFE. According to the rule of least trading cost, dealers might submit passive limit bid orders into TFE or conceal their aggressive limit orders in TFE when the best bid prices of CFE are lower than those of TFE. Thus, it is reasonable that CFE turns out to be the dominating market for the bid price in the long run.
Panel B of Table 5 shows the coefficients of intraday pattern proxies on TFE and CFE for each price series and each model. As shown in panel B, for the transaction price and ask price series, all the coefficients of the dummy variable (OP), which proxies for the market opening trading interval, are negative and significant, whereas those coefficients of the dummy variable (CL), which proxies for the market closing trading interval, are positive and significant. For the bid price, it is interesting that only the coefficient of the dummy variable, which proxies for market closing trading intervals, is positive and significant on TFE. Moreover, it is worth noting that the absolute levels of coefficients of TFE are larger than those of CFE in all three price series. These results support that the Central Bank actually intervenes and devalues the NTD/USD in the TFE market during the final trading hour (Wan and Kao, 2009; Chang, 2007). It also shows that interbank dealers learn that the market is sensitive, gather market news released overnight, and adjust their market sentiment in the early morning.
The VECM Granger causality tests indicate that causality is bidirectional between TFE and CFE for transaction price and ask price series, respectively. The results show strong evidence of lead-lag interactions between the two markets in the short run. In contrast, the causality is unidirectional for bid price series. The effects of the bid price in TFE on that of CFE are significant at the 0.01 level, whereas the effects of CFE on TFE are not significant. The results mean that the movements of the bid price in TFE appear to lead those of CFE, and that the information is incorporated more quickly in TFE than in CFE in the short run.
3.3 Impulse response function
More detailed insights on the causal relationship between the two markets can be obtained by analyzing their impulse response functions (IRF). IRF standardize the dynamic response of the variable to an exogenous shock, assuming the price of the two markets is in a long-term equilibrium. We use the Generalized Impulses Response Function (GIRF) as described by Pesaran and Shin (1998), and this approach does not require orthogonalization of shocks and is invariant to the ordering of the variables in VECM.
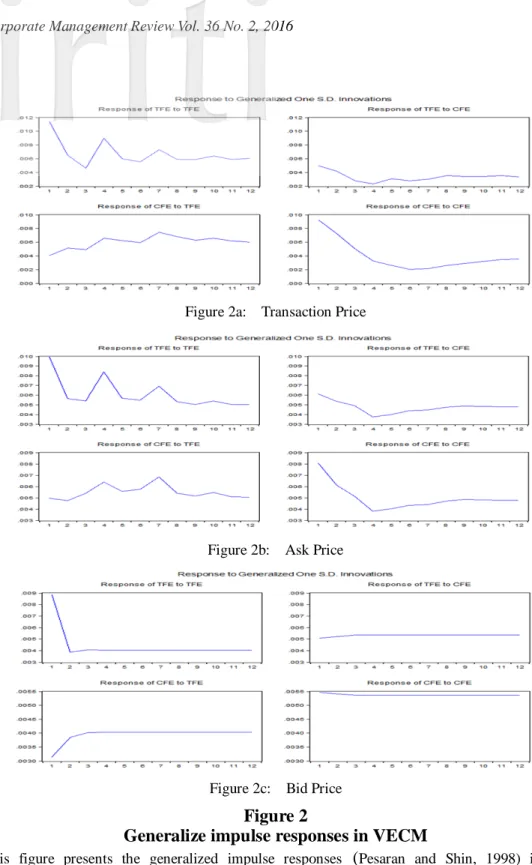
Figure 2 shows the generalized impulse responses to one SE (standard error) shock of each market to the other market for each price series in the unrestricted VECM model as model 1, respectively. As shown in Figure 2a, a positive shock of the TFE transaction price causes a gradual increase in CFE and reaches a peak at 0.7% in the 7th interval, while for the remaining times there is a persistent effect. Conversely, the responses of TFE to the CFE shock show a different pattern. Its impact response is 0.5%, decreasing to 0.2% at the 4th interval and keeping a slight effect thereafter. It is worth noting that Figure 2b shows the ask price responses of TFE and CFE, which exhibit similar patterns to the transaction price. Finally, Figure 2c and the bid price, the initial response of TFE to a shock to CFE is equivalent to 0.5% and thereafter maintains a stable persistent effect. In contrast, the response of CFE to a shock to TFE is 0.3% and then moves upward to 0.4% at the 3th interval and is persistent.
Comparing the responses of TFE and CFE to shocks of each other for the transaction price and the ask price, the results confirm that the shocks to TFE have lasting effects on CFE, which are greater than a corresponding shock to CFE on TFE. Alternatively, comparing the responses of TFE and CFE to shocks of each other for the bid price, the response of TFE to a shock to CFE is persistent, but the response of CFE to a shock to TFE is gradually upward.
3.4. Lead-lag relationship for liquidity
In an order-driven market, the bid-ask spread is an effective measure of liquidity seen in the literature. Shastri, Thirumalai, and Zutter (2008) suggested that information revelation in the dominant market decreases with the ratio of spreads.
Figure 2a: Transaction Price
Figure 2b: Ask Price
Figure 2c: Bid Price
Figure 2
Generalize impulse responses in VECM
This figure presents the generalized impulse responses (Pesaran and Shin, 1998) in the transaction price of Taipei Foreign Exchange Company (TFE) and Cosmos Foreign Exchange International Company (CFE), and the responses for the ask price and bid price, respectively. We test for a time horizon of one hour (5-mins/interval).
While both of the spread time series of TFE and CFE are stationary on level and first differences, we further examine whether there is a lead-lag relationship for spreads between the two market using the vector autoregression estimation (VAR) as in equation 3. The appropriate lag length for VAR was chosen according to the Hannan-Quinn criteria (HQC), Akaike Information Criterion (AIC), and Schwarz information criterion (SCI), which is parsimonious. Here, SCI and HQC indicate that 7 lags are appropriate.
The VAR Granger causality tests first indicate the effects of the spread of TFE on that of CFE. The effects of CFE on TFE are significant at the 0.01 level, implying that causality is bidirectional between TFE and CFE for bid-ask
Figure 3
Generalize impulse responses in VAR: Spread
This figure presents the generalized impulse responses (Pesaran and Shin, 1998) in the spread of Taipei Foreign Exchange Company (TFE) and Cosmos Foreign Exchange International Company (CFE). We test for a time horizon of 60 minutes (5-mins/interval). TS denotes the spread of TFE, and CS denotes the spread of CFE.
-.002 .000 .002 .004 .006 .008 .010 1 2 3 4 5 6 7 8 9 10 11 12 Res pons e of TS to TS -.002 .000 .002 .004 .006 .008 .010 1 2 3 4 5 6 7 8 9 10 11 12 Res pons e of TS to CS -.002 .000 .002 .004 .006 .008 1 2 3 4 5 6 7 8 9 10 11 12 Res pons e of CS to TS -.002 .000 .002 .004 .006 .008 1 2 3 4 5 6 7 8 9 10 11 12 Res pons e of CS to CS
spreads. Furthermore, Figure 3 shows the generalized impulse responses to one SE (standard error) shock of one market to the other market for the spread in the VAR model. As shown in Figure 3, a positive shock of the TFE spread causes a gradual increase in CFE and reaches a peak at 0.4% in the 4th interval and then decreases to zero around the 10th interval. However, a shock of the CFE spread causes a mute effect on that of TFE, being near zero and negative. The results imply that the more liquid market (TFE) leads the less liquid market (CFE).
3.5 Robustness tests
To test the robustness of our empirical results to the sampling frequency, we retest the unit root and the cointegration tests at the 15-, 30-, and 60-minute frequencies, respectively. The results also show the existence of the cointegration between TFE and CFE for transaction price, ask price, and bid price, respectively. Table 6 reports the empirical results of restricted VECM modeling in both models for each price series. In general, the dominant-satellite relationships at the 15-min and the 30-min sampling frequencies remain similar to the results sampled at a 5-minute frequency, but are gradually decreasing. It is worth noting that the coefficients of error correction terms for all three price series are insignificant, and that the dominant-satellite relationships become ambiguous at the 60-min sampling frequency.
As can be seen in Panel B of Table 6, most of the coefficients of the two dummy variables are significant for the transaction price and ask price series. Furthermore, only TFE makes a positive and significant adjustment during the market closing intervals for the bid price. This further offers another issue relative to the effectiveness of the Central Bank of Taiwan, which regularly intervenes in TFE during the final trading hour. The robust tests indicate that intraday high-frequency data are essential for detecting price discovery in the FX market, especially for the new governing regulation on foreign exchange brokers amended July 29, 2011.13
13
It might result in a transaction price discrepancy between the two markets in Taiwan sharply narrowing at the final trading intervals, when the Central Bank concurrently intervenes in both markets at the end of the trading day.
Table 6
Robust VECM estimation results for different sampling frequency
The table presents the results of the estimates of the VECM model, Information Share, and Common Factor Measure for the transaction, ask, and bid prices of Taipei Foreign Exchange Co. (TFE) and Cosmos Foreign Exchange International Co. (CFE) at 15-, 30-, and 60- mins sampling frequencies, respectively. Here, Zt-1 denotes the coefficients of error correction terms on
TFE/CFE, respectively. The Information Share (IS) and GG measure (GG) identify the dominant-satellite relationship, depending on a value > 0.5.The two dummy variables, OP (9:15, 9:30, and 10:00) and CL (15:30-16:00, 15:30-16:00, and 15:00-16:00), for the three diferent sampling frequencies are used to capture the foreign exchange markets’ intraday pattern effects. Lastly, a, b, and c indicate statistical significance at the 1%, 5%, and 10% levels, respectively. Panel A: Contribution to price discovery
Transaction price Ask price Bid price
Model 1 Model 2 Model 1 Model 2 Model 1 Model 2
15-min: Zt-1 -0.26a/0.64a -0.39a/0.71a -0.42a/0.67a -0.53a/0.45a -0.88a/0.18a -0.77a/0.17a IS-lower 0.43 0.36 0.26 0.15 0.05 0.05 IS-upper 0.94 0.9 0.86 0.83 0.56 0.61 IS-mean 0.69 0.63 0.56 0.49 0.3 0.33 GG 0.71 0.65 0.61 0.46 0.17 0.18 30-min: Zt-1 -0.71a/0.37a -0.75a/0.35a -0.76a/0.35a -0.81a/0.39a -0.93a/0.18a -0.87a/0.11a IS-lower 0.06 0.06 0.04 0.04 0.04 0.02 IS-upper 0.86 0.86 0.87 0.86 0.57 0.56 IS-mean 0.46 0.46 0.46 0.45 0.31 0.29 GG 0.34 0.32 0.32 0.33 0.16 0.11 60-min: Zt-1 -0.58/0.58 -0.38/0.79 -1.17/0.02 -0.67/0.52 -0.36/0.07 -0.35/0.06 IS-lower 0 0.01 0 0 0.02 0.01 IS-upper 100 0.99 0.98 .0.99 0.73 0.74 IS-mean 0.5 0.5 0.49 0.5 0.38 0.37 GG 0.5 0.67 0.02 0.44 0.16 0.14
Panel B: Intraday pattern effects on TFE/CFE Variable Transaction price Ask price Bid price
15-min: OP -0.024a/-0.018a -0.019a/-0.018a 0.001/-0.001 CL 0.019a/0.001 0.020a/0.003a 0.013a/-0.000 30-min: OP -0.014a/-0.013a -0.014a/-0.014a 0.005/0.006b CL 0.025a/0.010a 0.026a/0.013a 0.020a/-0.000 60-min: OP -0.013b/-0.012b -0.011b/-0.009 0.003/0.004 CL 0.028a/0.028a 0.031a/0.030a 0.012b/-0.004
4. Summary and conclusions
An empirical analysis on price transmission is useful since it has important implications for market participants. In the present paper we have utilized the unique and high frequency FX dataset to provide further insights into the long-term equilibrium and short-run dynamics of the two foreign exchange markets in Taiwan.
First, we examine the extent to which liquidity-demanding dealers could obtain better terms by submitting market bid or market ask orders in the two different markets. The optimal trading timing in TFE is higher, but the mean saving on trading in CFE is greater. The results reveal opportunities for interbank dealers to save money by transacting in one of the two markets, depending on the market conditions.
Second, we estimate vector error correction models based on transaction price, ask price, and bid price, respectively. For the transaction price and ask price, the major market of TFE is the dominant market, especially during the market opening and closing intervals. This finding is consistent with most previous studies on other financial markets, but contrary to Kao and Wan (2012) and Wan and Kao (2009), who examined daily frequency data in Taiwan’s two FX markets before 2009. A dealer’s objective is often to find the best price via submitting separate market or limit orders into the two markets. Thus, the minor market with a lower best bid price in most cases, CFE, acts as the dominating market and provides more contribution to price discovery for the bid price.
The dominant-satellite relationship between the two foreign exchange markets gradually decreases when the sampling frequency is lower. In particular, the coefficients of error correction terms are insignificant at the 60-minute sampling frequency. This indicates the importance of using intraday frequency in exploring price discovery in a foreign exchange market. Finally, this paper confirms that the major market truly maintains a leading relationship to the minor market in terms of liquidity.
Understanding currency price trends must rely on information transmission and price discovery in the two FX markets. This not only serves dealers as an indicator to actively adjust their order-submitting strategies in response to any
deviation from the equilibrium, but also facilitates future research into the intervention effect of the Central Bank of Taiwan.
References
Aggarwal, R. and Mougouè, M. (1996). Cointegration among Asian currencies: Evidence of the increasing influence of the Japanese Yen. Japan and the
World Economy, 8(3), 291-308.
Aslanidis, N. and Kouretas, G. P. (2005). Testing for two-regime threshold cointegration in the parallel and official markets for foreign currency in Greece. Economic Modelling, 22(4), 665-682.
Baba, N. and Inada, M. (2009). Price discovery of subordinated credit spreads for Japanese Mega-banks: Evidence from bond and credit cefault swap markets. Journal of International Financial Markets, Institutions and Money, 19(4), 616-632.
Baillie, R., Booth, G., Tse, T., and Zabotina, T. (2002). Price discovery and common factor models. Journal of Financial Markets, 5(3), 309-321.
Brailsford, T., Penm, J. H., and Terrell, R. D. (2006). The equivalence of causality detection in VAR and VECM modeling with applications to exchange rates. Multinational Finance Journal, 10(3/4), 153-178.
Breedon, F. and Ranaldo, A. (2013). Intraday patterns in FX returns and order flow. Journal of Money, Credit and Banking, 45 (5), 953-965.
Chan S. J., Hsu, H., Lin, C. C., and Chen, I. C. (2007). Impact of spot trading activity on the futures-spot relationship. Chiao Da Management Review, 27(1), 169-194.
Chang, C. H. (2013). The behavior of commercial paper rates: Data frequencies and great events. Chiao Da Management Review, 33(1), 65-104.
Chang, C. Y., Chen, H. L., and Yang, F. Y. (2015). The effect of herding behavior and the sentiments of investors on Taiwan stock index futures. Chiao Da
Management Review, 35(1), 25-46.
Chang, Y. C. (2007). Liquidity and trading costs in the NTD/USD interbank foreign exchange market: Taipei versus Cosmos Inc. Sun Yat-Sen
Management Review, 15(2), 299-321. In Chinese.
rate volatility. Journal of International Financial Markets, Institutes and
Money, 13(1), 85-112.
Chen, Y. and Gau, Y. (2014). Asymmetric responses of ask and bid quotes to information in the foreign exchange market. Journal of Banking and
Finance, 38, 194-204.
Chordia, T., Roll, R., and Subrahmanyam, A. (2008). Liquidity and market efficiency. Journal of Financial Economics, 87(2), 249-268.
De Jong, F. (2002). Measures of contributions to price discovery: A comparison.
Journal of Financial Markets, 5(3), 323-327.
Demian, C. (2011). Cointegration in central and east European markets in light of EU accession. Journal of International Financial Markets, Institutions
and Money, 21(1), 144-155.
Delatte, A., Gex, M., and López-Villavicencio, A. (2012). Has the CDS market influenced the borrowing cost of European countries during the sovereign crisis? Journal of International Money and Finance, 31(3), 481-497.
Gebka, B. and Serwa, D. (2006). Are financial spillovers stable across regimes? Evidence from the 1997 Asian crisis. Journal of International Financial
Markets, Institutions and Money, 16(4), 301-317.
Giannellis, N. and Papadopoulos, A. P. (2011). What causes exchange rate volatility? Evidence from selected EMU members and candidates for EMU membership countries. Journal of International Money and Finance, 30(1), 39-61.
Gonzalo, J. and Granger, C. (1995). Estimation of common long-memory components in cointegrated systems. Journal of Business and Economic
Statistics, 13 (1), 27-36.
Greb, F., Von Cranon-Taubadel, S., Krivobokov, T., and Munk, A. (2013). Estimation of threshold models in price transmission analysis. American
Journal of Agricultural Economics, 95(4), 900-916.
Harris, F. H., McInish, T. H., and Wood, R. A. (2002). Security price adjustment across exchanges: An investigation of common factor components for dow stocks. Journal of Financial Markets, 5(3), 277-308.
Hasbrouck, J. (1995). One security, many markets: Determining the contributions to price discovery. The Journal of Finance, 50(4), 1175-1199. Hasbrouck, J. (2002). Stalking the ‘efficient price’ in market microstructure
specifications: An overview. Journal of Financial Markets, 5(3), 329-339. Johansen, S. (1995). Likelihood-based inference in cointegrated vector
autoregressive models. Oxford, UK: Oxford University Press.
Kaul, A. and Mehrotra, V. (2007). The role of trades in price convergence: A study of dual-listed Canadian stocks. Journal of Empirical Finance, 14(2), 196-219.
Kanas, A. and Kouretas, G. P. (2001). Black and official exchange rate volatility and foreign exchange controls: Evidence from Greece. International Journal
of Finance and Economics, 6(1), 13-25.
Kao, C. W. and Wan, J. Y. (2012). An investigation on the price discovery of the NT-Dollar foreign exchange market. Taiwan Economic Forecast and Policy, 42(2), 81-117. In Chinese.
King, M. R., Osler, C. L., and Rime, D. (2013). The market microstructure approach to foreign exchange: Looking back and looking forward. Journal
of International Money and Finance, 38, 95-119.
Lehmann, B. (2002). Some desiderata for the measurement of price discovery across markets. Journal of Financial Markets, 5(3), 259-276.
Lieberman, O., Ben-Zion, U., and Hauser, S. (1999). A characterization of the price behavior of international dual stocks: An error correction approach.
Journal of International Money and Finance, 18(2), 289-304.
Lien, D. and Shrestha, K. (2009). A new information share measure. Journal of
Future Markets, 29(4), 377-395.
Lien, D. and Shrestha, K. (2014). Price discovery in interrelated markets.
Journal of Future Markets, 34(3), 203-219.
Lin, Y. L. and Ma, T. (2014). The relationship between pre-trade transparency, order imbalance and investors’ behavioral biases. Chiao Da Management
Review, 34(1), 79-116.
Lok, E. and Kalev, P. S. (2006). The intraday price behaviour of Australian and New Zealand cross-listed stocks. International Review of Financial Analysis, 15(4-5), 377-397.
Peiers, B. (1997). Informed traders, intervention, and price leadership: A deeper view of the microstructure of the foreign exchange market. Journal of
Finance, 52(4), 1589-1614.
models. Economics Letters, 58(1), 17-29.
Pascual, R. and Pascual-Fuster, B. (2014). The relative contribution of ask and aid quotes to price discovery. Journal of Financial Markets, 20, 129-150. Piccotti, L. and Schreiber, B. (2015). Information shares of two parallel currency
options markets: Trading costs versus transparency/tradability. Journal of
Empirical Finance, 32, 210-229.
Sapp, S. G. (2002). Price leadership in the spot foreign exchange market. Journal
of Financial and Quantitative Analysis, 37(1), 425-448. doi: 10.2307/3594987
Shastri, K., Thirumalai, R. S., and Zutter, C. J. (2008). Information revelation in the futures market: Evidence from single stock futures. Journal of Futures
Markets, 28(4), 335-353.
Tse, Y., Xiang, J., and Fung, K. W. (2006). Price discovery in the foreign exchange futures market. Journal of Futures Markets, 26(11), 1131-1143. Tse, Y., Bandyopadhyay, P., and Shen, Y. P. (2006). Intraday price discovery in
the DJIA index markets. Journal of Business Finance and Accounting, 33(9-10), 1572-1585.
Wan, J. Y. and Kao, C. W. (2009). Price discovery in Taiwan’s foreign exchange market. Journal of International Financial Markets, Institutions and Money, 19(1), 77-93.
Wang, P. and Bhar, R. (2014). Information content in CDS spreads for equity returns. Journal of International Financial Markets, Institutions and Money, 30, 55-80.