Holographic data storage using photopolymer
Ken Y. Hsu and Shiuan Huei Lin*Institute of Electro-Optical Engineering *Department of Electrophysics National Chiao Tung University HsinChu, 30050, Taiwan, R. O. C.
ABSTRACT
In this paper, we present investigations on holographic data storage using photopolymer of poly(methyl methacrylate) (PMMA) doped with phenathrenequinone (PQ) molecules. From the system specifications we derive the material parameters that are required for a data storage system. We present a technique of material preparation for obtaining samples with good optical quality. Then we present material characteristics for holographic data storage, including M/#, sensitivity, and material shrinkage. Experimental demonstration on digital data storage is presented and bit error rate is discussed.
Keywords: Photopolymer material, PQ:PMMA, Holographic data storage, M/#, shift multiplexing 1. INTRODUCTION
Holographic dada storage has been considered as one of the next generation information storage technologies because of its distinct parallel data recording/retrival with page oriented data format. Holographic systems which can achieve high storage capacity, high data readout rate, high image quality, and low bit error rate have been proposed and demonstrated [1]. Currently, there are several start-up companies around the world to pursue commercialization of holographic data storage [2-5]. Some companies sale holographic recording medium, which are photopolymer materials in standard disc and card dimensions. Some provide holographic material tester or prototype developing system for the customers to characterize recording media and evaluate potential products. Most of them targeted the first holographic storage product within next few years. Although with this rapid progress, recording material is still the single most crucial factor that determines the development of commercial holographic data storage products. From the practical point of view, it is important to know what are the required material specifications? And, how to develop and characterize such a material? In other words, it is necessary to establish a methodology for defining and characterizing material parameters. In the following we shall first explain how one defines material parameters based on the system specifications. Then, in Section 3, we describe the strategy of designing and the method of fabricating a low shrinkage photopolymer recording material called the PQ:PMMA (phenanthrenequinone- doped poly-methyl methacrylate). In Section 4, optical characteristics of the materials for volume holographic recording such as sensitivity and dynamic range will be presented. Section 5 presents a data storage system demonstration using the PQ:PMMA along with a bit error rate analysis. Finally, some conclusions are given in Section 6.
2. MATERIAL PARAMETERS FOR VOLUME HOLOGRAPHIC RECORDING
In general, the desired characteristics for a good holographic material include high sensitivity for optical exposure, large dynamic recording range, easy to fabricate of large area or volume with high optical quality (or, low scattering noise). From the system point of view, the most important parameters for a holographic recording medium are material’s sensitivity, dynamic range, optical quality, and reliability.
Optical sensitivity is related to how much optical energy (J/cm2) that is required to record a hologram to reach certain strength. High sensitive material enables holographic recording using low power lasers with short exposure time. This is the key to achieve a compact data storage system with high recording speed. There are different ways to define the sensitivity of holographic materials. From the practical point of view, it is convenient to define sensitivity as the exposure energy that is required for recording a holographic grating to achieve 1% strength. Since grating strength is defined as the squared-root value of the diffraction efficiency, it is equivalent to saying that the sensitivity is the exposure energy that is required for recording a holographic grating to achieve10-4 diffraction efficiency.
Dynamic range describes how much change in refractive index of the material one can achieve, which is conveniently defined in terms of the M-number (M#) of the material [6]. In holographic data storage, hundreds or thousands of holograms are multiplexed and recorded at one location of the material. Each of these holograms shares the refractive index change of one spot to produce diffraction. Thus, for a desired diffraction efficiency of each hologram, the higher dynamic range
implies the capability of recording more holograms at one spot. And this implies higher density of data storage. So, how large M# is good enough for our purpose? It will depend on how much data storage density of our requirement, which in turn depends on the performance of the devices such as sensitivity of the CCD array and the pixel number of the spatial light modulator (SLM).
Optical quality represents the uniformity, and bulk and surface scattering of the material. Material non-uniformity will induce image distortion or aberration of the hologram reconstruction, thus producing bit errors in the readout data. One way to evaluate the uniformity of the material is to test its imaging capability. By looking at how much resolution can a material record and reconstruct an image one gets an indication of the uniformity of the holographic material. Bulk and surface scattering property is also important for volume holographic materials, because usually there are hundreds of holograms recorded at one location to share the dynamic range and thus the diffraction signal from each reading is weak. If the scattering is strong, then the scattering noise may cover the signal and results in error bits. The tolerance of scattering depends on the sensitivity of the CCD and the number of holograms to be recorded at one location. Since the diffraction efficiency of data storage is low, usually less than 10-5 or 10-6, the requirement for scattering to be less than 10-6 is a reasonable specification.
Reliability describes many factors that relate to the practical aspects of volume holographic data storage. For example, temperature stability of material’s shelf and hologram archival time is important. For volume holographic storage using thick materials, good dimensional stability is the most stringent requirement. Photopolymer has been considered as an attractive candidate for write-once-read-many application due to its easy-fabrication, high flexibility in compositions, and large dynamic range, etc [7-8]. Typically, these materials are limited to a few millimeters because of the shrinkage problem. It has been shown that a few percent of dimensional change in a 100µm recording material during (or after) holographic recording will result in a loss of Bragg condition such that the recorded information can not be readout completely [9-10]. The thicker the material is, the more serious the shrinkage effect is.
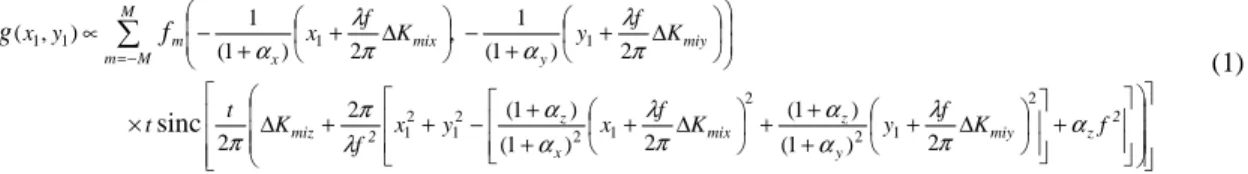
Consider an angle-multiplexed holographic system with 90 degrees geometry, as shown in Fig. 1. A photopolymer block with dimensions of 5x5x5 mm3 is used as the recording medium. The input images are presented on a LCTV, and readout images are detected by CCD camera. The two dimensional distribution of the ith reconstructed image can be expressed as [10] + + ∆ + + + + ∆ + + − + + ∆ × + ∆ + − + ∆ + − ∝
∑
− = 2 z miy y z mix x z 2 miz M M m miy y mix x m f K f y K f x y x f K t t K f y K f x y x f g α π λ α α π λ α α λ π π π λ α π λ α 2 1 2 2 1 2 2 1 2 1 1 1 1 1 2 ) 1 ( ) 1 ( 2 ) 1 ( ) 1 ( 2 2 2 ) 1 ( 1 , 2 ) 1 ( 1 ) , ( sinc (1)where (2M+1) is the total number of holograms recorded in the medium, αx, αy, and αz, are material shrinkage coefficients along the x-, y-, and z-directions, respectively, λ is the wavelength, t is the thickness of the medium, f is the focal length of lenses L3 and L4, and ΔKmi represents the Bragg mismatch between the reference beams of the ith and the mth holograms. Assume that t = 5 mm, f = 10 mm, λ= 514.5 nm, then the reconstructed image can be found if the shrinkage coefficient is given. Table 1 shows the result. It can be seen that when the shrinkage coefficient is larger than 5 x 10⁻⁵ the retrieved images become seriously distorted. For the 5 mm thick medium, the shrinkage coefficient should not be larger than 10-5.
Table 1. The reconstructed images under different material shrinkage coefficients. Fig. 1. Schematic diagram of the optical setup to
store 250 Fresnel holograms using
α= 1x10⁻⁵ α= 5x10⁻⁵
α= 1x10 - 4 α= 5x10 - 4
Original image Retrieved image
2F F
F CCD
To TV Monitor & Host Computer
SH1 BS SF/BE SH2 ST/M1 L1 L2 L3 L4 Polymer Cube Control Signal From Computer Control Signal From Computer LCTV Input Image Laser S-Polarized 5 mm 2F F F CCD To TV Monitor & Host Computer
SH1 BS SF/BE SH2 ST/M1 L1 L2 L3 L4 Polymer Cube Control Signal From Computer Control Signal From Computer LCTV Input Image Laser S-Polarized 5 mm
In order to elaborate the above description between the system and material parameters, we consider a system with the following specifications:
Data recording/readout speed: V = 1Gbit/sec SLM pixels: D = 1 Mbit per page
Laser power: P = 20 mW at 514.5 nm wavelength Recording area per hologram spot: A = 5 mm2 Data storage density: Cd = 100 bit/μm
2
CCD sensitivity: Sc = 1,000 electrons/pixel
Based on the specification of data-recording speed, the light energy density that irradiate on the recording material per hologram recording is Ei = (D/V) x (P/A) = 0.4 mJ/cm
2
. Based on the specification of data read-out speed and CCD sensitivity, by assuming quantum efficiency to be 1, the minimum diffraction efficiency of each hologram can be evaluated as η= Sc x hνx D x (V/D) x (1/P) = 1.94 x 10
-5
. With these values in mind, material specifications can be derived. The above calculations show that, we require a material that can record grating strength of 1.94×10−5 =0.0044when it is exposed to energy of 0.4 mJ/cm2. According to our definition, material sensitivity S is the energy to produce grating strength of 0.01, thus, the corresponding sensitivity of the holographic material that can satisfy our system specification can be calculated to be S = 0.01 x Ei/(η)1/2 = 0.91 mJ/cm2. This is the requirement on material sensitivity.
Specification on dynamic range of the material can also be found. Since data storage density equals data bits per page times total number of pages N that have been recorded at one location, and in turn N is equal to M-number divided by the squared root ofη, thus M-number is related to Cd via the following equation:
final d A D C η number M− × = (2)
By inserting the corresponding digits into the above equation, the required M-number of the material is calculated to be 2.16. These requirements on the sensitivity and dynamic range of recording medium are not so difficult to meet by current photopolymer materials. The difficult part is the shrinkage problem that we described, which should be less than 10-5 for a 5 mm thick block. In next section, we describe our technique for fabricating photopolymer materials with negligible shrinkage.
3. MATERIAL PREPARATION
Our photopolymer material is called PQ-doped PMMA, which is a brief name of phenanthrenequinone- (PQ-) doped poly(methyl methacrylate) (PMMA) [11-12]. The basic strategy for alleviating the shrinkage problem is to make a strong polymer matrix that can support the material structure, which is not affected by light exposure during holographic recording. In order to be able to record holograms, a small fraction of photosensitive molecules, in our case PQ, are doped and distributed uniformly inside the polymer matrix. These PQ and the corresponding small number of un-reacted monomer molecules are the only species that are responsible for holographic recording. Thus, on the one hand, the material is photosensitive for hologram recording. On the other hand, the basic photopolymer structure is not affected by holographic recording. Therefore, the shrinkage problem can be reduced to minimum. The key to achieve this is to separate the photochemical reaction during holographic recording from the polymerization of the host monomer molecules during material preparation. To achieve this, we have to control the procedure such that the host polymer matrix PMMA is formed during the material preparation and only a few percent of un-reacted MMA monomer molecules are left for optical exposure usage during holographic recording.
After a series of experiments [13], we have found a two-step procedure that can produce high quality PQ:PMMA buck samples. In the first step, the initiator, azobisisobutyronitrile (AIBN, ~0.5%) and PQ molecules (up to 0.7%) are dissolved in solvent MMA. The solution was purified to remove the un-dissolved particles so as to reduce light scattering centers. The purified solution was poured into a square glass tube and then put in a pressure chamber at room temperature for about 120 hours until the solution turned into homogeneously viscid. In the second step, the temperature of the chamber was elevated to 45 oC for 24 hours to accelerate the thermo-decomposition rate of AIBN. Chain reaction was accelerated until polymerization was complete and the sample became a solid block. The final shape of the sample was determined by the geometry of the glass container. To form a disk, the viscid solution is dispensed into a glass cell formed by two optically flat glass plates of disk shape and with a spacer in between.
We have found that, careful control of the first step is a key to obtain high quality samples. During this stage, nitrogen molecules are released from the thermo-decomposition of AIBN and heat are produced from the chain propagation due to
polymerization of MMA monomers. In order to produce a sample with no residual air bubbles, the N2 gas molecules and heat should be released completely from the liquid in a slow pace. Thus, this step should be kept in low temperature, in our case room temperature. We have also found that, stir is very helpful for releasing N2 gas and heat, thus producing samples with high uniformity. A side benefit of the stir is that the time for the first step is reduced because both polymerization reaction as well as release of heat and N2 gas has been accelerated slightly. In our experiments we found it could be reduced from 120 to 100 hr. Note that during this step, because of the polymerization reaction the liquid became thicker and thicker, thus viscosity of the liquid is a good measurement about the degree of polymerization. The viscosity can be measured by using a typical Ubbelohde capillary instrument. We found that in order to fabricate samples with high optical quality, it is necessary for the first step to produce the solution with relative viscosity larger than 7.
4. HOLOGRAPHIC CHARACTERISTICS OF PQ:PMMA SAMPLES
Our PQ:PMMA samples appear to be yellow color. We have measured the optical transmission of the different thick samples in the visible range. The samples possess strong absorption below blue wavelength (<450 nm). They are transparent for red and near infrared wavelengths (>540 nm). In the following experiments we used an argon laser with wavelength 514.5 nm. At this wavelength the absorption coefficient is 2.7 cm-1.
We first measured surface flatness of the samples. A disk sample of 5 in diameter and 2 mm thick was placed into one arm of a Mach-Zehnder interferometer. The interferogram was imaged onto a CCD camera, shown in Figure 2. It was found that there was only on fringe across the 5 in diameter. This means our technique can produce large samples with high flatness.
We then record a hologram of the resolution chart on the disk sample. The reconstructed image showed that down to number 3 of group 6 can be resolved. This implies that the uniformity of our photopolymer samples is so good to support the imaging resolution down to 10 µm. This high resolution is attributed to low scattering of the material.
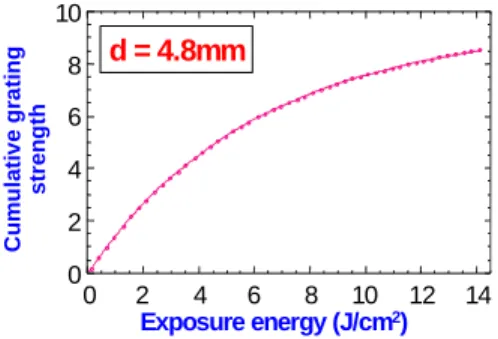
Next, we performed a measurement on the dynamic range. A 4.8 mm thick sample was used to record 360 plane wave holograms on a spot of the material by use of peristrophic multiplexing method. During recording, diffraction efficiency of each hologram was measured in real time by use of a He-Ne laser at Bragg match. Then the cumulative grating strength of the material can be obtained by taking summation of the grating strength (equals to squared root of the diffraction efficiency) of the current hologram with that of previously recorded holograms. It is plotted as function of total exposure energy that has been illuminated on the material during recording, as shown in Fig. 3. This curve describes important characteristics of a holographic recording material. If we perform a curve fitting by the function C = Csat[1-exp(-E/Er)], then the saturation value Csat gives the dynamic range or M/#, and Er gives the exposure constant of the material. From Fig. 3, it is obtained that for the 4.8 mm sample, M/# equals 8 and Er = 6 J/cm2. According to the definition of sensitivity, Er is related to material sensitivity S by the expression
)] / exp( 1 [ 01 . 0 =Csat − −S Er (3)
By inserting above values of Csat and Er into Eq. (3), sensitivity of our PQ:PMMA sample is found to be 7.5 mJ/cm2. This is about order of magnitude less than that required for satisfying the system specification described in Section 2. If the material sensitivity is not improved, then with the same laser power, the data recording speed will be reduced.
The maximum data recording density that can be supported by the material can also be estimated. According to the system specification described in Section 2, the minimum diffraction efficiency for each hologram is required to be 1.94 x
Fig. 2. The picture of interferogram Fig. 3. The running curve of the cumulative grating strength as a function of total exposure energy
0 2 4 6 8 10 0 2 4 6 8 10 12 14 C u m u la ti ve g rat in g str e n g th Exposure energy (J/cm2) d = 4.8mm
10-5. Now the M-number is 8, hence the maximum number of holograms that can be recorded at one location of the material can be calculated to be 1,800. If we use a SLM with one million pixels per page and the recorded area is 5 mm2, then our material is capable to support a data storage density of 360 bits/um2.
Finally, we performed a multiple-holograms storage experiment on our polymer tube. A 5x5x5-mm3 photopolymer cube was used in our experiment. The schematic diagram of the optical setup is the same as that shown in Figure 1. The reference and signal beams were incident into the cube at the adjoin sides of the cube. The intensity of each beam was 2mW/cm2. Angle-multiplexing scheme was used in the experiment, each step with angle separation of 0.020. Two hundred and fifty Fresnel holograms of a chessboard pattern, which was shown on a Liquid Crystal Television (LCTV) with resolution of 320x240 pixels, were recorded on a single location. The exposure time of each hologram was conducted by the recording schedule by taking into account of the use-and exhaust behavior of photopolymer materials to achieve equal diffraction efficiency [13].
We compared the original and reconstruct images, and the linear scan of the gray level of the corresponding images. It is found that the reconstructed images have good fidelity as the original image. Since the whole image can be reconstructed for such a 5-mm thick block, from the analysis in Section 2 it implies that shrinkage in this material is as less as 10-5.
To explain the low shrinkage phenomenon, we briefly discuss possible physical mechanisms that involved in our samples. Chemical analysis showed that the residual monomer MMA in our samples is about 10%. When light interference pattern is present, PQ molecules became radicals and bonded with a single monomer, MMA in the bright region. The chemical bonding reaction in bright regions produces a spatial gradient of the density levels of free PQ and MMA molecules, thus these molecules diffuse from the dark into bright regions to sustain further chemical bonding reaction until they are exhausted. Consequently, a difference between the refractive index of the polymer matrix in dark region and that of PQ-MMA compounds in bright one is created, i.e. a phase grating. Since the matrix of host polymer was not influenced by light distribution and the minimal shrinkage effect was therefore achieved. Our argument was confirmed by another experiment. Illumination with light on a liquid mixture (yellow color) of MMA monomers and PQ molecules will turn it into transparent, just as we observed in holographic exposure of solid samples. But the liquid mixture remained liquid although the free PQ and MMA molecules have already exhausted by light illumination. It is plausible to infer from this result that PQ molecules did not induce photo-induced polymerization, instead they bonded with residual MMA monomers. In a previous paper [14], it was shown that thermal treatment could increase the diffraction efficiency of the PMMA polymer material. We believe that this effect may result from thermal-degradation of residual MMA monomers.
5. HOLOGRAPHIC DATA STORAGE IN PQ:PMMA SAMPLES
We have constructed a holographic data storage system using our PQ:PMMA photopolymer samples. The photo of the system is shown in Fig. 4. The recording media is a disk of 5-inch diameter and 2 mm thick, which is mounted on a rotation mechanism and driven by a stepping motor. Data input device is a LCD SLM manufactured by Control Opto company. Data readout device is a digital CCD, which is connected to a frame grabber for data processing. The light source is a DPSS laser at 532 nm wavelength. The laser light is delivered to the system through a multi-mode fiber. The object beam is collimated before it illuminates the SLM. The reference beam is a spherical wave that is incident on the disk from the back side of the disk. So, shift-multiplexing reflection holograms are recorded in this system.
The storage system has been used as a computer data bank to store digital data files. Fig. 5 shows a reconstructed and decoded BMP image of 120KB, which are recorded as 57 holograms in the disk. It is a color photo of three swimming
Fig. 4. Picture of a holographic data storage system using a PQ:PMMA disk.
Fig. 5. Reconstructed BMP image from a PQ:PMMA photopolymer disk. CCD Imaging Lens SLM Polymer Disk Stepping Motor Lens
ducks. By first visual looking, the photo is fine. If we look more carefully we would see some random noise scattered in the photo. These are produced by the error bits generated through the procedures of hologram recording and reconstruction. It is interesting to see how much is the bit error rate of this system and how to improve it. In fact, Fig. 5 is readout by using a compensation technique to be described in the following.
An error bit is generated if the input bit is logic 1 and produces logic 0 to the readout bit, and vice versa. Total number of error bits divided by the total number of input bits gives bit error rate. The origins of error bits may come from aberrations of the optical system, imperfections of SLM and CCD, non-uniformity of laser light, scattering of the recording media, inter-pixel crosstalks in a page, and inter-page crosstalks of different pages etc. All these factors are involved together. By inspecting the characteristics of the probability distribution of the output bits one may get a hint for improvement.
Fig. 6(a) shows one of the reconstructed images from the disk, and Fig. 6(b) plots the probability functions of the readout bits. In the figure the probability functions for input bits with logic 0 and logic 1 are plotted as a function of gray levels. If the discrimination level for output logic is set at the intersection level, in the example 95, then the shaded area stands for the bit error rate. It is counted to be 0.015, which is too large to reconstruct a recognizable photo of the ducks. By inspecting at the probability function of logic 1, we see that this function has been broadened in an uniform manner compared to the delta function of the binary input. It could be resulted from the non-uniformity of the devices and recording medium. Fig. 6(a) also indicates this non-uniform effect. If this effect can be reduced then the bit error rate of the data can be improved. One way to achieve it is to use a compensation technique for readout. Before recording data pages, we record a hologram into the holographic disk an input image with all pixels be logic 1 and then reconstruct this image. This retrieved image is used as a reference for readout. Then, the data pages are recorded in the holographic disk. During readout, the gray level of each pixel was normalized by that of the corresponding pixel in the reference image. The non-uniformity of the retrieved image can thus be compensated. Fig. 7 (a) shows the result of Fig. 6 (a) after compensation, and Fig. 7(b) plots the probability functions of the readout bits. It can be seen that the shaded intersection area is decreased. If we choose the discrimination level as 120, then bit error is counted to be 0.0018. It has been improved by almost one order of magnitude.
Fig. 6(a). Picture of one of the reconstructed images from the disk
Fig. 6(b). The probability functions of the readout bits. Data 0 stands for Logic 0, and data 1 stands for logic 1.
Fig. 7(a). Compensation output of Fig. 6(a). Fig. 7(b). The probability functions of the readout bits after compensation. Data 0 stands for Logic 0, and data 1 stands for logic 1.
10-5 10-4 10-3 10-2 10-1 100 0 50 100 150 200 250 300 Data 0 Data 1 P roba b il it y Gray levels 10-5 10-4 10-3 10-2 10-1 100 0 50 100 150 200 250 300 Data 0 Data 1 P roba b il it y Gray levels 10-5 10-4 10-3 10-2 10-1 100 0 50 100 150 200 250 300 350 Data 0 Data 1 P roba b il ity Gray levels 10-5 10-4 10-3 10-2 10 10-5 10-4 10-3 10-2 10-1 100 0 50 100 150 200 250 300 350 Data 0 Data 1 P roba b il ity Gray levels
6. CONCLUSION
We have reported investigations on holographic data storage using photopolymer of poly(methyl methacrylate) (PMMA) doped with phenathrenequinone (PQ) molecules. We have described the relationships between parameters of a holographic data storage system and that of the recording medium. From the system specifications the material parameters that are required for a data storage system can be derived. Then, we have presented a technique of material preparation for obtaining PQ:PMMA samples with good optical quality. Disk type samples with diameter of 5 inch and bulk samples with dimensions larger than 5 x 5 x 5 mm3 have been made. The shrinkage coefficient of the samples are shown to be smaller than 10-5, the M-number of 4.8 mm sample is measured to be 8, and the exposure energy constant is 6 J/cm2. This M/# is capable of supporting a holographic data storage with data density of 360 bits/um2. And the exposure energy constant is corresponding to exposure sensitivity of 7.5 mJ/cm2. We have presented an experimental demonstration on digital data storage using a PQ:PMMA disk. By use of a compensation technique for readout the bit error rate of the system has been improved from 0.015 to 0.0018.
ACKNOWLEDGEMENT
The authors are grateful for material preparation provided by Prof. Wha Tzong Whang and Mr. Yi-Nan Shiao. We gratefully acknowledge the partial support from the Ministry of Education under contract 89-E-FA06-1-1 and the partial support from the Lee & MTI Center for Networking Research at National Chiao Tung University.
REFERENCES
[1]. H. J. Coufal, D. Psaltis and G. T. Sincerbox, Holographic Data Storage, Springer-Verlag, 2000. [2]. Aprilis, Inc.: http://www.aprilisinc.com.
[3]. InPhase technologies: http://www.inphase-technologies.com. [4]. Polight technologies: http://www.polight.com.
[5]. Optware Corporation: http://www.optware.co.jp.
[6]. F. Mok, G. Burr, and D. Psaltis, “A system metric for holographic memory systems”, Opt. Lett., Vol. 21, pp.886-888, 1996.
[7]. L. Dhar, M. G. Schnoes, T. L. Wysocki, H. Bair, M. Schilling, and C. Boyd, “Holographic storage of multiple high-capacity digital data pages in thick photopolymer”, Optics Letters, Vol. 23, pp. 1710-1712, 1998.
[8]. K. Y. Hsu, S. H. Lin, W. Z Chen and W. T. Whang “Holographic data storage using photoplymer,” SPIE Conference on Photorefractive Fiber and Crystal Devices: Materials, Optical Properties, and Applications, SPIE 3801, pp.66-74, 18-23 July, 1999, Denver, Colorado.
[9]. M. L. Hsieh and K. Y. Hsu, "Grating detuning effect on holographic memory in photopolymers," Optical Engineering, Vol. 40, No. 10, pp. 2125-2133, 2001.
[10]. S. H. Lin and K. Y. Hsu, “Effect of grating detuning on holographic data storage”, SPIE Conference on Photorefractive Fiber and Crystal Devices, 4110-12, San Diego, July 30-31 2000.
[11]. S. H. Lin, K. Y. Hsu, W. Z. Chen and W. T. Whang, “phenanthrenequinone-doped poly(methyl methacrylate) photopolymer bulk for volume holographic data storage,” Optics Letters, Vol. 25, pp.451-453, 2000.
[12]. G. J. Steckman, I. Solomatine, G. Zhou, and D. Psaltis, “Characterization of phenanthrenequinone-doped poly(methyl methacrylate) for holographic memory,” Optics Letters, Vol. 23, pp.1310-1312, 1998.
[13]. K. Y. Hsu, S. H. Lin, Y. N. Hsiao, and W. T. Whang, “Experimental characterization of phenanthrenequinone-doped poly(methyl methacrylate) photopolymer for volume holographic storage”, Opt. Eng., Vol. 42, No. 5, pp. 1390-1396, May 2003.
[14]. J. Mumbru, I. Solomatine, D. Psaltis, S. H. Lin, K. Y. Hsu, W. Z. Chen, and W. T. Whang, “Comparison of the recording dynamics of phenanthrenequinone-doped poly(methyl methacrylate) materials,” Optics Communications, Vol.