IEEE COMMUNICATONS LETTERS, VOL. 5, NO. 8, AUGUST 2001 337
An Improved Cell Type Classification for Random
Walk Modeling in Cellular Networks
Yu-Chee Tseng, Member, IEEE, and Wei-Neng Hung
Abstract—In an earlier paper by Akyildiz et al., it is shown how
to classify cell types in a cellular network based on the random walk model; the number of states is reduced from a naive classification of
(3 2+3 5) to ( +1) 2 in a hexagonal configuration, where
is the number of layers of cells. By using a reflection relation, this paper shows that the number of states can be further reduced to
( + 1)( + 3) 4 if is odd, and ( + 4) 4 if is even. These numbers are about half of that of Akyildiz et al. Simulation experiments indicate that our approach significantly reduces the computational costs in the related probability derivation.
Index Terms—Cellular network, location management, personal
communication services (PCS), random walk, wireless communi-cation.
I. INTRODUCTION
I
N PERSONAL Communications Services (PCS) systems, the service area is covered by a number of cells. A mobile subscriber (MS) may roam freely around cells. To evaluate the performance of a PCS system, it is required to characterize the movement patterns of an MS. In the literature, the most com-monly used model is random walk [2]–[4], where it is assumed that an MS may stay in a cell for a period and then move to any of its neighboring cells with equal probability.Akyildiz et al. [1] showed how to classify cell types based on the random walk model. It is proved that an -layer hexag-onal cellular network can be modeled by a transition diagram of states. This is a significant reduction compared to a naive derivation of states. Such reduction further helps to reduce the computational complexity in anal-ysis and simulation based on the random walk model. Several examples are raised in [1].
In this brief contribution, we show how to use a reflection re-lation to further reduce the number of cell types to about a half that of [1]. Performance comparisons are presented to demon-strate the amount of saving in our approach.
II. ANIMPROVEDCELLTYPECLASSIFICATION An -layer hexagonal cellular network (or location area, LA) consists of cells. For the description purpose, the cell at the center is called a subarea-0 cell. The cells farther from
Manuscript received March 14, 2001. The associate editor coordinating the review of this letter and approving it for publication was Dr. J. Evans.
Y.-C. Tseng is with the Department of Computer Science and Information Engineering, National Chiao Tung University, Hsin-Chu 30050, Taiwan, R.O.C. (e-mail: [email protected]).
W.-N. Hung is with the Department of Computer Science and Information Engineering, National Central University, Chung-Li, 32054, Taiwan, R.O.C.
Publisher Item Identifier S 1089-7798(01)07664-5.
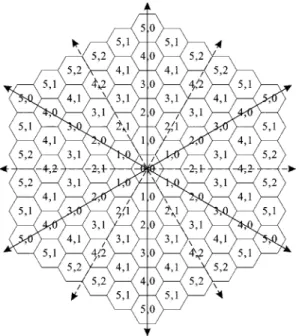
Fig. 1. Akyildiz et al.’s cell type classification in a 6-layer network.
the center cell and directly next to subarea- cells are called subarea- cells. A 6-layer network is shown in Fig. 1.
When modeling a mobile network, it is desired to determine the probabilistic distribution of the number of moves before an MS will move out of the LA starting from an arbitrary cell in the LA. This problem can be modeled by a state-transition diagram, where each transition is associated with a probability. By a naive approach, we can assign each of the cells to one state. However, this number of states will explode quickly as increases, sometimes making analysis and simulation works difficult and costly.
One approach to reducing the computational cost is to merge equivalent cells to a single state, if possible. In [1], it is shown that we can use 6 axes, each separated by 60 deg, to divide the cellular network into 6 subareas. Cells at equivalent positions in these areas are assigned to the same types, as shown in the example in Fig. 1.
The following definition shows when two cells are equivalent, and can be classified as the same type.
Definition 1: Given two cells and , we say that they are equivalent, denoted as , if there exists a one-to-one correspondence between the neighbors of
and the neighbors of such that
, , and the probabilities that an MS will move from to and from to , and vice versa, are equal.
338 IEEE COMMUNICATONS LETTERS, VOL. 5, NO. 8, AUGUST 2001
Fig. 2. Our cell type classification in a 6-layer network.
In the following, we describe our cell type classification. The steps recursively assign types to cells in an -layer network from the inner subareas. Each cell in subarea- will receive a type assignment for some .
1) The single cell in subarea-0 is assigned type .
2) for to do
a) In subarea- , identify the six cells that are adjacent to only one cell (which must be of type ) in sub-area- . Assign type to these six cells.
b) for to do
In subarea- , the cells that are unmarked and are adjacent to a cell of type are assigned
type .
end for; end for;
Fig. 2 shows how the above classification works in a 6-layer network. Intuitively, the network is still divided by 6 axes, each separated by 60 deg. For each area, we further “fold” it by half along its center (shown by dotted arrows in the figure). Cells are assigned to the same types through a reflection relationship along the dotted arrows. Take cells in subarea-5 for example. The six cells adjacent to (and only to) cells of type are assigned type . The 12 unmarked cells adjacent to cells of type are assigned type . Then the next 12 unmarked cells adjacent to cells of type are assigned type .
Based on the following reasoning, we can claim that the above type classification satisfies Definition 1.
1) When , the claim trivially holds, so we consider the cases where in the following.
2) For each cell of type , where , the multiset containing neighbors of this cell is ,
, , , ,
. Note that the “mod” operation takes care of the special numbering for cells in subarea-1. For each cell of type , the multiset containing neighbors of this
cell is , ,
, boundary , boundary ,
boundary , where the prefix “boundary” means that one neighbor of this cell is out of the -layer network. 3) For each cell of type , where and is odd, the multiset containing neighbors of this cell depends on the value of . a) If , the multiset is , , , , , . b) If , the multiset is , , , , , .
For each cell of type , where and
is even, the multiset containing neighbors of this cell will depend on the value of .
a) If , the multiset is ,
, , , ,
.
b) If , the multiset is ,
, , , , .
4) For each cell of type , where is odd and , the multiset containing neighbors of this cell will depend on the value of .
a) If , the multiset is , , , , boundary , boundary . b) If , the multiset is , , , , boundary , boundary .
For each cell of type , where is even and , the multiset containing neighbors of this cell will depend on the value of .
a) If , the multiset is , , , , boundary , boundary . b) If , the multiset is , , , , boundary , boundary .
Based on the above type classification, the state transition di-agram of an 6-layer network ( ) is shown in Fig. 3. How-ever, in Fig. 3, we also add some absorbing states for mobile subscribers to move out of the current -layer network. Fol-lowing the formulation in [1], for each cell , where , there is an absorbing state for this purpose. The probability associated with each transition can be derived based on standard random walk modeling techniques.
Under our classification, the total number of types is
and is odd and is even.
(1)
For example, for 6 and 7, there are 15 and 20 states, re-spectively, as opposed 21 and 28 states in [1], respectively. As increases, the reduction in the number of states is about half compared to [1].
TSENG AND HUNG: AN IMPROVED CELL TYPE CLASSIFICATION FOR RANDOM WALK MODELING IN CELLULAR NETWORKS 339
Fig. 3. State-transition diagram under our classification in a 6-layer hexagonal cellular network.
III. ANALYSIS ANDCOMPARISON
Based on our classification, we derive the probability distribution for an MS to move out of an -layer network starting from the center cell. We then show experimental results to demonstrate the saving on computational costs with our classification.
With states, the transition probabilities between states can be represented by an matrix
..
. ... ... ... ... . .. ... ... ...
Let’s define the th power of as follows: if
if . (2)
Intuitively, the element in is the probability that an MS moves from state to state with exactly steps. Following the derivation in [1], the probability that an MS initially resides at a cell, moves into a cell at the th step, and then moves out of the network at the
th step, is
for
for ,
(3)
where .
Suppose that an MS initially resides at a cell. The ex-pected number of steps that the MS moves out of the -layer network is computed as
(4)
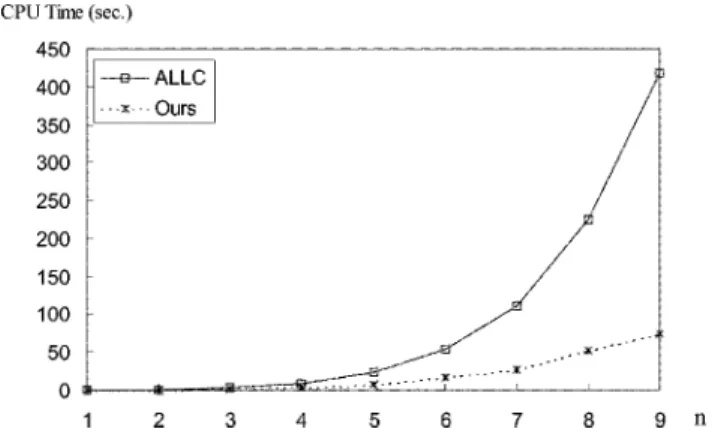
Fig. 4. Comparison on the CPU time required to computeK .
Fig. 5. Comparison on the number of floating-point operations required to computeK .
To demonstrate how much benefit can be obtained by our type classification, we computed (4) by using MATLAB 5.0. The similar expected value derived by reference [1] was also imple-mented (termed as ALLC). Note that we chose to use MATLAB instead of hand-written codes for fairness reason (code gener-ation and optimizgener-ation are expected to be similar). The exper-iments were run on an IBM PC-compatible with AMD Athlon 750 MHz CPU with 384 MB RAM and Windows 98. We com-pared the computational complexity to derive these two for-mulae. Fig. 4 shows the computational cost (obtained by the
cputimecommand). As can be seen, the reduction is at least by a factor of a quarter. Fig. 5 shows the numbers of floating-point operations being used in these two formulas (obtained by theflopscommand). The reduction is about an order.
In summary, we have proposed an improved cell classifica-tion in a cellular network, which can be used in the random walk model to evaluate mobile subscribers’ roaming behavior. Our approach significantly reduces the time complexities for random walk modeling.
REFERENCES
[1] I. F. Akyildiz, Y.-B. Lin, W.-R. Lai, and R.-J. Chen, “A new random walk model for pcs networks,” IEEE J. Select. Areas Commun., vol. 18, pp. 1254–1260, 2000.
[2] I. Akyildiz, J. Ho, and Y. Lin, “Movement-based location update and selective paging for PCS networks,” IEEE/ACM Trans. Networking, vol. 4, pp. 629–638, Aug. 1996.
[3] I. F. Akyildiz and J. S. M. Ho, “Dynamic mobile user location update for wireless PCS networks,” ACM Wireless Networks, vol. 1, no. 2, pp. 187–196, July 1995.
[4] J. S. M. Ho and I. F. Akyildiz, “Mobile user location update and paging under delay constraints,” ACM Wireless Networks, vol. 1, no. 4, pp. 413–426, Dec. 1995.