Applicability of a generic index for diatom assemblages to monitor
pollution in the tropical River Tsanwun, Taiwan
Jiunn-Tzong Wu
1,2,* and Lai-Tsu Kow
11
Institute of Botany, Academia Sinica, Taipei, 11529, Taiwan; 2
Department of Botany, National Taiwan University, Taipei, 10764, Taiwan; *Author for correspondence (e-mail: [email protected])
Received 15 March 2001; accepted in revised form 18 July 2001
Key words: Bioindicator, Diatom, Generic index, Taiwan, Tropical river, Water pollution, Water quality
Abstract
A generic index (GI) utilizing epilithic diatom assemblages as a bioindicator of water pollution in subtropical rivers in Taiwan was applied to a study of a tropical river. Seven sites on the River Tsanwun were sampled seasonally from August 1995 to June 1998. Although there is a marked difference in water chemistry between tropical and subtropical rivers in Taiwan, the dominant genera of their diatom assemblages are quite similar. The six genera used for the calculation of GI in the subtropical rivers were also the main components of diatom assemblages in the River Tsanwun. The calculated values displayed a close correlation with water quality, evalu-ated on the basis of physical and chemical variables. A strong correlation was found between this GI and other diatom-based indices of water quality.
Abbreviations: BOD – biochemical oxygen demand, CEC – Commission for Economic Community index, DAI
– diatom assemblage index for organic pollution, GDI – generic diatom index, GI – generic index of diatoms, IBD – indice biologique diatomique, IPS – indice de polluosensibilité, SI – saprobity index, TDI – trophic dia-tom index, WQI – river water quality index
Introduction
Diatoms have been used in a number of countries as bioindicators of river pollution (Whitton et al. 1991; Whitton and Kelly 1995; Whitton and Rott 1995; Pry-giel et al. 1998; Stevenson and Pan 1999) and a va-riety of indices have been developed for this purpose. These include the Descy index (Descy 1979), indice de polluosensibilité (IPS) (Coste in Cemagref (1982)), saprobity index (SI) (Sládecˇek 1986), ge-neric diatom index (GDI) (Coste and Ayphassorho 1991), Commission for Economic Community index (CEC) (Coste and Descy 1991), indice biologique di-atomique (IBD) (Lenoir and Coste 1996), diatom as-semblage index for organic pollution (DAI) (Wa-tanabe et al. 1986) and the trophic diatom index (TDI) (Kelly and Whitton 1995). These indices were de-rived and applied principally in temperate regions, and there is little information regarding their
applica-bility in the tropics and subtropics. This needs be evaluated before the indices are applied routinely in warmer climates.
Taiwan covers both subtropical and tropical cli-matic zones. Diatoms have been used to monitor pol-lution in some Taiwan rivers during the last two de-cades (Wu and Suen 1985; Wu 1986). Recently, a generic index (GI) of diatom assemblages was pro-posed on the basis of studies of the subtropical Kee-lung River, as an alternative to the conventional dia-tom-based indices (Wu 1999). The GI differs from conventional indices in that only six dominant genera (Achnanthes, Cocconeis, Cyclotella, Cymbella,
Melo-sira, Nitzschia) are used for calculation. This index
has the advantages of simplicity and user-friendliness, because only identification to the genus is required.
Our previous investigation showed that the river environment in the tropical southern part of Taiwan is somewhat different from that in the subtropical
north (Wu and Yang 1996). For instance, the hard-ness, conductivity, pH and temperature of river water all tend to be considerably higher in the southern riv-ers. This has given rise to quantitative as well as qual-itative differences in the biota. The aim of the study reported here was to test the validity of using the GI for a tropical river. The River Tsanwan was chosen for this purpose, utilizing data from 1995 to 1998.
Materials and methods
Study sites
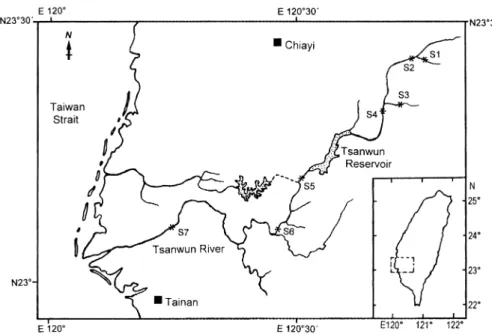
The River Tsanwun in southern Taiwan (Figure 1) is the major water resource for the Chia-Nan Plain. This river is 138.5 km long and has a basin of 1177 km2. The watershed has a yearly precipitation of 2594 ± 696 mm (30-year mean) (Wang et al. 1994). A rainy season occurs from May to August, when 87% of the yearly total precipitation occurs. A dry season occurs from October to April. Monthly mean air temperature ranges from 17 to 29 °C, with a yearly average of 24 °C.
Rapid growth of the human population and use of mountain slopes over the past fifty years have given rise to a pronounced change in quality and quantity of the river water, particularly in the lower reaches. In the upper reaches, the watershed has various land uses, serious habitat fragmentation, expanding areas
of human disturbance and rapid habitat alteration. It appears to be only slightly polluted by heavy metals (Hung et al. 1996), but organic sewage discharges from households and agriculture are a serious con-cern.
Site selection and sampling
The study included seven sampling sites (S1–S7) dis-tributed from the upper to lower reaches of the river (Figure 1). Sampling was conducted seasonally from September 1995 to April 1998. Epilithic diatoms were collected from at least five randomly selected cobbles or boulders at each sampling site, in locations where the current was 0.2 to 1.0 m s−1, as recommended by Kelly et al. (1998). A toothbrush was used to remove diatoms from an area of ca. 36 cm2 stones that were free from filamentous algae. The samples were fixed by Lugol’s iodine solution immediately after collec-tion and cleaned with acid (acetic acid: sulfuric acid = 9: 1) in the laboratory. After washing with deion-ized water, samples were mounted on a slide with Naphrax (Northern Biological Supplies Ltd., Ipswich, UK). Diatoms were observed and identified under a phase contrast microscope.
Samples for water quality analyses were collected at the same time as the diatoms. Environmental fac-tors such as temperature, pH and conductivity of the river water were measured in situ. For analysis of chemical constituents, samples were filtered through
0.45 m membrane filters immediately after collec-tion and stored at 4 °C in the dark for transport to the laboratory. Analyses were performed within 5 h of sampling.
Laboratory procedures
The analysis of ammonium, nitrite, nitrate, phosphate, silicate, total organic nitrogen, total phosphorus, bio-chemical and bio-chemical oxygen demands, and dis-solved oxygen followed American Public Health As-sociations (APHA), American Water Works Associa-tion and Water PolluAssocia-tion Control FederaAssocia-tion (1992). Turbidity was measured in the laboratory with an Or-beco-Hellige (Farmingdale, New York) turbidometer. Turbidity, pH, conductivity, ammonium, dissolved oxygen (DO), biochemical oxygen demand (BOD5), and total phosphorus (TP) were used for the calcula-tion of a water quality index (WQI), calculated on a weighted average of variables, employing the modi-fied model of House and Newsome (1988) by O-Yang (1990): WQI = 0.1 [⌺ WiQi]
1.5, where W
i is the
weight, and Qithe quality score of variable i.
Diatoms were identified to genus according to Cleve-Euler (1951–1955); Patrick and Reimer (1966); Gerloff and Cholnoky (1970); Rabenhorst (1971); Krammer and Lange-Bertalot (1986–1991). The frequency of occurrence of each genus was cal-culated by counting at least 400 valves per sample.
Values of SI and TDI were calculated after Sládecˇek (1986); Kelly and Whitton (1995), respectively, em-ploying the equation of Zelinka and Marvan (1961). The values of DAI were calculated according to Wa-tanabe et al. (1986). The GI was calculated for each sample as the ratio of the relative abundance of
Ach-nanthes, Cocconeis and Cymbella to that of Cyclo-tella, Melosira and Nitzschia (Wu 1999). Data were
analyzed statistically using Statistica (Microsoft Inc., Oklahoma, USA).
Results
Physical and chemical conditions
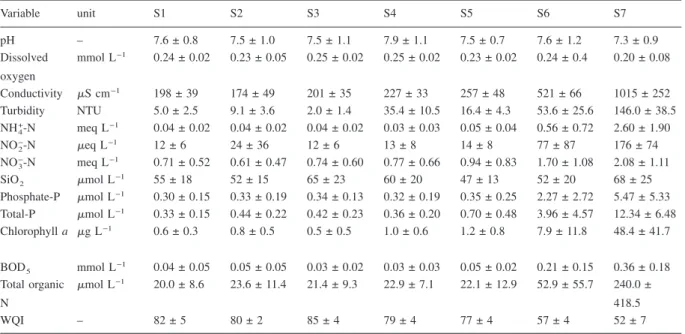
The upper reaches of the River Tsanwun occur in mountainous terrain with little human disturbance. The water collected from sampling sites (S1–S3) in this area contained lower concentrations of nutrients with nearly saturated dissolved oxygen levels (Ta-ble 1). In the middle and lower reaches, there were progressive increases in conductivity, turbidity, BOD5, and nutrient variables such as ammonium, ni-trite, nitrate and phosphate, indicating an elevated de-gree of pollution. The dede-gree of pollution was clearly indicated by the integrated water quality index. The characteristics of water quality are consistent with the
Table 1. Summary of physicand chemical variables of water at sites (S1–S7) along River Tsanwun during 1995–98. (Mean ± standard
de-viation, n = 12). Variable unit S1 S2 S3 S4 S5 S6 S7 pH – 7.6 ± 0.8 7.5 ± 1.0 7.5 ± 1.1 7.9 ± 1.1 7.5 ± 0.7 7.6 ± 1.2 7.3 ± 0.9 Dissolved oxygen mmol L−1 0.24 ± 0.02 0.23 ± 0.05 0.25 ± 0.02 0.25 ± 0.02 0.23 ± 0.02 0.24 ± 0.4 0.20 ± 0.08 Conductivity S cm−1 198 ± 39 174 ± 49 201 ± 35 227 ± 33 257 ± 48 521 ± 66 1015 ± 252 Turbidity NTU 5.0 ± 2.5 9.1 ± 3.6 2.0 ± 1.4 35.4 ± 10.5 16.4 ± 4.3 53.6 ± 25.6 146.0 ± 38.5 NH4+-N meq L−1 0.04 ± 0.02 0.04 ± 0.02 0.04 ± 0.02 0.03 ± 0.03 0.05 ± 0.04 0.56 ± 0.72 2.60 ± 1.90 NO2−-N eq L−1 12 ± 6 24 ± 36 12 ± 6 13 ± 8 14 ± 8 77 ± 87 176 ± 74 NO3−-N meq L−1 0.71 ± 0.52 0.61 ± 0.47 0.74 ± 0.60 0.77 ± 0.66 0.94 ± 0.83 1.70 ± 1.08 2.08 ± 1.11 SiO2 mol L−1 55 ± 18 52 ± 15 65 ± 23 60 ± 20 47 ± 13 52 ± 20 68 ± 25 Phosphate-P mol L−1 0.30 ± 0.15 0.33 ± 0.19 0.34 ± 0.13 0.32 ± 0.19 0.35 ± 0.25 2.27 ± 2.72 5.47 ± 5.33 Total-P mol L−1 0.33 ± 0.15 0.44 ± 0.22 0.42 ± 0.23 0.36 ± 0.20 0.70 ± 0.48 3.96 ± 4.57 12.34 ± 6.48 Chlorophyll a g L−1 0.6 ± 0.3 0.8 ± 0.5 0.5 ± 0.5 1.0 ± 0.6 1.2 ± 0.8 7.9 ± 11.8 48.4 ± 41.7 BOD5 mmol L−1 0.04 ± 0.05 0.05 ± 0.05 0.03 ± 0.02 0.03 ± 0.03 0.05 ± 0.02 0.21 ± 0.15 0.36 ± 0.18 Total organic N mol L−1 20.0 ± 8.6 23.6 ± 11.4 21.4 ± 9.3 22.9 ± 7.1 22.1 ± 12.9 52.9 ± 55.7 240.0 ± 418.5 WQI – 82 ± 5 80 ± 2 85 ± 4 79 ± 4 77 ± 4 57 ± 4 52 ± 7
model that the river was polluted mainly by organic sewage discharges from households or agriculture.
Characteristics of the diatom assemblages
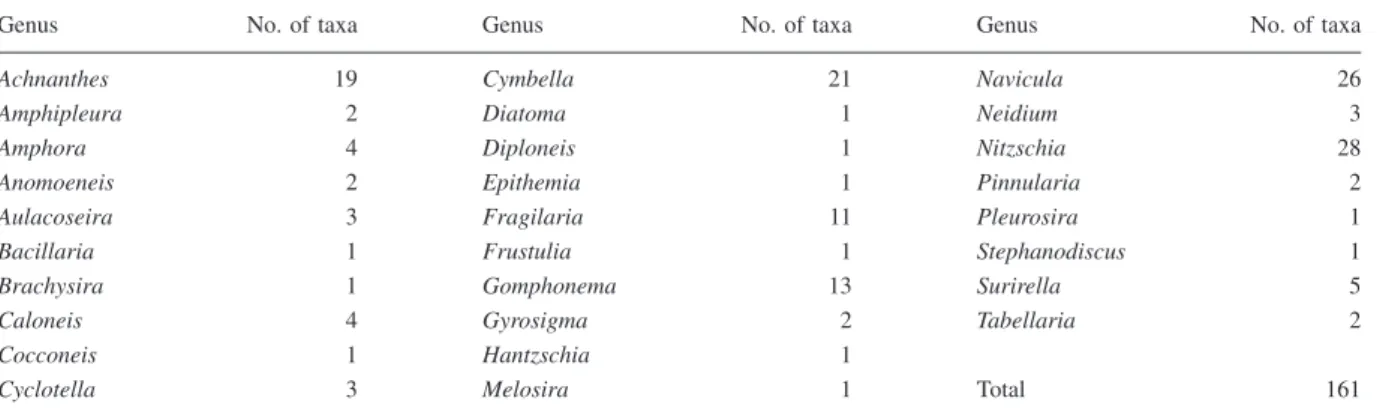
A total of 161 taxa, belonging to 30 genera were re-corded (Table 2). The composition of the diatom as-semblage changed from site to site and season to sea-son, but the majority of species encountered in this river were similar with those found in the River Kee-lung.
At sites located in the upper reaches (S1–S4), the dominant genera were Achnanthes, Cocconeis,
Cym-bella, and Gomphonema. In the middle reach, there
was an increase in abundance of Melosira, Nitzschia
Fragilaria, and Navicula, while in the lower reaches
(S6–S7), the dominant genera became Cyclotella and
Nitzschia. The genera used as the numerator for GI
calculation were more abundant in upper reaches where water was less polluted, whereas those used as the denominator were more abundant in lower reaches where the water was more polluted (Fig-ure 2). As a result, the calculated GI values were higher in less polluted reaches and were lower in more polluted ones (cf. Table 3). Thus, the calculated GI values were a good measure of the degree of pol-lution at sampling sites. Furthermore the values of GI and WQI were strongly related to one another. Fig-ure 3 shows that they are linearly correlated.
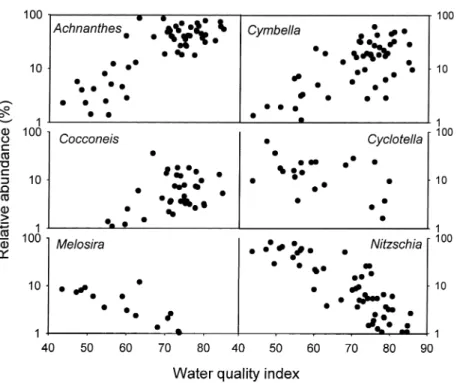
A plot of the abundance of individual diatom gen-era against WQI at each sampling site indicated that
Achnanthes, Cocconeis, and Cymbella had a similar
distribution pattern, with greater abundances at higher WQI values (Figure 4). In contrast, Cyclotella,
Melo-sira, and Nitzschia were more abundant when WQI
values were lower, with an overall negative correla-tion with WQI.
Correlation between various indices of the diatom assemblage
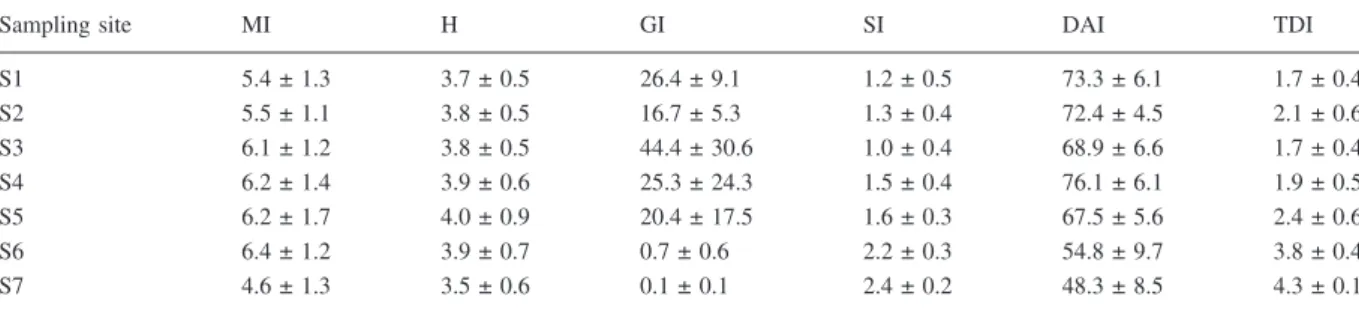
In addition to GI, other indices were calculated, in-cluding the DAI, TDI, SI, MI, and species diversity index (H). The values of MI and H did not vary sig-nificantly among sites (Table 3), indicating that
over-Table 2. Number of taxa in each diatom genus in River Tsanwun.
Genus No. of taxa Genus No. of taxa Genus No. of taxa
Achnanthes 19 Cymbella 21 Navicula 26
Amphipleura 2 Diatoma 1 Neidium 3
Amphora 4 Diploneis 1 Nitzschia 28
Anomoeneis 2 Epithemia 1 Pinnularia 2
Aulacoseira 3 Fragilaria 11 Pleurosira 1
Bacillaria 1 Frustulia 1 Stephanodiscus 1
Brachysira 1 Gomphonema 13 Surirella 5
Caloneis 4 Gyrosigma 2 Tabellaria 2
Cocconeis 1 Hantzschia 1
Cyclotella 3 Melosira 1 Total 161
Figure 2. . Changes in relative abundance of six genera of at the
all biodiversity was not affected by the water pollu-tion in this river system.
The average values of SI at sampling sites ranged between 1.0 and 2.5, indicating levels between oligo-and meso-saprobity; with increased saprobic levels from upstream to downstream. The values of TDI were lower at sampling sites located in upper reaches and higher in lower reaches, showing a similar ten-dency of change with the saprobity. The DAI values were higher at upstream sites and lower at down-stream. They fluctuated in the same manner as GI and WQI along this river. The results of Canonical analy-sis of these indices showed that GI was well corre-lated with SI, TDI, and DAI, with correlation coeffi-cients higher than 0.5, but was not well correlated with MI or H (correlation coefficients <0.3) (Table 4).
Discussion
The diatom flora in the River Tsanwun was somewhat similar to that in River Keelung, on which the
deri-vation of GI was based (Wu 1999). The major differ-ence concerned the relative abundance of certain components of the assemblage. However, the same genera were dominant at both locations. The present study showed that the GI also works effectively to characterize water quality in a tropical river in Tai-wan, despite major differences in climate and water chemistry. The GI values at seven sampling sites in the studied river agreed well with the degree of pol-lution indicated by physical and chemical variables (WQI), as they did in the subtropical river of the north. These results support widespread use of the GI as an indicator of water pollution in Taiwanese rivers and suggest that the method should be tested more widely in tropical and subtropical rivers.
The River Tsanwun is a shallow ecosystem, and we collected only epilithic diatoms. The way of sam-pling and the conditions at samsam-pling sites may strongly affect the composition of this attached dia-tom assemblage (Cox 1984; Lay and Ward 1987; Wendker 1992). To avoid the effect of undesirable in-terferences on the results, the conditions for selecting sampling sites and choice of suitable sampling meth-ods should be strictly taken into account. In this con-cern, the recommendations for sampling of Kelly et al. (1998) provide a framework that can be adapted to most river types, including tropical ones.
In the present study, a comparison has been made between GI and six conventional diatom indices. The correlation coefficients between GI and SI, TDI and DAI are quite high, suggesting that either GI or other indices tested can be used as the indicator of water pollution in the river studied. However, the use of GI may be preferred because only identification to genus level is required. This makes the use of GI more con-venient than other indices. In this concern, GI is sug-gested as one of first priorities in the selection of in-dices for monitoring of river pollution.
Table 3. Values of the Magalef species richness index (MI), Shannon diversity index (H), generic index (GI), saprobity index (SI), diatom
assemblage index for pollution (DAI), and trophic diatom index (TDI) of the diatom assemblages at each sampling site (S1–S7) in River Tsanwun. Mean ± standard deviation, n=12.
Sampling site MI H GI SI DAI TDI
S1 5.4 ± 1.3 3.7 ± 0.5 26.4 ± 9.1 1.2 ± 0.5 73.3 ± 6.1 1.7 ± 0.4 S2 5.5 ± 1.1 3.8 ± 0.5 16.7 ± 5.3 1.3 ± 0.4 72.4 ± 4.5 2.1 ± 0.6 S3 6.1 ± 1.2 3.8 ± 0.5 44.4 ± 30.6 1.0 ± 0.4 68.9 ± 6.6 1.7 ± 0.4 S4 6.2 ± 1.4 3.9 ± 0.6 25.3 ± 24.3 1.5 ± 0.4 76.1 ± 6.1 1.9 ± 0.5 S5 6.2 ± 1.7 4.0 ± 0.9 20.4 ± 17.5 1.6 ± 0.3 67.5 ± 5.6 2.4 ± 0.6 S6 6.4 ± 1.2 3.9 ± 0.7 0.7 ± 0.6 2.2 ± 0.3 54.8 ± 9.7 3.8 ± 0.4 S7 4.6 ± 1.3 3.5 ± 0.6 0.1 ± 0.1 2.4 ± 0.2 48.3 ± 8.5 4.3 ± 0.1
Figure 3. Relationship between values of generic index of the
The GI characterizes water quality according to a ratio of the relative abundance of Achnanthes,
Coc-coneis, and Cymbella to that of Cyclotella, Melosira,
and Nitzschia in the diatom assemblage. In the stud-ied river, the occurrences of some other genera such as Gomphonema, Fragilaria, Aulacoseira, and
Nav-icula also were well correlated with WQI. For the
reasons of consistency and simplicity in the use of index model, these four genera are excluded from the calculation of GI. However, this information may be useful in regions where these taxa comprise a more dominant portion of the community. According to the model of GDI (Coste and Ayphassorho 1991), the oc-currence of certain diatom genera is related to the ex-tent of water pollution. The present study also shows
that the genera used as the numerator for GI calcula-tion were more abundant in upper reaches where wa-ter was less polluted, while those used as the denomi-nator were more abundant in the more polluted envi-ronment. A similar phenomenon has been observed in the majority of Taiwanese rivers. It is likely that this is related to some underlying physiological character-istics of the genus. In order to ascertain this a further study is necessary.
References
American Public Health Associations (APHA), American Water Works Association and Water Pollution Control Federation 1992. Standard Methods for the Examination of Water and Wastewater. 18th edn. APHA, Washington, D.C., USA. Cemagref 1982. Etude des méthodes biologiques quantitatives
d’appréciation de la qualité des eaux. Rapport Division Qualité des Eaux Lyon. Agence de l’Eau Rhône – Méditerranée – Corse, Pierre – Bénite, 28 pp.
Cleve-Euler A. 1951–1955. Die Diatomeen von Schweden and Finnland. Almqvist and Wiksells Boktryckeri AB, Stockholm. Coste M. and Ayphassorho H. 1991. Etude de la qualité des eaux du Bassin Artois-Picardie à l’aide des communautés de di-atomées benthiques (Application des indices diatomiques). Rapport Cemagref Bordeaux. Agence de l’Eau Artois-Picardie, Douai, 227 pp.
Figure 4. Relationship between relative abundance of the six diatom genera and the water quality index calculated on the basis of physical
and chemical variables at sites on River Tsanwun.
Table 4. Correlation coefficients of Cannonical analysis between
generic index (GI), saprobity index (SI), species richness index (MI), species diversity index (H), diatom assemblage index for pollution (DAI) and trophic diatom index (TDI) of River Tsanwun.
GI SI MI H DAI SI −0.73 MI 0.11 −0.15 H −0.06 −0.15 0.69 DAI 0.52 −0.76 0.25 0.26 TDI −0.72 0.88 −0.25 −0.22 −0.81
Cox E.J. 1984. Observations on some benthic diatoms from North German lakes: the effect of substratum and light regimes. Verh. int. Ver. Limnol. 22: 924–928.
Descy J.P. 1979. A new approach to water quality estimation using diatoms. Nova Hedwigia 64: 305–323.
Coste M. and Descy J.P. 1991. A test of methods for assessing wa-ter quality based on diatoms. Verh. int. Ver. Limnol. 24: 2112– 2116.
Gerloff J. and Cholnoky B.J. 1970. J. Cramer Verlag, Berlin, Stut-tgart, 835 pp.
House M.A. and Newsome D.H. 1988. Water quality indices for the management of surface water quality. Wat. Sci. Technol. 21: 11–37.
Hung T.C., Chen C.C., Chuang A. and Meng P.J. 1996. Environ-mental change and resource management in western Taiwan (1): Tsanwun River system: water quality studies. In: Chou C.H. (ed.), Study on Environmental Changes and Resource Management: Tsanwun River (III), Report Acad. Sin., Taipei, Taiwan, pp. 51–133.
Kelly M.G., Cazaubon A., Coring E., Dell’Uomo A., Ector L., Goldsmith B. et al. 1998. Recommendations for the routine sampling of diatoms for water quality assessments in Europe. J. Appl. Phycol. 10: 215–224.
Kelly M.G. and Whitton B.A. 1995. The trophic diatom index: a new index for monitoring eutrophication in rivers. J. Appl. Phy-col. 7: 433–333.
Krammer K. and Lange-Bertalot H. 1986–1991. Bacillariophyceae. Süsswasserflora von Mitteleuropa. 2 (part 1-4). Gustav Fischer Verlag, Stuttgart.
Lay L.A. and Ward A.K. 1987. Algal community dynamics in two streams associated with different geological regions in the southeastern United States. Arch. Hydrobiol. 108: 305–324. Lenoir A. and Coste M. 1996. Development of a practical diatom
index of overall water quality applicable to the French National Water Board Network. In: Whitton B.A. and Rott E. (eds), Use of Algae for Monitoring Rivers II. Inst. Bot, Univ. Innsbruck., pp. 29–43.
O-Yang C.H. 1990. Review of ranking criteria of water quality and pollution index for rivers. Tech. Rep., EPA Taiwan, EPA 79-003-10-021., 333 pp.
Patrick R. and Reimer C.W. 1966. The Diatoms of the United States. Monogr. Acad. nat. Sci., Philadelphia, 688 pp. Prygiel J., Whitton B.A. and Bukowska J. 1998. Use of Algae to
Monitor Rivers—III. Agence de l’Eau Artois-Picardie, Douai, France.
Rabenhorst L. 1971. Die Kielselalgen Deutschlands. Part III. Johnson Reprint Co., New York, London, 816 pp.
Sládecˇek V. 1986. Diatoms as indicators of organic pollution. Arch. Hydrochim. Hydrobiol. 14: 555–566.
Stevenson R.J. and Pan Y. 1999. Assessing environmental condi-tions in rivers and streams with diatoms. In: Stoermer E.F. and Smol J.P. (eds), The Diatoms. Applications for the Environmen-tal and Earth Sciences. Cambridge Univ. Press, Cambridge, pp. 11–40.
Wang C.H., Tsai P.S., Wu S.F., Pen T.R. and Shieh Y.T. 1994. The water cycle of Chia-Nan Plain: Preliminary results for the pre-cipitation and groundwaters. In: Chou C.H. (ed.), Study on En-vironmental Changes and Resource Management: Tsanwun River, Report Acad. Sin., Taipei, Taiwan, pp. 55–64. Watanabe T., Asai K. and Houki A. 1986. Numerical estimation to
organic pollution of flowing water by using the epilithic dia-tom assemblage – diadia-tom assemblage index (DAIpo). Sci. To-tal Environ. 55: 209–218.
Wendker S. 1992. Influence of current velocity on diatoms of a small softwater stream. Diatom Research 7: 387–396. Whitton B.A. and Kelly M.G. 1995. Use of algae and other plants
for monitoring rivers. Aust. J. Ecol. 20: 45–56.
Whitton B.A. and Rott E. 1995. Use of Algae for Monitoring Riv-ers II. Institut für Botanik, Univ. Innsbruck, Austria, 196 pp. Whitton B.A., Rott E. and Friedrich G. 1991. Use of Algae for
Monitoring Rivers. Institut für Botanik, Univ. Innsbruck, Aus-tria, 193 pp.
Wu J.T. 1986. Relation of change in river diatom assemblages to water pollution. Bot. Bull. Acad. Sin. 27: 234–245.
Wu J.T. 1999. A generic index of diatom assemblages as bioindi-cator of pollution in the Keclung River of Taiwan. Hydrobio-logia 397: 79–87.
Wu J.T. and Suen W.C. 1985. Change of algal associations in re-lation to water pollution. Bot. Bull. Acad. Sin. 26: 203–212. Wu J.T. and Yang M.J. 1996. Study on the relation of algae to the
water quality in Tsanwun River (III). In: Chou C.H. (ed.), Study on Environmental Changes and Resource Management: Tsan-wun River, Report Acad. Sin., Taipei, Taiwan, pp. 197–218. Zelinka M. and Marvan P. 1961. Zur Präzisierung der biologischen
Klassifikation der Reinheit fliessender Gewässer. Arch. Hydro-biol. 57: 389–407.