INTRODUCTION
Determination of population structure is essential information to understand resource recovery and to aid delineating and monitoring populations for fishery management (Roldan et al., 2000). The current marine population structure has been greatly influenced by Pleistocene ice ages (Avise, 2000). Marine organisms either became extinct or were forced to retreat into one or more refugial areas during ice ages. As the ice retreated, populations expanded and recolonized areas previously covered by ice.
Molecular genetic techniques offer the ability to identify and delineate fish stock structure where it may not be apparent from phenotypic or behavioural characteristics (Magoulas, 2005). Mitochondrial DNA (mtDNA) sequences are appropriate for assessing genetic population structure, phylogeography and in making inferences about underlying historical demographic processes that have shaped present-day structure (Avise, 2000). Since different regions in the mtDNA evolve at different rates, different regions of the mtDNA have been targeted for specific studies. The control region is the most variable region in 1 College of Liberal Education, Shu-Te University, Kaohsiung County 824, Taiwan.
2 Department of Nutrition and Health Science, Fooyin University. 151, Chinhsueh Rd., Ta-liao, Kaohsiung, Taiwan, R.O.C.
3 Research Center for Biodiversity, Academia Sinica, 128 Academia Road, Section 2, Nankang, Taipei 115, Taiwan R.O.C.
4 Institute of Oceanography, National Taiwan University, Taipei 106, Taiwan. * Corresponding author. E-mail: tdtzeng@mail.stu.edu.tw
Genetic Diversity and Population Expansion of the Common
Mackerel (
Scomber japonicus) off Taiwan
Tzong-Der Tzeng1*, Hsien-Lu Haung2, Daryi Wang3 and Shean-Ya Yeh4 (Received, August 1, 2007; Accepted, September 15, 2007)
ABSTRACT
Sequence analyses on the complete mitochondrial DNA control region were conducted to elucidate the population structure and population expansion of common mackerel (Scomber japonicus) off Taiwan. Three samples including 90 individuals were collected separately from waters off Keelung (PJ), Taitung (TT) and Linyan (LY). Control region sequences of one sample from Portugal (POR) were also sequenced and compared. Haplotype diversity (h) in the total data set was 97.10±0.8%, and the variations within samples ranged from 95.6 ± 2.7% (PJ) to 100% ± 4.5% (POR). Nucleotide diversity (π) in the total data set was 1.71 ± 0.18%, and variation within samples ranged from 1.06 ± 0.05% (PJ) to 1.11 ± 0.18% (POR). Analyses of a neighbor-joining tree of identified DNA haplotypes and FST values between samples, and an analysis of molecular variance revealed significant genetic differences between samples from Portugal and Taiwan, but no differentiation among the samples from Taiwan. These results suggested that the common mackerels off Taiwan belong to the single gene pool. Both mismatch distribution analysis and neutrality test suggested common mackerel off Taiwan had experienced population expansion since the late Pleistocene.
both vertebrates and invertebrates, making it the marker of choice for intraspecific studies including population studies (Hoelzel et
al., 1991). Control region sequence data
have shown adequate levels of variation in mackerels of the genus Scomber (Scoles et
al., 1998; Nesbo et al., 2000; Zardoya et al.,
2004).
The common mackerel (Scomber
japonicus) is one of the most abundant
and highly valued species off Taiwan. Morphological and allozyme data had been used to examine the population structure of common mackerels off Taiwan (Lin, 1998; Tzeng and Yeh, 2007). The results showed that there appear to be two morphologically distinguishable stocks of this species off Taiwan. However, the variation of morphological characters could be affected by genetic and environmental factors, so discrimination of populations based on morphological variation must be verified by genetic evidence to confirm that the variation reflects the true degree of reproductive isolation rather than environmental isolation (Pepin and Carr, 1992). The objective of this study is to examine the differences of the complete mtDNA control region sequences to elucidate the population structure and historical demography of common mackerel off Taiwan.
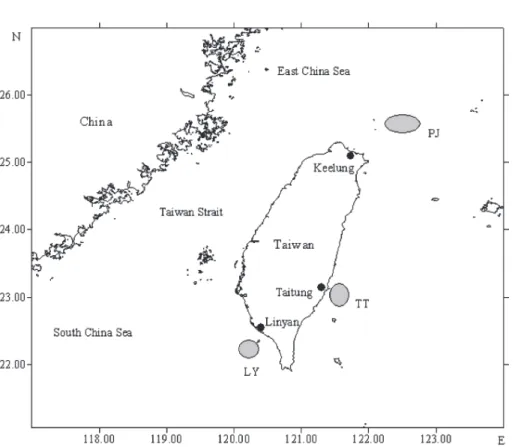
MATERIALS AND METHODS Three samples including 90 individuals were collected from waters off Keelung
(PJ), Taitung (TT) and Linyan (LY) (Table 1 and Fig. 1). An additional sample of 10 individuals was collected from the adjacent waters of Portugal (POR). Specimens were frozen immediately and stored at -75oC until DNA was extracted.
Total DNA was extracted from muscle tissue using a standard DNA proteinase
K digestion/phenol-chloroform extraction
procedure. The complete control region was amplified using the primers L-pro (5’ -TACCCCAAACTCCCAAAGCTA-3’) and H-12Sr (5’-GCGGATACTTGCATGTGTA-3’ ), which bind to the tRNApro and 12Sr RNA gene, respectively. Thermal cycling was performed in a GeneAmp 2400 thermal cycler (Perkin-Elmer Corp.) and PCR conditions consisted of 39 cycles of denaturation (95oC, 50 seconds), annealing (50oC, 1 minute), and extension (72oC, 1.5 minutes). An initial denaturation step (95oC, 5 minutes) and a final extension holding (72oC, 10 minutes) were included in the first and last cycles, respectively. Amplified DNA was separated through electrophoresis on 1.5% agarose gel and purified with the Gene Clean II kit (BIO101). The sequencing reactions of the PCR products were analyzed using an Applied Biosystems Prism 377 automated sequencer.
DNA sequences were aligned with the sequence of Scomber scombrus (Accession number in GenBank: AB120717) using the PILEUP program in GCG (Genetics Computer Group, version 7.0; Devereux
et al., 1991). Phylogenetic relationships
Table 1. Sampling area and its code, sample size, haplotype diversity (h), sequence diversity
(π) and Fu’s Fs of Scomber japonicus.
Sampling area Area Code Sample Size h ± s.d (Number of haplotypes/
Individuals sequenced) π ± s.d Fu’s Fs. Waters off Keelung PJ 30 0.956 ± 0.027 (22/30) 0.0106 ± 0.0005 -6.998** Waters off Taitung TT 30 0.970 ± 0.018 (22/30) 0.0103 ± 0.0005 -7.249** Waters off Linyan LY 30 0.975 ± 0.017 (23/30) 0.0104 ± 0.0007 -8.663** pooled Taiwan samples 90 0.964 ± 0.010 (54/90) 0.0103 ± 0.0003 -33.921** Portugal (42-43° N; 8-9°W) POR 10 1.000 ± 0.045 (10/10) 0.0111 ± 0.0018 -3.581* Total 100 0.9710 ± 0.0080 (64/100) 0.0171 ± 0.0018 -30.1340** * p < 0.05, ** p < 0.01.
between hapotypes were determined with Kimura 2-parameter distance model using the Neighbor-Joining method in MEGA 3 (Kumar et al., 2004). The reliability of the reconstructed clades was tested by bootstrapping with 1000 replicates. Haplotype diversity (h) and the nucleotide diversity (π) (Nei, 1987) in each sample were calculated using the program ARLEQUIN Version 3.01 (Excoffier et al., 2005). Genetic divergence among samples was tested with the FST statistic by using ARLEQUIN, and the statistical significance of estimates was determined with a permutation test.
An analysis of molecular variance (AMOVA) implemented in ARLEQUIN was also performed to examine to test the geographic divisions among samples. The significant of these Φ statistics is evaluated by 1000 random permutations of sequences among samples. Different groupings of samples were suggested by (1) FST statistics between samples, and (2) Neighbor-joining
tree of haplotypes.
To check for the deviations from neutrality, Fu’s Fs statistical test (Fu, 1997) was carried out to assess evidence for population expansion using ARLEQUIN. Historical demographic expansions were also investigated by examination of frequency distributions of pair-wise differences between sequences (mismatch distribution) (Rogers and Harpending, 1992) with ARLEQUIN. Rough dates of population expansion were estimated with the formula T = τ /2 u (Rogers and Harpending, 1992), where T = time since expansion, τ is expansion time, and 2u =μ (mutation rate) × generation time × number of bases sequenced.
RESULT
The DNA analyses were based on the complete control region sequence (864~866 bps) obtained from 100 individuals. One hundred and four polymorphic sites, including Fig. 1. The common mackerel (Scomber japonicus) sampling areas off Taiwan.
44 singletons, 60 parsimoniously informative sites, and 4 gaps sites were detected; 64% of the total polymorphic sites appeared in a 1-400 bp sequence of the 5’-strand.
Sixty-four haplotypes were identified from 100 individual mtDNAs sequenced. Haplotype No.4 was the most common one, found in 11 individuals; 6 specimens were from the PJ, three from the TT, and two from the LY samples. Haplotype Nos. 2 and 8 were also found in each sample from Taiwan. A total of 56 haplotypes were unique to one specimen. Haplotype diversity (h) in the total data set was 97.10 ± 0.8%, and the variations within samples ranged from 95.6±2.7% (PJ) to 100% ± 4.5% (POR). Nucleotide diversity (π) in the total data set was 1.71 ± 0.18%, and variation within samples ranged from 1.06 ± 0.05% (PJ) to 1.11 ± 0.18% (POR) (Table 1).
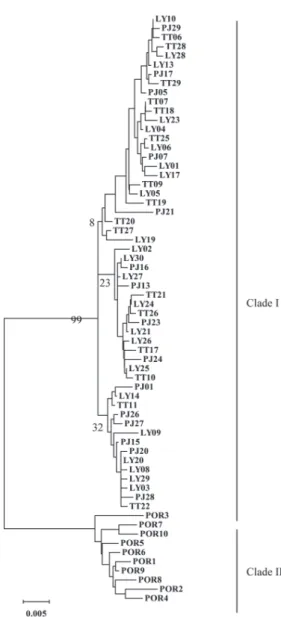
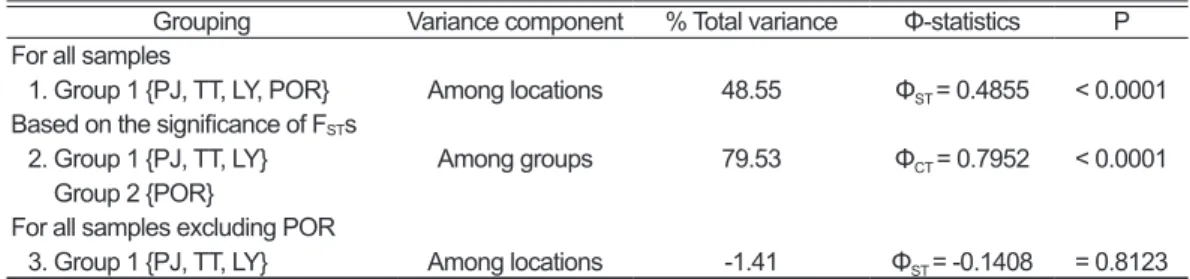
The neighbor-joining tree of 64 haplotypes is shown in Fig. 2. Two clades were found. Haplotypes in the first clade were all from Taiwan, while haplotypes in the second clade were all from POR. The FST values among the four samples are shown in Table 2; there were significant genetic differences between the POR and the Taiwan samples, but there were no differences among three samples from Taiwan. The results of AMOVA also revealed significant genetic differences between the POR and the other samples, but showed no differences among samples from Taiwan (Table 3).
Significant negative values of the Fu’s Fs tests were obtained in all sampling areas (Table 1). The mismatch distributions of the Scomber japonicus for total samples were clearly bimodal (Fig. 3A): one mode
corresponded to the number of differences between the two clades, and the other to differences among individuals within clades. The mismatch of clade 1 was unimodal, matching the expected distributions under the sudden expansion model (Fig. 3B). For the adjacent waters of Taiwan, τ, the estimated time since population expansion, was 12.859/2u generations (95% confidence Fig. 2. Neighbour-joining tree from kimura-2
para-meters distances among 64 mitochondrial control region haplotypes of Scomber japonicus. Abbreviations for samples are defined in Table 1.
Table 2. Pairwise fixation indices (FST) between four Scomber japonicus samples. Abbreviations for samples are defined in Table 1.
PJ TT LY
TT -0.0159ns
LY -0.0131ns -0.0369ns
POR 0.7657** 0.7599** 0.7615** ** p < 0.01, ns = not significant
Table 3. The results of AMOVA. Abbreviations for samples are defined in Table 1.
Grouping Variance component % Total variance Φ-statistics P For all samples
1. Group 1 {PJ, TT, LY, POR} Among locations 48.55 ΦST = 0.4855 < 0.0001 Based on the significance of FSTs
2. Group 1 {PJ, TT, LY}
Group 2 {POR} Among groups 79.53 ΦCT = 0.7952 < 0.0001
For all samples excluding POR
3. Group 1 {PJ, TT, LY} Among locations -1.41 ΦST = -0.1408 = 0.8123
Fig. 3. The observed pairwise difference, and expected mismatch distributions under the sudden expansion model of the control region haplotypes in Scomber japonicus. A: total samples; B: samples from Taiwan.
intervals = 6.361 and 17.731). There are very large discrepancies in estimations of divergence rates for the control region of teleosts. In the absence of a specific calibrated mutation rate for the control region of common mackerel two very distinct rates were assumed: 3.6% and 18.6% divergence per site per million years (Domingues et
al., 2005; Donaldson and Wilson, 1999,
respectively). As female and male common mackerel mature at different sizes and ages (between 1 and 3 years, respectively, Love, 1996) a generation time of 2 years was used. The common mackerel population expansion was estimated to have been taken place approximately between 206,709 (95% C.I. 102,253-285,027) and 40,008 years ago (95% C.I. 19,791-55,166).
DISCUSSION
Control region sequence analyses revealed significant genetic difference between the POR and the Taiwan samples. The result agrees with the significant genetic differences reported between common mackerel from the Atlantic and Pacific Ocean (Scoles et al., 1998). Among the samples from Taiwan, the results do not support genetic heterogeneity for the common mackerel around Taiwan. The common mackerel in the East China Sea and in the adjacent waters of Taiwan appear to belong to a single gene pool, and agree with a previous study (Scoles et al., 1998).
The neutrality of mtDNA control region mutations was rejected on the basis of Fu’s Fs statistical test (Table 1). This statistic is sensitive to factors such as population expansion which tend to drive the values of Fu’s Fs towards more negative value (Fauvlot
et al., 2003). Indeed, significant negative
value of the statistic in this study indicated that S. japonicus off Taiwan had experienced population expansion. The unimodel mismatch frequency distribution pattern based on the mtDNA sequence accorded well the predicted distribution under a model of population expansion (Fig. 3B).
The mitochondrial control region
sequences revealed high level of haplotypic diversity (0.971) and the low level of nucleotide diversity (0.017) that were similar to those found in the Mediterranean Sea (Zardoya et al., 2004) (h >0.98, π = 0.017). It has been proposed that marine fishes can be classified into four categories based on different combinations of small and large values for haplotypes diversity (h) and nucleotide diversity (π) of mtDNA sequences to interpret different scenarios of population history (Grant and Bowen, 1998). They indicated that fish with high h and low π, such as S. japonicus probably underwent population expansion after a period of low effective population size. Historical population expansions were also detected in S. japonicus population in Mediterranean Sea (Zardoya et al., 2004).
Past geological and climatic events have undoubtedly played a major pole in population expansion of common mackerel off Taiwan. Sea levels were 130-150 m lower than the present level in the East China Sea and 100-120 m lower in the South China Sea during the Last Glacial Maximum. Consequently, the entire Yellow Sea and Taiwan Strait were exposed, and the East China Sea was reduced into an elongated trough (Wang and Sun, 1994). The disappearance of habitat had restricted marine species to the relatively limited areas and caused the mixing among populations and reduced the genetic variation between populations (Benzie and Williams, 1997). Estimation of the time since population expansion of common mackerel in studied areas (19,791-55166 or 102,253-285,027 years before present), suggests consistency with a sea level rise since the late Pleistocene (1,600,000-10,000 years ago).
ACKNOWLEDGEMENTS
We would like to express appreciation to our staff, Demersal Research Center, Institute of Oceanography, National Taiwan University, for assistance in collecting samples.
REFERENCES
Avise, J. C. (2000). Phylogeography: the History and Formation of Species. Harvard University Press, Cambridge, MA.
Benzie, J. A. H. and S. T. Williams (1997). Genetic structure of giant clam (Tridacna
maxima) populations in the West Pacific is
not consistent with dispersal by present-day ocean currents. Evolution, 51: 768-783.
Devereux, J., P. Haeberli and P. Marquess (1991). Genetic Computer Group Manual, version 7.0. Madison, WI: University of Wisconsin. Domingues, V. S., G. Bucciarelli, V. C. Almada and
G. Bernardi (2005). Historical colonization and demography of the Mediterranean damselfish, Chromis chromis. Mol. Ecol., 13:
4051-4063.
Donaldson, K. A. and R. R. Wilson (1999). Amphi-Panamaic geminates of snook (Percoidei: Centropomidae) provide a calibration of the divergence rates in the mitochondrial DNA control region of fishes. Mol. Phylogenet.
Evol., 13: 208-213.
Excoffier, L., G. Laval and S. Schneider (2005). Arlequin ver. 3.0: an integrated softwere package for population genetics data analysis. Evol. Bioinform. Online, 1: 47-50.
Fauvlot, C., G. Bernardi and S. Planes (2003). Reductions in the mitochondrial DNA diversity of coral reef fish provide evidence of population bottlenecks resulting from Holocene sea-level change. Evolution, 57:
1571-1583.
Fu, Y. X. (1997). Statistical tests of neutrality of mutations against population growth, hitchhiking and background selection.
Genetics, 147: 915-925.
Grant, W. S. and B. W. Bowen (1998). Shallow population histories in deep evolutionary lineages of marine fishes: insights from sardines and anchovies and lessons for conservation. J. Hered., 89: 415-426.
Hoelzel, A. R., J. M. Hancock and G. A. Dover (1991). Evolution of the cetacean mitochondrial D-loop region. Mol. Biol. Evol.,
8: 475-493.
Kumar, S., K. Tamura and M. Nei (2004). MEGA3: Integrated software for Molecular Evolutionary Genetics Analysis and sequence alignment.
Brief Bioinform., 5: 150-163.
Lin, Y. Y. (1998). Population genetic structure of Scomber australasicus and Scomber
japonicus fisheries resources. Master thesis
of Institute of Oceanography, National Taiwan University, 59pp. (In Chinese with English abstract)
Love, M. (1996). Probably more than you want to know about the fishes of the Pacific coast. Really big press, Santa Barbara, California. Magoulas, A. (2005). Mitochondrial DNA. In Stock
identification methods-applications in fishery science (S. X. Cardrin, K. D. Friendland and
J. R. Waldman, eds.). Elsevier, San Diego, 311-330.
Nei, M. (1987). Molecular evolutionary genetics. Columbia Univ. Press, New York.
Nesbo, C. L., E. K. Rueness, S. A. Iversen, D. W. Skagen and B. S. Jakobsen (2000). Phylogeography and population history of Atlantic mackerel (Scomber scomber L.): a genealogical approach reveals genetic structuring among the eastern Atlantic stocks.
Proc. R. Soc. London, Ser. B, 267: 281-292.
Pepin, P. and S. M. Carr (1992). Morphological, meristic, and genetic analysis of stock structure in juvenile Atlantic cod (Gadus
morhua) from the Newfoundland shelf. Can. J. Fish. Aquat. Sci., 52: 1924-1933.
Rogers, A. R. and H. Harpending (1992). Popula-tion growth makes waves in the distribuPopula-tion of pairwise genetic differences. Mol. Ecol. Evol.,
9: 552-569.
Roldan, M. I., R. G. Perrotta, M. Cortey and C. Pla (2000). Molecular and morphologic approaches to discrimination of variability patterns in chub mackerel, Scomber
japonicus. J. Exp. Mar. Biol. Ecol., 253: 63-74.
Scoles, D. R., B. B. Collette and J. E. Graves (1998). Global phylogeography of mackerels of the genus Scomber. Fish. Bull., 96: 823-
842.
Tzeng, T. D. and S. Y. Yeh (2007). Morphological variation in the common mackerel (Scomber
japonicus) off Taiwan. J. Fish. Soc. Taiwan, 34(2): 199-207.
Wang, P. and X. Sun (1994). Last glacial maximum in China: comparison between land and sea. Catena, 23: 341-353.
Zardoya, R., R. Castilho, C. Grande, L. Favre-Krey, S. Caetano, S. Marcato, G. Kery and T. Patarnello (2004). Differential population
structuring of two closely related fish species, the mackerel (Scomber scomber) and the chub mackerel (Scomber japonicus), in the
Mediterranean Sea. Mol. Ecol., 13: 1785-
台灣附近海域產白腹鯖
(Scomber japonicus)之
遺傳變異與族群擴張
曾宗德1*.黃憲祿2.王達益3.葉顯椏4 (2007年8月1日收件;2007年9月15日接受) 利用粒線體DNA之控制區(D-loop)序列變異研析台灣附近海域產白腹鯖之族群遺傳結 構及族群擴張。本研究採集來自基隆(PJ)、台東(TT)及林園(LY)等外海之三個族群樣本, 共90隻個體進行分析。另,採集葡萄牙(POR)沿岸之一族群樣本供比較。全部樣本之基因 型岐異度(Haplotype diversity, h)為97.10 ± 0.8%,變異範圍從PJ之95.6 ± 2.7%到POR之 100% ± 4.5%;全部樣本之核苷酸岐異度 (Nucleotide diversity, π)為1.71 ± 0.18%,變異範 圍從PJ之1.06 ± 0.05%到POR之1.11 ± 0.18%。單基因型之neighbor-joining樹、族群樣本間之FST值及分子變方等分析顯示葡萄牙及台灣之三族群樣本間皆有顯著之遺傳差異,但
台灣之三族群樣本間並無顯著差異;此結果指出台灣附近之白腹鯖屬於單一基因庫。中性 檢定(Neutrality test)及mismatch distribution等分析顯示台灣附近之白腹鯖從晚近更新世 (late Pleistocene)起即經歷族群擴張。 關鍵詞:白腹鯖,粒線體控制區,族群結構,族群擴張。 1 私立樹德科技大學 通識教育學院 自然科學組,高雄縣 824,台灣。 2 私立輔英科技大學 保健營養系,高雄縣 151,台灣 3 中央研究院 生物多樣性中心,南港 台北 115,台灣 4 國立台灣大學 海洋研究所,台北 106,台灣 * 通訊作者