Controls of spectral shape and dispersion mismatch for
high-resolution optical coherence tomography
I-Jen Hsu
a, Chia-Wei Sun
a, Chih-Wei Lu
a, C. C. Yang
a, Chun-Ping Chiang
b, Chii-Wann Lin
ca
Graduate Institute of Electro-Optical Engineering and Department of Electrical Engineering,
National Taiwan University, 1, Roosevelt Road, Sec. 4, Taipei, Taiwan, R.O.C.
(phone) 886-2-23657624
(fax) 886-2-23652637 (e-mail) [email protected]
b
Department of Dentistry, National Taiwan University, Taipei, Taiwan, R.O.C.
c
Graduate Institute of Bioengineering, National Taiwan University, Taipei, Taiwan, R.O.C.
ABSTRACT
The longitudinal resolution of an optical coherence tomography (OCT) system is conventionally defined as the full-width at half maximum (FWHM) of the interference fringe envelope, which depends on the center wavelength as well as the spectral width of the light source. One can obtain an FWHM of an interference fringe envelope larger or smaller than that resulted from a Gaussian spectrum of the same spectral FWHM when the light source spectrum is non-Gaussian distributed. In this paper, we first study the dependencies of OCT resolution on the spectral shape and dispersion mismatch with numerical simulations. We will demonstrate the capability of enhancing the longitudinal resolution of an OCT system with a proper control of spectral distribution and dispersion mismatch. Then, in experiments we built an OCT system with its light source generated from nonlinear optics effects of 12-fsec Ti:sapphire laser pulses in an optical fiber. With proper control of dispersion mismatch between the sample and reference arms, the FWHM of the interference fringe envelope was smaller than that of a Gaussian spectrum with the same spectral FWHM by a factor of two. Furthermore, the side lobes were suppressed with a process algorithm to significantly improve the longitudinal resolution.
Keywords: optical coherence tomography, spectral shape, dispersion mismatch, process algorithm, spatial resolution
1. INTRODUCTION
Optical coherence tomography (OCT) is a non-invasive tomographic technique for biomedical applications1. It has the advantages of high resolution and high sensitivity. The resolution is one of the main issues in OCT systems. The lateral resolution of an OCT system is determined by the spot size of incident beam on the sample. It depends on the diameter of incident beam before the focusing lens and its focal length. On the other hand, the longitudinal or axial resolution of an OCT system is determined by the width of the autocorrelation function. It is actually the coherence length of the used light source and depends on the center wavelength and spectral width of the light source. Many efforts have been done to improve the longitudinal resolution of OCT systems by use of various broadband light sources2-4. In experiments, the longitudinal resolution of an OCT system is usually defined as the full-width at half maximum (FWHM) of the interference fringe envelope obtained from a single reflection. With such a definition, the longitudinal resolution of an OCT system depends only on the center wavelength and spectral width of the light source if the spectrum of the light source is Gaussian distributed and the dispersion is perfectly balanced between the sample and reference arms. However, if the spectrum of the light source is non-Gaussian distributed, the FWHM of the interference fringe envelope may be larger or smaller than that in the case of a Gaussian spectrum. The shape of the autocorrelation function depends on the spectral distribution as well as the dispersion mismatch between the sample and reference arms. If the spectral shape and dispersion mismatch can be properly controlled, it is possible to obtain an autocorrelation function smaller than that in the Gaussian case.
In general, the width of autocorrelation function is inversely proportional to the width of spectrum of the applied light source. For a light source of non-Gaussian spectrum, the shape of autocorrelation function will vary with the spectral distribution. In this case, the FWHM of the autocorrelation function will also be different even if the FWHM
of the spectrum remains unchanged. Therefore, a spectral shaping method through the use of a spectral filter for the light source of an OCT system is capable to broaden the effective spectral width and enhance the longitudinal resolution although there usually exists side lobes or tails in the interference fringe envelope. On the other hand, the dispersion mismatch may also induce side-lobe effects, but the FWHM of the autocorrelation function is probable to be further reduced when the dispersion mismatch is properly controlled. The side lobes will induce artifacts in OCT images that will reduce their quality. However, it can be effectively suppressed with some retrieval algorithms that we have developed for processing the image data. In this paper, we simulate the results of interference fringe envelopes with spectral shaping method, and demonstrate the use of a retrieval algorithm combined with proper controls of spectral shape and dispersion mismatch leads to OCT images of high resolution without serious artifacts caused by the side lobes.
2. NUMERICAL SIMULATION
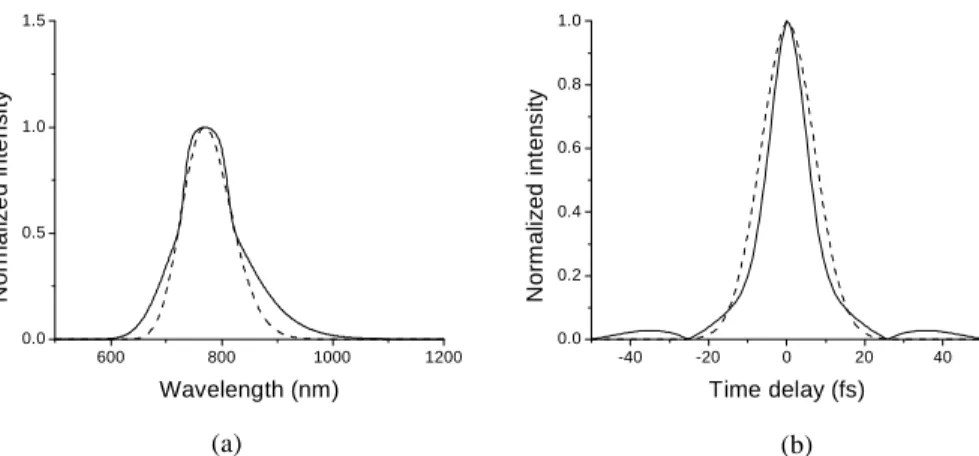
We have simulated different spectral shapes to obtain the corresponding autocorrelation functions. For a spectral distribution similar to that of the light source we applied in our experiments, Fig. 1(a) shows an assumed spectrum (solid line) of the form
(1) and a Gaussian spectrum (dashed line) with the same FWHM,
(2) where ω0=2.45x10¹⁵ Hz, ∆ω1=3x10¹⁴ Hz, ∆ω2=51/6x1014 Hz, and ∆ω3=1.98x10¹⁴ Hz. Fig. 1(b) shows the corresponding
autocorrelation functions as the dispersion is balanced. The FWHM of the spectra is 103.77 nm and the FWHM of the autocorrelation function in the Gaussian case is 2.52 µm. However, that corresponding to the spectrum of Eq. (1) is only 1.8 µm. These results show the possibility of obtaining an autocorrelation function with its FWHM smaller than that in the case of Gaussian spectrum although slight side lobes are generated.
600 800 1000 1200 0.0 0.5 1.0 1.5 N o rmal iz e d i n te ns it y Wavelength (nm) -40 -20 0 20 40 0.0 0.2 0.4 0.6 0.8 1.0 N o rm al iz ed i n tens it y Time delay (fs)
Figure 1: (a) An assumed spectrum (solid line) and a Gaussian spectrum with the same FWHM (dashed line). (b) The corresponding autocorrelation functions.
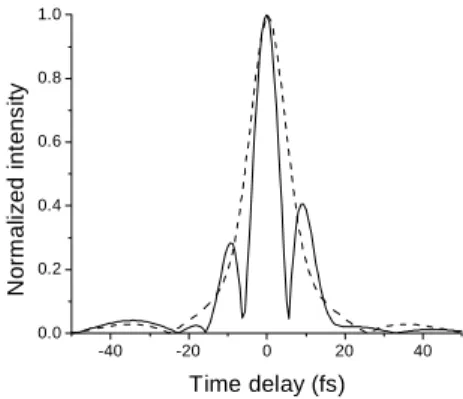
When dispersion mismatch exists, the FWHM of the autocorrelation function is usually enlarged and the side-lobe effect becomes more significant. However, in the non-Gaussian case, when a suitable dispersion mismatch is added, it is possible to further reduce the width of the autocorrelation function. Fig. 2 shows the results when a dispersion mismatch ∆φ=aω2, where a=6x10-30sec2, is added. Here, we assume the spectrum given in Eq. (1). The dashed line shows the case when the dispersion is balanced. The solid line shows the case when dispersion mismatch is added to the system. The FWHM of the autocorrelation is now about 1.06 µm. Hence, we have numerically demonstrated that
6 2 0 2 1 0
2
|
)
(
|
2 ∆ − − ∆ − −+
=
ω ω ω ω ω ωω
e
e
S
,
2 3 0 2|
)
(
|
∆ − −=
ω ω ωω
e
S
,
(a) (b)the FWHM of the autocorrelation function could be reduced by a factor of more than two when the spectral shape and dispersion mismatch were properly controlled.
-40 -20 0 20 40 0.0 0.2 0.4 0.6 0.8 1.0 N o rm al iz ed i n tens it y Time delay (fs)
Figure 2: The autocorrelation function corresponding to the assumed spectrum when the dispersion is balanced (dashed line) and the autocorrelation function when dispersion mismatch is added to the system (solid line).
To demonstrate the capability of spectral shaping method through proper spectral filter to improve the longitudinal resolution of an OCT system, we have simulated several kinds of spectral filters applied for a Gaussian distributed spectrum. Fig. 3(a) shows a Gaussian spectrum (dashed line) and the corresponding spectrum (solid line) after one of the spectral filters of the form showed in Fig. 3(b). Fig.3(c) shows the corresponding interference fringe envelopes of the original spectrum (dashed line) and the filtered spectrum (solid line). The FWHM of the interference fringe envelope is reduced by 20.5% after the spectral shaping. This result approves the practicability of spectral shaping method to improve the longitudinal resolution of an OCT system.
Figure 3: (a) A Gaussian spectrum (dashed line) and the filtered spectrum (solid line). (b) The spectral distribution of the filter. (c) The corresponding interference fringe envelopes of the Gaussian spectrum (dashed line) and the filtered spectrum (solid line).
3. EXPERIMENTS
In experiments, we built an OCT system with its light source generated from nonlinear optics effects of 12-fsec Ti:sapphire laser pulses in an optical fiber. The spectral shape can be controlled with a spectral filter composed of a grating pair and a special designed attenuating filter or simply varying the coupled power into the fiber. In order to reduce the side-lobe or tail effects, we have developed a retrieval algorithm for data processing. Fig. 4(a) shows an interference fringe envelope obtained from the reflection of a glass surface. The dashed line shows the profile of raw data and the solid line shows the processed result. One can see that the fringe tails are tremendously suppressed and the FWHM of the signal profile is reduced after process. Fig. 4(b) and (c) show the two-dimensional OCT images of a
glass slide before and after process with the same grayscale, respectively. The image quality was significantly improved through the enhancements of the longitudinal resolution and the image contrast.
Figure 4: (a) Interference fringe envelope obtained from the reflection of a glass surface. The solid line shows the processed data in which the side lobes are tremendously suppressed from the raw data (dashed line). (b) OCT image of a glass slide before process. (c) OCT image of a glass slide after process.
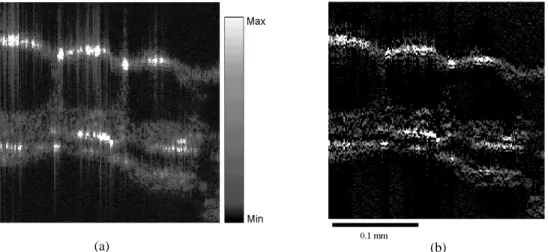
We also applied the OCT system to scan various biological samples. With the source spectral FWHM around 80 nm (centered at 800 nm), Fig. 5(a) shows an OCT image of onion cells without the process of the retrieval algorithm. The spiky features originate from the effects of side lobes in the autocorrelation function. After the process with the retrieval algorithm, the OCT image quality becomes much improved, as shown in Fig. 5(b).
Fig. 5 (a) An OCT image of onion cells before process.(b) The OCT image after process with the ret rieval algorithm. 4. CONCLUTIONS
In summary, we have studied the dependence of OCT resolution on the spectral shape and dispersion mismatch with numerical simulations. We also demonstrated the capability of enhancing the longitudinal resolution of an OCT system with a proper control of spectral distribution and dispersion mismatch in experiments. The side lobes in the interference fringe envelope were suppressed with a process algorithm to significantly improve the longitudinal resolution.
ACKNOWLEDGMENTS (a)
(b)
(c)
This research was supported by National Health Research Institute, The Republic of China, under the grants of NHRI-GT-EX89E819L.
REFERENCES
1. D. Huang, E. A. Swanson, C. P. Lin, J. S. Schuman, W. G. Stinson, W. Chang, M. R. Hee, T. Flotte, K. Gregory, C. A. Puliafito, and J. G. Fugimoto, “Optical coherence tomography,” Science 254, 1178-1181 (1991).
2. C. E. Saxer, J. F. de Boer, B. H. Park, Y. Zhao, Z. Chen, and J. S. Nelson, “High-speed fiber-based polarization-sensitive optical coherence tomography of in vivo human skin,” Opt. Lett. 25, 1355-1357 (2000). 3. W. Drexler, U. Morgner, F. X. Kärtner, C. Pitris, S. A. Boppart, X. D. Li, E. P. Ippen, and J. G. Fujimoto, “In vivo
ultrahigh-resolution optical coherence tomography,” Opt. Lett. 24, 1221-1223 (1999).
4. I. Hartl, X. D. Li, C. Chudoba, R. K. Ghanta, T. H. Ko, J. G. Fujimoto, J. K. Ranka, and R. S. Windeler, “Ultrahigh-resolution optical coherence tomography using continuum generation in an air-silica microstructure optical fiber,” Opt. Lett. 26, 608-610 (2001).