Corresponding author: Chiz-Tzung Chang, MD, PhD, Department of Nephrology, China Medical University Hospital, No. 2, Yude Rd., Taichung City, Taiwan, R.O.C. Tel: +886-4-22052121, Fax: +886-4-22076863, E-mail: [email protected]
Received: June 29, 2011; Revised: August 8, 2011; Accepted: November 1, 2011.
Comparison of Hematological Parameters of
Uremic Patients with
β-Thalassemia Receiving
Peritoneal Dialysis and Hemodialysis
Su-Ying Wang1, 2, Tai-Te Wu3, Kai-Ling Yang1, 4, Wen-Chi Ju5, Chi-Chia Liang1, 2, Chiz-Tzung Chang1, 2, and Chiu-Ching Huang1, 2
1
Division of Nephrology, China Medical University Hospital, Taichung 2
College of Medicine, China Medical University, Taichung 3
Chuan-An Dialysis Center, Taoyuan 4
Department of Public Health, China Medical University, Taichung 5
Division of Hematology and Oncology, Chang Gung Memorial Hospital, Taoyuan Taiwan, Republic of China
Abstract
BACKGROUND: Thalassemia patients with concomitant uremia usually have serious anemia problems and need more erythropoietin (EPO) therapy. Uremic thalassemia patients receiving peritoneal dialysis however are restricted to a monthly EPO use of less than 20,000 IU, but there was no such restriction for patients receiving hemodialysis. The purpose of this study is to compare the hematological parameters between uremic thalassemia patients undergoing peritoneal dialysis (PD) and hemodialysis (HD).
METHODS: Uremic patients with hemoglobin electrophoresis-confirmed β-thalassemia undergoing
HD or PD were included in the study. Monthly blood test results were all recorded. History of blood transfusion in units, intravenous iron supply, and EPO dosage were all calculated.
RESULTS: The hematocrit and hemoglobin levels of β-thalassemic PD patients were slightly lower
than those of HD patients (PD vs. HD; 28.5 ± 0.6 vs. 30.5 ± 0.5%, P = 0.048 and 8.9 ± 0.1 vs. 9.7 ± 0.2 g/dL,
P = 0.041). Moreover, PD patients also had lower serum ferritin (195.1 ± 19.4 vs. 756.8 ± 81.3 ng/mL,
P < 0.001, PD vs. HD) and monthly EPO dosage (19,291 ± 274 vs. 25,259 ± 1,962 IU/month, PD vs. HD,
P = 0.028).
CONCLUSION: Uremic β-thalassemia patients receiving PD had lower hemoglobin and hematocrit
levels than their HD counterparts under the policy of EPO use restriction. Adjustment in EPO restrictions toward PD patients with thalassemia is required to alleviate the anemia seen in these patients.
KEY WORDS: thalassemia, uremia, EPO, peritoneal dialysis, hemodialysis Original Article
Introduction
Normal hemoglobin is composed of two α and two β globin chains. Thalassemia is an inherited genetic disorder of hemoglobin structural abnormality. The decrease in α globin synthesis results in α-thalassemia while the decrease in β globin formation leads to β-thalassemia. The abnormal hemoglobin makes red blood cells fragile and smaller than those of normal
people and can be easily removed by reticuloendothelial systems (1). Patients with thalassemia are characterized by microcytic anemia of different degrees (2). The degree of anemia is largely determined by the gene af-fected. For example, β-thalassemias are secondary to hemoglobin β gene mutations and can be classified as thalassemia major, intermediate, or minor. Patients with thalassemia major, if left untreated, usually died before the age of 20. Patients with thalassemia
inter-mediate or minor may need frequent blood transfusions (3).
Uremic patients often have problems of anemia secondary to erythropoietin (EPO) deficiency, inade-quate EPO use, EPO resistance, malnutrition, shortened erythrocyte survival or blood loss of various causes (4, 5). Thalassemia may be one of the causes of EPO resistance in dialysis patients (6). Uremic patients with concomitant thalassemia often suffer severe anemia. These patients may need more EPO and frequent blood transfusions to maintain the hematocrit at a certain level (7-9).
Different dialysis modalities, which may affect dialysis adequacy, can have effects on the hematologi-cal parameters. Adequacy of dialysis can affect EPO responsiveness (10). Complications associated with inadequate dialysis such as protein malnutrition can affect hemoglobin formation (11). Dialysis-related protein and blood loss can also cause anemia (12). Secondary hyperparathyroidism frequently seen in dialysis patients can also lead to anemia (13). Peritoneal dialysis (PD) or hemodialysis (HD) may affect these factors. There is, however, no study to date that com-pares the effects of PD or HD on anemia of thalassemic uremic patients. Both β-thalassemia and uremia are common diseases in Taiwan, and patients receiving either PD or HD with concomitant β-thalassemia are not uncommon (14, 15). PD patients are allowed to use only 20,000 IU EPO per month as stated in the guidelines but such restriction of EPO use does not apply to HD patients. The present study compared the hematological parameters between β-thalassemic PD patients and their HD counterparts.
Materials and Methods
We retrospectively reviewed the hematological parameters of our current PD or HD patients from the day they started chronic dialysis to April 2011. Patients with low mean red blood cell corpuscle volume (MCV) (< 80 fL/cell) were screened for the possibility of thalassemia. β-thalassemia was diagnosed by hematologists via hemoglobin electrophoresis. Patients with microcytosis and blood hemoglobin A2 of 3.5% or more were compatible with the diagnosis (16). Patients’ complete blood count and electrolytes tests, biochemical tests (including liver function tests), and renal function tests were obtained every month. Blood iron, total iron binding capacity (TIBC), and ferritin were checked every three months. Patients’ chest X-ray films were taken every six months and the cardio-thoracic ratios were measured. All red blood cells transfused to patients were recorded in unit.
EPO was administered via subcutaneous route under the following hospital rules. Hemodialysis patients with hematocrit (Hct) 33-36% were given
2,000 IU once weekly; patients with Hct 30-33% 2,000 IU, twice weekly; and patients with Hct < 30% 2,000 IU, trice weekly. EPO dosage was increased up to 5,000 IU twice weekly in patients who failed to reach the target set by rules. The EPO use in PD patients was restricted to a dose ≤ 20,000 IU/month for patients with Hct < 36%. Patients with symp-tomatic anemia after EPO treatment might receive blood transfusion. Intravenous iron infusion was given to patients with serum ferritin < 300 ng/mL and Hct < 33%. One gram of iron in 10 separated doses
via intravenous route was given to HD patients and
600 mg of iron in two 300 mg/month doses was given to PD patients after a negative allergy test for iron. Patients admitted to hospital due to any medical problems were recorded. All parameters measured were recorded in means ± SEM. The t-test was employed to compare the differences in numerical parameters between PD and HD patients and Chi-Square test was applied for categorical variants; a P < 0.05 was deemed statistically significant. All the statistical analyses were performed using SPSS software.
Results
Epidemiological Parameters of PD and HD Patients
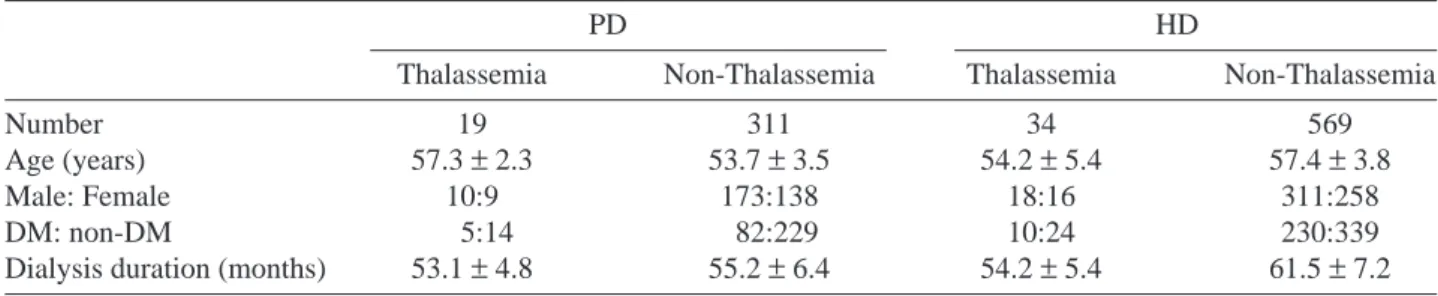
There were 330 PD and 603 HD patients in-cluded in the study. Among the 330 PD patients, 19 had β-thalassemia; and among the 603 HD patients, 34 did. The mean age of β-thalassemic PD patients (57.3 ± 2.3 years old) was not statistically different from that of the HD group (57.7 ± 2.4 years old) (P = 0.923). There were 10 male and 9 female in the PD group, and there were 18 male and 16 female in the HD group. No difference in sex distribution was ob-served between these two groups (P = 0.697). Among the 19 β-thalassemic PD patients, 5 had DM; and among the 34 β-thalassemic HD patients, 10 did. The ratio of DM between these two groups showed no significantly statistical difference (P = 0.810). The mean duration of dialysis of the β-thalassemic PD group (53.1 ± 4.8 months) was also not significantly different from that of the β-thalassemic HD group (54.2 ± 5.4 months) (P = 0.871) (Table 1).
Hematological Parameters of β-Thalassemic and
Non-β-Thalassemic Dialysis Patients
The hemoglobin level of β-thalassemic PD patients was significantly lower than that of non- β-thalassemic PD patients (8.9 ± 0.1 vs. 9.9 ± 0.1 g/dL,
P = 0.039); while the hemoglobin level of β-thalassemic
HD patients was not significantly lower than that of non-β-thalassemic HD patients (9.7 ± 0.2 vs. 10.4 ±
0.3 g/dL, P = 0.052) (Fig. 1a). Similarly, the Hct level of β-thalassemic PD patients was statistically lower than that of non-β-thalassemic PD patients (28.5 ± 0.6% vs. 30.9 ± 0.6%, P = 0.035); while the Hct level of β-thalassemic HD patients was not significantly
lower than that of non-β-thalassemic HD patients (30.5 ± 0.5% vs. 31.4 ± 0.9%, P = 0.053) (Fig. 1b). The serum ferritin of β-thalassemic PD patients was significantly lower that of non-β-thalassemic PD patients (191.5 ± 9.4 vs. 334.8 ± 18.7 ng/mL, P < 0.01);
Table 1. Epidemiological parameters of thalassemic and non-thalassemic peritoneal dialysis (PD) and hemodialysis (HD) patients
PD HD
Thalassemia Non-Thalassemia Thalassemia Non-Thalassemia
Number 19 311 34 569
Age (years) 57.3 ± 2.3 53.7 ± 3.5 54.2 ± 5.4 57.4 ± 3.8
Male: Female 10:9 173:138 18:16 311:258
DM: non-DM 5:14 82:229 10:24 230:339
Dialysis duration (months) 53.1 ± 4.8 55.2 ± 6.4 54.2 ± 5.4 61.5 ± 7.2
Fig. 1. Hematological parameters of the thalassemic and non-thalassemic dialysis patients. PD-TH represents thalassemic peritoneal dialysis patients; PD-nTH represents non-thalassemic peritoneal dialysis patients; HD-TH represents thalassemic hemodialysis patients; HD-nTH represents non-thalassemic hemodialysis patients. *represents P < 0.05, **P < 0.01, and ***P < 0.001.
12 10 8 6 4 2 0 PD-TH PD-nTH HD-TH HD-nTH ∗ 8.9 ± 0.1 9.9 ± 0.1 9.7 ± 0.2 10.4 ± 0.3 a. 40 35 30 25 20 15 10 5 0 PD-TH PD-nTH HD-TH HD-nTH ∗ 28.5 ± 0.6 30.9 ± 0.6 30.5 ± 0.5 31.4 ± 0.9 b. 1000 900 800 700 600 500 400 300 200 100 0 PD-TH PD-nTH HD-TH HD-nTH ∗∗ ∗∗∗ 195.1 ± 15.4 334.8 ± 18.7 756.8 ± 81.3 407.2 ± 12.5 c. 30000 25000 20000 15000 10000 5000 0 PD-TH PD-nTH HD-TH HD-nTH ∗ ∗∗∗ 19291 ± 274 17128 ± 187 25259 ± 1962 18462 ± 337 d. Hemoglobin (g/dL) Hematocr it (%) Seur m F err itin (ng/mL)
while the serum ferritin of β-thalassemic HD patients was significantly higher than that of non-β-thalassemic HD patients (776.8 ± 8.4 vs. 407.2 ± 12.5 ng/mL, P < 0.001) (Fig. 1c). The mean monthly EPO dose used was higher in β-thalassemic PD than in non-β-thalassemic PD patients (19,291 ± 274 vs. 17,128 ± 187, P < 0.05). The same trend was seen in HD patients with EPO dose higher in thalassemic HD than in non-thalassemic HD patients (25,259 ± 1962, vs. 18,462 ± 337, P < 0.001) (Fig. 1d).
Hematological Parameters of β-Thalassemic PD and HD
Patients
There was no difference in MCV, a marker of thalassemia, between PD and HD patients (68.7 ± 1.0 fL vs. 69.3 ± 0.7 fL, PD vs. HD, P = 0.700). The Hct level of β-thalassemic PD patients was statisti-cally different from that of β-thalassemic HD patients (28.5 ± 0.6% vs. 30.5 ± 0.5%, PD vs. HD, P = 0.048). Similarly, the hemoglobin level of β-thalassemic PD patients was significantly lower than that of β-thalassemic HD patients (8.9 ± 0.1 g/dL vs. 9.7 ± 0.2 g/dL, PD vs. HD, P = 0.041). Serum iron (Fe), the main ingredient of hemoglobin, was also lower in the PD group (27.1 ± 1.4 μg/L vs. 78.2 ± 4.6 μg/L, PD vs. HD, P < 0.001). However, there was no significant difference in Fe/TIBC, an indicator of iron availability, between these two groups (28.4 ± 1.1% vs. 33.5 ± 1.9%, PD vs. HD, P = 0.075). The indicator of iron store, serum ferritin, was lower in PD than HD pa-tients (195.1 ± 19.4 ng/mL vs. 756.8 ± 81.3 ng/mL,
P < 0.001). The serum platelet was lower in the HD
group (205.4 × 10³± 17.2 × 10³/μL vs. 152.7 × 10³±
13.7 × 10³/μL, PD vs. HD, P = 0.022) (Table 2).
Biochemical Parameters of β-Thalassemic PD and HD
Patients
Serum biochemical parameters were compared between β-thalassmic PD and HD patients. There was no difference in serum albumin, an indicator of nutrition and dialysis adequacy, between these two groups (3.8 ± 0.1 g/dL vs. 3.7 ± 0.1 g/dL, P = 0.339). Another parameter of nutritional status, serum cho-lesterol, also showed no difference (166.8 ± 25.4 mg/ dL vs. 165.3 ± 7.4 mg/dL, PD vs. HD, P = 0773). There was no difference in serum uric acid (7.3 ± 0.2 mg/dL
vs. 7.0 ± 0.1 mg/dL, PD vs. HD, P = 0.250), BUN
(59.8 ± 5.9 mg/dL vs. 60.4 ± 1.7 mg/dL, PD vs. HD) and serum creatinine (9.1 ± 1.0 mg/dL vs. 10.4 ± 0.3 mg/dL, PD vs. HD) between these two groups. The PD group had lower GPT, a marker of liver function, (7.6 ± 0.6 U/L vs. 19.2 ± 1.8 U/L, PD vs. HD, P < 0.001) and serum potassium level (3.7 ± 0.2 vs. meq/L vs. 5.0 ± 0.2 meq/L, PD vs. HD, P < 0.001) (Table 2).
EPO Dosage and Blood Transfusion Frequency of Thalassemic Dialysis Patients
Both EPO dose and blood transfusion frequency will affect the hematological parameters. The monthly EPO dosage was lower in the PD group than in the HD group (19,291 ± 274 IU/month vs. 25,259 ± 1,962 IU/ month, PD vs. HD, P = 0.028). The blood transfusion frequency was the same in these two groups (0.27 ± 0.08 vs. 0.63 ± 0.30 U/person-month, PD vs. HD, P = 0.263). The dose of intravenous iron supply, a factor
Table 2. Hematological and biochemical parameters of thalassemic uremia patients receiving peritoneal dialysis (PD) or hemodialysis (HD) PD HD P value Hematocrit (%) 28.5± 0.6 30.5± 0.5 0.048 Hemoglobin (g/dL) 8.9± 0.1 9.7± 0.2 0.041 MCV (fL) 68.7± 1.0 69.3± 0.7 0.700 Platelet (× 103/μL) 205.4± 17.2 152.7± 13.7 0.022 Fe (μg/L) 27.1± 1.4 78.2± 4.6 < 0.001 Fe/TIBC (%) 28.4± 1.1 33.5± 1.9 0.075 Ferritin (ng/mL) 195.1± 19.4 756.8± 81.3 < 0.001 Albumin (g/dL) 3.8± 0.1 3.7± 0.1 0.339 Cholesterol (mg/dL) 166.8± 25.4 165.3± 7.4 0.773 BUN (mg/dL) 59.8± 5.9 60.4± 1.7 0.910 Creatinine (mg/dL) 9.1± 1.0 10.4± 0.3 0.145 Uric acid (mg/dL) 7.3± 0.2 7.0± 0.1 0.250 GPT (U/L) 7.6± 0.6 19.2± 1.8 < 0.001 Potassium (meq/L) 3.7± 0.2 5.0± 0.2 < 0.001
affecting MCV, Hct and Hb, was lower for PD patients (28.6 ± 0.6 mg/patient-month vs. 63.2 ± 6.4 mg/ patient-month, PD vs. HD, P < 0.001) (Table 3).
Effects of Anemia on Cardiothoracic Ratio and Hospitalization Rate
The severity of anemia may have effects on cardiomegaly and hospitalization rate of the dialysis patients. The cardio-thoracic ratio (CTR) of thalas-semic PD patients was essentially larger than that of non-thalassemic PD patients (0.491 ± 0.118 vs. 0.432 ± 0.120, P < 0.01). The CTR of thalassemic HD patients was larger than that of non-thalassemic HD patients (0.479 ± 0.113 vs. 0.524 ± 0.119, P = 0.021). The CTR was lower in β-thalassemic PD patients than in
β-thalassemic HD patients (0.491 ± 0.118 vs. 0.524 ±
0.119, PD vs. HD, P = 0.017). There was, however, no difference in hospital admission frequency between these two groups (0.83 ± 0.15 vs. 0.90 ± 0.32 patient-year, PD vs. HD, P = 0.843) (Table 3).
Discussion
Our data showed that, with a higher EPO dose,
β-thalassemia patients receiving HD can maintain a
hematocrit or hemoglobin level equivalent to that of non-thalassemic HD patients. β-thalassemia PD patients, with a dose limitation of EPO use, cannot keep a hematocrit or hemoglobin level similar to those of non-thalassemic PD patients. Uremia dialysis patients with β-thalassemia receiving PD had blood hemoglobin and hematocrit levels lower than those of β-thalassemic uremia patients receiving HD. The serum ferritin of β-thalassemic PD patients was also lower than that of β-thalassemic HD patients. Inade-quate EPO and iron supply resulted in more severe anemia seen in PD patients (10, 17).
The formation of hemoglobin depends on patients’ nutritional status and drive for synthesis. Amino acid and iron are the main ingredients for hemoglobin synthesis and EPO provides the drive for RBC formation (18). There was no significant
dif-ference in albumin, an indicator of nutritional status, and amino acid supply between these two groups (19). Nutritional status, which may not be different between these two groups, can also be implicated by comparing serum cholesterol levels (5). Iron and EPO supply can also play a crucial role in the deter-mination of hemoglobin in these patients. The Fe/ TIBC was not significantly lower in the PD group. The reason behind this remains unclear. We think that vitamin C infusion, which may enhance iron availability and be frequently used in HD patients but rarely used in PD patients, may partly explain this phenomenon (20). Ferritin as an indicator of iron store was higher in β-thalassemia HD than PD patients. The mean serum ferritin level of our PD patients was only 195.1 ± 19.4 ng/mL, a level lower than the range of 200 to 800 ng/mL as suggested in the guidelines (21). The serum ferritin level can be determined by blood transfusion frequency and iron supply. There was no difference in blood transfusion frequency between PD and HD patients in our study; hence, we consider iron supply, especially parenteral iron supply, the decisive factor of ferritin level in these patients. HD patients with vascular access and three visits to hospital each week can easily receive intravenous supply. The convenient access helps explain the dif-ference in ferritin level. Given the lower parenteral iron supply than the recommended dose, our β-thalassemia PD patients can maintain the serum ferritin of 195.1 ± 19.4 ng/mL, a level close to the lower limit of 200 to 800 ng/mL suggested (21, 22). We cannot exclude the possibility that functional iron deficiency might be responsible, at least partially, for the more severe anemia seen in PD patients. Tarng et al. had reported that correcting iron deficiency can improve erythropoisis in thalassemia dialysis patients (9). It may be imperative to be more aggressive in the treat-ment of iron deficiency in PD patients.
Blood loss in dialysis patients can also affect the anemia of dialysis patients. Blood loss may be more prominent in HD than PD patients. The thalas-semic red blood cells are more fragile than normal blood cells. It is likely for β-thalassemic RBC to be
Table 3. EPO dose, iron dose, blood transfusion frequency and outcome of hematological parameters between uremic thalassemia patients receiving peritoneal dialysis (PD) and those receiving hemodialysis (HD)
PD HD P value
EPO dose (IU/month) 19,291± 274 25,259± 1,962 0.028
Fe infusion (mg/patient-month) 28.6± 0.6 63.2± 6.4 < 0.001 Blood transfusion (U/person-month) 0.27± 0.08 0.63± 0.30 0.263
CTR (%) 0.491± 0.118 0.524± 0.119 0.017
Admission rate (patient-year) 0.191± 0.047 0.199± 0.060 0.843 CTR: cardio-thoracic ratio.
disrupted while passing through the hemodialysis dialyzer (23). This inference can be seen from the uric acid data. Uric acid level was frequently higher in PD than HD patients (24). However, there was no difference in serum uric acid level between β-thalassemia PD and HD patients in our study. Once destroyed by artificial kidney, the fragile RBC of HD patients may release uric acid, thus explaining partly the results observed. LDH is another useful indicator of RBC destruction (25). Unfortunately, we did not routinely perform LDH test in our chronic dialysis patients. The second cause of greater blood loss in the HD group may be the frequent phlebotomy for different kinds of blood tests, which is a common practice for HD patients. These frequent blood examinations may cause more blood loss. Since nutritional status, iron supply, and blood transfusion frequency may not make the anemia of β-thalassemia HD or PD different in our study and blood loss may be more prominent in the HD group, we attribute the higher Hct and hemo-globin levels in HD patients than in PD patients to difference in EPO use. Both EPO dose and EPO re-sponsiveness can have impacts on anemia. Dialysis adequacy will affect EPO responsiveness. As it is hard to compare the dialysis adequacy between PD and HD, we used uremia marker BUN and creatinine for comparison. There is no direct evidence of dif-ferences in dialysis adequacy or EPO responsiveness between these two patient groups. By ruling out all the factors discussed above, we think that it is the difference in EPO dose between β-thalassemia HD and PD patients that results in the discrepancies in Hct and Hb levels. Our data were compatible with the results of Tarng et al. that erythropoisis can be aug-mented in thalassemia dialysis patients if EPO dosage can be increased (9).
The consequences of different EPO and iron responses cannot directly be reflected in clinical con-ditions. The CTR was slightly lower in the thalassemic PD group. The reason why CTR is lower in our thalassemia PD group is not clear. PD has long been deemed better than HD in the preservation of hemo-dynamic stability. Chung et al. compared PD and HD patients and found more serious oxidative stress and vascular dysfunction in HD patients (26). Vascular dysfunction may lead to more severe diastolic dys-function seen in HD patients (27). Tian et al. found lower prevalence of left ventricular hypertrophy in Chinese PD than HD patients (28). In our study patients, non-thalassemic PD also had a significantly lower CT ratio lower compared with their non-thalassemic HD counterparts. Probably, the same mechanism can be applied to thalassemia patients. This might help explain the CTR difference. On the other hand, there was no difference in hospital ad-mission rates between these two groups.
It is a common practice for dialysis facilities to be reluctant to give a larger dose of EPO to patients (18). The dosing variance can affect the Hct and hemoglobin levels of ESRD patients. Neither group in our study met the Hct level suggested in the guide-lines. β-thalassemia uremia patients, especially those who receive PD therapy, may need a higher dosage of EPO to correct their anemia. The limitation of our study is the small sample size; more cases are needed for further investigation (7).
References
1. Sankaran VG, Nathan DG. Thalassemia: an overview of 50 years of clinical research. Hematol/Oncol Clin North Am 24: 1005-1020, 2010.
2. Musallam KM, Taher AT. Iron-chelating therapy for transfusional iron overload. N Engl J Med 364: 1476, 2010, author reply 1477. 3. Galanello R, Origa R. β-thalassemia. Orphanet J Rare Dis 5: 11
Review, 2010.
4. Bernhardt WM, Wiesener MS, Scigalla P, Chou J, Schmieder RE, Gunzler V, et al. Inhibition of prolyl hydroxylases increases erythropoietin production in ESRD. J Am Soc Nephrol 21: 2151-2156, 2010.
5. Livio M, Gotti E, Marchesi D, Mecca G, Remuzzi G, de Gaetano G. Uraemic bleeding: role of anaemia and beneficial effect of red cell transfusions. Lancet 2: 1013-1015, 1982.
6. Lai KN, Wong KC, Li PK, Lui SF. Use of recombinant erythropoi-etin in thalassemic patients on dialysis. Am J Kidney Dis 19: 239-245, 1992.
7. Kagan A, Sinay-Trieman L, Bar-Khayim Y. Recombinant human erythropoietin for anaemia in thalassaemia minor patients on dialysis.
Nephrol Dial Transplant 10: 2375-2376, 1995.
8. Di Iorio B, De Nicola L, Bellizzi V, Minutolo R, Zamboli P, Rubino R, et al. Efficacy of erythropoietin on dialysis in patients with β thalassemia minor. Blood Purif 22: 453-460, 2004.
9. Tarng DC, Huang TP, Chen TW, Fan CY, Chang JG. Resistance to recombinant human erythropoietin treatment in thalassaemic patients on chronic haemodialysis: a real clinical entity? Nephrol
Dial Transplant 11: 1893-1895, 1996.
10. Gaweda AE, Goldsmith LJ, Brier ME, Aronoff GR. Iron, inflam-mation, dialysis adequacy, nutritional status, and hyperparathyroid-ism modify erythropoietic response. Clin J Am Soc Nephrol 5: 576-581, 2010.
11. Wu TT, Chang CY, Hsu WM, Wang IK, Hsu CH, Cheng SH, et al. Nutritional status of vegetarian on maintenance hemodialysis.
Nephrology (Carlton) 16: 852-857, 2011.
12. Thomson PC, Morris ST, Mactier RA. The effect of heparinized catheter lock solutions on systemic anticoagulation in hemodialysis patients. Clin Nephrol 75: 212-217, 2010.
13. Smith LB, Fadrowski JJ, Howe CJ, Fivush BA, Neu AM, Furth SL. Secondary hyperparathyroidism and anemia in children treated by hemodialysis. Am J Kidney Dis 55: 326-334, 2009.
14. Liu SC, Peng CT, Lin TH, Wang SJ, Shih MC, Tien N, et al. Mo-lecular lesion frequency of hemoglobin gene disorders in Taiwan.
Hemoglobin 35: 228-236, 2011.
15. Hung CC, Chang CT, Lee CC, Chen KH, Yu CC, Wu CH, et al. Prognostic predictors of technique and patient survival in elderly Southeast Asian patients undergoing continuous ambulatory pertoneal dialysis. Int J Clin Pract 63: 254-260, 2009.
16. Harrington AM, Ward PC, Kroft SH. Iron deficiency anemia, β-thalassemia minor, and anemia of chronic disease: a morphologic reappraisal. Am J Clin Pathol 129: 466-471, 2008.
hy-poresponsiveness: from iron deficiency to iron overload. Kidney Int 69: S107-S118, 1999.
18. Garibotto G, Sofia A, Saffioti S, Bonanni A, Mannucci I, Verzola D. Amino acid and protein metabolism in the human kidney and in patients with chronic kidney disease. Clin Nutr 29: 424-433, 2010. 19. Chen KH, Wu CH, Hsu CW, Chen YM, Weng SM, Yang CW, et
al. Protein nutrition index as a function of patient survival rate in
peritoneal dialysis. Kidney Blood Press Res 33: 174-180, 2010. 20. Tarng DC, Huang TP, Wei YH. Erythropoietin and iron: the role
of ascorbic acid. Nephrol Dial Transplant 16 (suppl 5): 35-39, 2001.
21. Kapoian T. Challenge of effectively using erythropoiesis-stimulat-ing agents and intravenous iron. Am J Kidney Dis 52: S21-S28, 2008.
22. Durand PY. Iron therapy: is it different with peritoneal dialysis compared to haemodialysis? Nephrol Ther 2 (suppl 5): S341-S346, 2006.
23. Ibrahim FF, Ghannam MM, Ali FM. Effect of dialysis on erythro-cyte membrane of chronically hemodialyzed patients. Renal failure
24: 779-790, 2002.
24. Mekki K, Taleb W, Bouzidi N, Kaddous A, Bouchenak M. Effect of hemodialysis and peritoneal dialysis on redox status in chronic renal failure patients: a comparative study. Lipids Health Dis 9: 93-98, 2010.
25. Bolwell B, Pohlman B, Kalaycio M, Wise K, Goormastic M, Andresen S. LDH elevation after autologous stem cell transplan-tation. Bone Marrow Transplantation 24: 53-55, 1999. 26. Chung AW, Yang HH, Kim JM, Sigrist MK, Brin G, Chum E, et al.
Arterial stiffness and functional properties in chronic kidney dis-ease patients on different dialysis modalities: an exploratory study.
Nephrol Dial Transplant 25: 4031-4041, 2010.
27. Chang JH, Yoon SJ, Han SH, Shin SK, Jeon DW, Yang YJ, et al. The impact of dialysis modality on arterial stiffness in patients with end-stage renal disease. Renal Failure 32: 947-953, 2010. 28. Tian JP, Wang T, Wang H, Cheng LT, Tian XK, Lindholm B, et al.
The prevalence of left ventricular hypertrophy in Chinese hemodi-alysis patients is higher than that in peritoneal dihemodi-alysis patients.