Medical Service System Using
Computer Simulation
SYI SU, S
CD* AND CHUNG-LIANG SHIH, MD†
Emergency medical service (EMS) policy makers must seek to achieve maximum effectiveness with finite resources.This research establishes an EMS computer simulation model using eM-Plant software.The simu-lation model is based on Taipei city’s EMS system with input data from prehospital care records from December 2000; it manipulates resource allocation levels and rates of idle errands.Presently, EMS ambulance utilization is about 8.78%. On average, 20.89 minutes are required to transport a patient to the hospital.Computer simulations showed that reducing the number of ambulances to one at each of the 36 response units increases the utilization rate to 15.47% but does not compromise the current service quality level.Thus, ambulance utilization improves, times of patients waiting for pre-hospital care and arrival at hospitals are only slightly affected, and considerable cost savings result.This study provides a research methodology and suggests specific policy direc-tions for resource allocation in EMS.Limiting the number of ambulances to one per response unit reduces costs, increases efficiency, and yet maintains the same operational pattern of medical service.(Am J Emerg Med 2002;20:627-634.Copyright 2002, Elsevier Science (USA).All rights reserved.)
Prehospital care is an important aspect of modern medical care, and much literature has shown that effective pre-hospital care can reduce patient mortality and morbidity.1-7 However, what is considered the best emergency medical service (EMS) pattern is still controversial. Individual coun-tries or regions have developed their own specific EMS models based on their own resource availability and speci-ficity. This is especially true for developing countries, which must establish complex ambulance transportation systems to provide emergency medical services. However, regardless of the kind of EMSsystem, the expense is considerable.1-4,7-9 Therefore, developing and providing emergency medical services that are both cost-effective and meet a population’s needs under limited resources are pri-mary concerns of many policy makers.
The United States has been developing its emergency medical services system since 1970. In 1973, the Emer-gency Medical Services Act defined emerEmer-gency medical services as “[a] system that provides for the arrangement of personnel, facilities, and equipment for the effective and coordinated delivery of health care services under emer-gency conditions and that is administered by a public or non-profit entity with authority and the resources to provide effective administration of the system.”10The government of Taiwan enacted ambulance management rules in 1981 and began to develop the system for EMS. In 1995, the government enacted the Emergency Medical Services Law, which became the basis for prehospital emergency care.
This current research proposes a management system for emergency medical services, using computer simulation to evaluate the performance of the EMSsystem and explore alternatives for reducing costs while providing better or equal quality of care.
MATERIALS AND METHODS Taiwan’s EMS System
Most areas of Taiwan use a tier rescue model that is staffed mainly with level 1 or level 2 emergency medical technicians (EMTs) and is generally administered by the fire department. Level 2 EMTs receive more advanced training than level 1 EMTs and are used in the 2-tier model. (The 2-tier model dispatches 2 ambulances to the scene: one providing basic life support and one providing advanced life support. The 1-tier model dispatches one ambulance rescue team providing basic life support.) Taiwan’s predominant model is the 1-tier EMSmodel, which is mainly staffed with basic EMTs (level 1). Services provided by EMTs cover emergency management and care of automobile accidents, traumas, critical diseases, and accidental poisonings. Taipei’s Emergency Medical Services System
This research takes Taipei’s emergency medical services system (TEMSS) as its subject, seeking possible alterna-tives to improve the system’s effectiveness and to limit costs. Taipei’s EMTs system has 36 response units (named in this paper as subgroups EMS1-EMS36) located along with 36 fire departments. Each response unit has available 1 to 3 staffed ambulances (ambulance rescue teams). One headquarters assigns incoming rescue calls to the nearest of 2 to 4 response units in 12 administrative area. The steps and methods are as follows.
Clarification of the flowchart. To clarify the exact pro-cess of the prehospital emergency medical care system in Taipei (Fig 1), interviews were conducted with individuals From the *Institute of Health Care Organization Administration,
School of Public Health, National Taiwan University, Taipei, Taiwan, and the †Department of Emergency Medicine, National Taiwan University Hospital, Taipei, Taiwan.
Supported by the National Science Council (NSC 89-2314-B-002-383).
Manuscript received April 29, 2002, returned February 2, 2002, revision received April 29, 2002, accepted May 7, 2002.
Address reprint requests to Syi Su, ScD, Institute of Health Care Organization Administration, National Taiwan University, Room 1512, No 1, Sec 1, Jen Ai Road, Taipei, Taiwan, ROC. E-mail: [email protected]
Key Words: Reallocation, computer simulation, emergency
med-ical service, prehospital care, utilization.
Copyright 2002, Elsevier Science (USA). All rights reserved. 0735-6757/02/2007-0012$35.00/0
doi:10.1053/ajem.2002.35453
familiar with the TEMSS. The flowchart progression is as follows. When the headquarters gets calls for help, the dispatcher notifies generally the nearest of 36 emergency service response units to perform the rescue based on the incident’s address proximity. Every emergency service re-sponse unit is staffed with 1 to 3 rescue teams and is available for service 24 hours a day. Each rescue team is composed of 1 ambulance and 2 EMTs. After the EMTs arrive at the scene and perform primary assessment and treatment, they transport the patient to the closest hospital that can provide further emergency care. The emergency medical service team is dismissed after it has reported the patient’s situation to the hospital’s medical personnel. It then returns to the subgroup and waits for its next mission. If a rescue event occurs in a response unit’s area of respon-sibility and 1 team is already in service, another rescue team must take this mission. If there is no other team available in the response unit, the headquarters asks the next nearest response unit to take the mission. Because this study ex-plores the appropriateness of resource allocation for the TEMSS, the relatively small number of 2 simultaneous calls for help is neglected.
Data collection and analysis. The following rescue records of the TEMSS dated from December 1, 2000 to December 31, 2000 were collected for analysis: (1) the name of response unit performing the rescue; (2) classifi-cation of the rescue cause (eg, trauma, nontrauma illness, or prehospital cardiac arrest); and (3) the times for the follow-ing rescue segments: dispatch headquarters notified, sub-group unit notified, ambulance rescue team responds, am-bulance rescue team arrives at the scene, amam-bulance rescue team leaves the scene, ambulance rescue team arrives at the hospital, ambulance rescue team leaves the hospital, and ambulance rescue team is back in service.11
For each rescue, the time interval between consecutive segments was counted to determine the following:
prepara-tion time (PRT, interval between the time the headquarters gets the rescue call, notifies a nearest subgroup and the time it responds by sending an ambulance rescue team), response time (RT, interval between the time the ambulance rescue team responds and the time it arrives at the scene), processing time (PCT, interval between the time the am-bulance rescue team arrives at the scene and the time it leaves the scene), transport time (TT, interval between the time the ambulance rescue team leaves the scene and arrives at the hospital), caring time (CT, interval between the time the ambulance rescue team arrives at the hospital and the time it leaves the hospital), and departure time (DT, interval between the time the ambulance rescue team leaves the hospital and the time it is back in service).
BestFit software12 (Palisades Corp, Newfield, NY) was used to choose the best-fitting distributions of the above times. The distributions of each activity time were fed into the corresponding time distribution of the simulation model. The time interval between 2 successive, reported rescue event calls (event interarrival time) was counted and best fitted with the software again using data from the Taipei municipal fire department’s dispatching records that showed the times the rescue calls were reported, the names of the response units were dispatched, and the final destinations (either the names of the destination hospitals or idle errands [ambulance departure from the subgroup and return to the subgroup without fulfilling a rescue, ie, false alarms]). Thereafter, the following input parameters were fed into the simulation model: (1) the events’ interarrival time distribu-tion, (2) the go-errand (total number of errands: true plus idle) proportion, and (3) the idle-errand proportion of each response unit.
Simulation model design. The fourth generation simu-lation software, eM-Plant (Tecnomatix Technologies, Ltd, Neu-Isenburg, Germany),13was used to develop the simu-lation model. This system is an entirely object-oriented program using object-oriented graphics and integrated mod-eling for simulating and visualizing systems and business processes. Its users have the following advantages: (1) they can build hierarchical models either bottom up or top down, (2) they can reuse submodels or parts of models stored in the engineering database, (3) they can use several modeling techniques for different levels to verify the results of each level and dramatically increase productivity, (4) they can centralize and define changes of all relevant system param-eters in 1 table, and (5) they can integrate in real time with other software.
The subject’s system flowchart is shown in Fig 1. Its input data were distributions of event interarrival time, preparation time, response time, processing time, transport time, caring time, and departure time or idle-errand time. The outcome variables were the utilization rates of each ambulance rescue team, each subgroup, and the patient’s rescue waiting time (time between the rescue event report call and the rescue team’s arrival. It includes preparation time plus response time). Different random number seeds were used to replicate the event 100 times to derive the outcome variables.
Model validation and verification. Model validation was performed by showing the model to emergency medical service specialists, who judged if the model ran the same way as the real-world system. Verification was conducted
by simulation programming specialists, who determined if the program logic and language were correctly written. More important, the established simulation model was val-idated by comparing the system’s empirical data with the simulation-derived data for the total number of events re-ported, processing (treatment) time at the scene, turnaround times, and total number of idle errands. (Turnaround time was counted as the time interval between ambulance depar-ture from the subgroup unit and return to the unit. The time interval between rescue call and ambulance dispatch was so short [a few seconds] that it could be neglected.)
Analysis of simulation results and proposed alternatives.
After making changes in the simulation parameters, the researcher ran the simulation model for 168 hours (1 week), using different random number seeds to replicate the out-comes 100 times and using the same method as the original
model. Then differences in the resulting alternatives were checked. Each alternative was analyzed for any marginal benefits it would contribute, and alternatives were sug-gested.
The attempted alternatives were as follows:
1. Reduction in the number of ambulance rescue teams per subgroup: based on the utilization rate of each ambulance rescue team and response unit, the source allocation level may be modified. If a re-sponse unit utilization rate is low, personnel staffing and the number of ambulances may be reduced in-dividually or in combination to determine their effect on the utilization rate without increasing the patients’ rescue waiting time.
2. Modification of the idle errand rate: idle errands (errands not resulting in reaching patients at the event
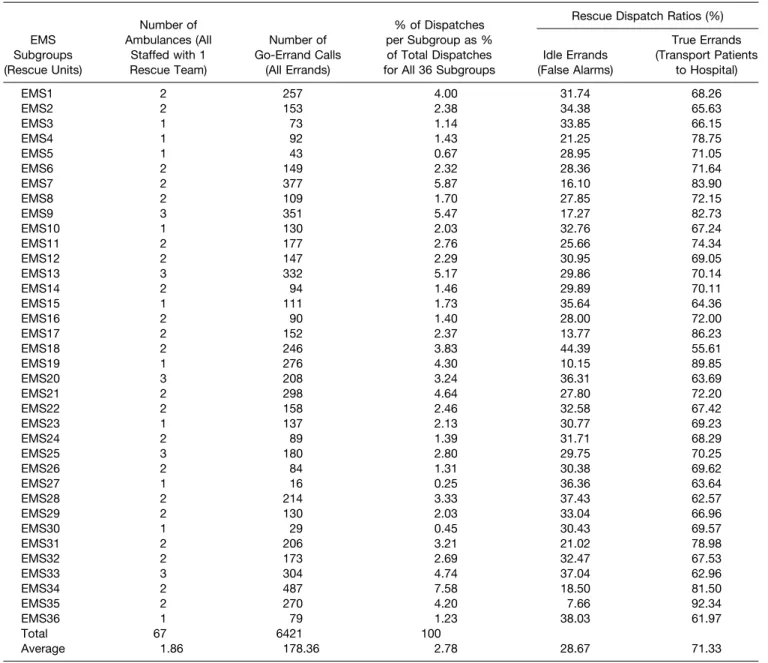
TABLE 1. Taipei’s EMS System Subgroups: Number of Ambulance Rescue Teams, Number of Errands, Percent of Dispatches, and Idle/True Errand Ratio
EMS Subgroups (Rescue Units) Number of Ambulances (All Staffed with 1 Rescue Team) Number of Go-Errand Calls (All Errands) % of Dispatches per Subgroup as % of Total Dispatches for All 36 Subgroups
Rescue Dispatch Ratios (%)
Idle Errands (False Alarms) True Errands (Transport Patients to Hospital) EMS1 2 257 4.00 31.74 68.26 EMS2 2 153 2.38 34.38 65.63 EMS3 1 73 1.14 33.85 66.15 EMS4 1 92 1.43 21.25 78.75 EMS5 1 43 0.67 28.95 71.05 EMS6 2 149 2.32 28.36 71.64 EMS7 2 377 5.87 16.10 83.90 EMS8 2 109 1.70 27.85 72.15 EMS9 3 351 5.47 17.27 82.73 EMS10 1 130 2.03 32.76 67.24 EMS11 2 177 2.76 25.66 74.34 EMS12 2 147 2.29 30.95 69.05 EMS13 3 332 5.17 29.86 70.14 EMS14 2 94 1.46 29.89 70.11 EMS15 1 111 1.73 35.64 64.36 EMS16 2 90 1.40 28.00 72.00 EMS17 2 152 2.37 13.77 86.23 EMS18 2 246 3.83 44.39 55.61 EMS19 1 276 4.30 10.15 89.85 EMS20 3 208 3.24 36.31 63.69 EMS21 2 298 4.64 27.80 72.20 EMS22 2 158 2.46 32.58 67.42 EMS23 1 137 2.13 30.77 69.23 EMS24 2 89 1.39 31.71 68.29 EMS25 3 180 2.80 29.75 70.25 EMS26 2 84 1.31 30.38 69.62 EMS27 1 16 0.25 36.36 63.64 EMS28 2 214 3.33 37.43 62.57 EMS29 2 130 2.03 33.04 66.96 EMS30 1 29 0.45 30.43 69.57 EMS31 2 206 3.21 21.02 78.98 EMS32 2 173 2.69 32.47 67.53 EMS33 3 304 4.74 37.04 62.96 EMS34 2 487 7.58 18.50 81.50 EMS35 2 270 4.20 7.66 92.34 EMS36 1 79 1.23 38.03 61.97 Total 67 6421 100 Average 1.86 178.36 2.78 28.67 71.33
scenes and transporting them to the hospitals) may result from false alarms; fraudulent or prank calls; vague, insufficient descriptions given to the dis-patcher to resulting in not reaching the patient; too long a response time for patients to wait for the ambulance to arrive, and the possibility of having no ambulance available for rescue—a situation that did not occur in our empirical nor simulated data. These problems can be reduced through public education, flowchart improvement, and personnel training. Therefore, decreasing the number of idle errands can produce a measurable benefit. The resulting contri-butions may be projected by a sensitivity analysis of the model. For example, adjusting the individual subgroup’s idle errand rate by 10%, 20%, and 30% while other conditions remain unchanged can deter-mine the utilization rate of corresponding strategy alternatives.
These comparisons were conducted by using the Stu-dent’s t-test with the␣ level set at 0.05.
RESULTS
This research collected data for the TEMSS from the Taipei Municipal Fire Department from December 1 to December 31, 2000. Among 6,421 records, 28.67% (1,509 records) were idle errands. Personnel staffing, number of ambulances, and dispatch information for each response unit are shown in Table 1. Data for each time period during
the overall rescue episode were collected to obtain the optimal probability distribution using probability-fitting software. The time EMTs spent at scene may differ because of various causes of rescue, especially because prehospital cardiac arrest (dead on arrival) patients usually take signif-icantly longer than others (P⬍ .05). Moreover, in response units 1, 9, 23, 31, and 32, processing time at the scene for
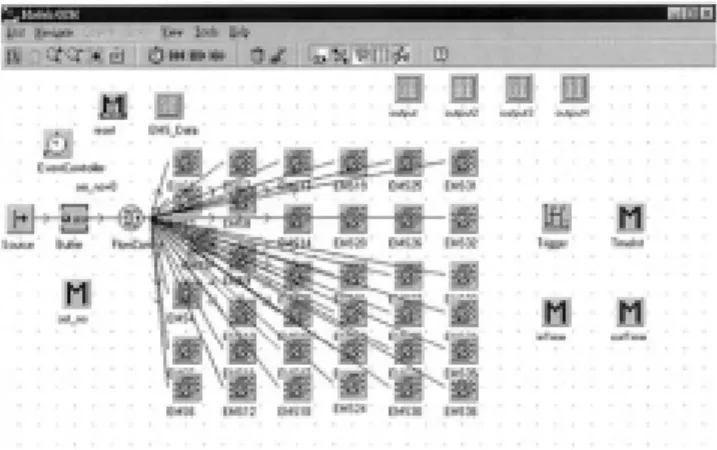
FIGURE 2. The main system simulation model of the TEMSS (1-tier rescue system). Using the trigger object, entities (event calls) are created in the source object. By specifying the arrival time of 3 shifts, the TimeInt object (method) is activated next. The entities are then sent to the buffer object to await entering the flow control object. The Flow Control object contains the probability distribution of dispatches across the 36 EMSsubgroups (units). Based on this probability distribution, each entity is sent to its corresponding dispatcher, 1 of the EMSsubgroups (EMS1 to EMS36). The Event Controller object coordinates and synchro-nizes the different events taking place during a simulation. The reset object (method) reactivates a simulation method. Output, output2, output3, and output4 are the tables that carry the simula-tion output data. The EMS_Data object is the basic input data for simulation modeling. Set_no object (method) counts the number of entities (event calls) and their sequence. inTime and outTime gather the start and end time of each rescue event segment.
FIGURE 3. Simulation model of 1 of 36 subsystems of the TEMSS (1-tier rescue system). This is an operational display example of 1 subgroup from the main system shown in Figure 1. The subsystem describes the flowchart of each subgroup (unit). Entities (rescue event calls) enter the subsystem through the in object (interface), then go to the Buffer1 object, which activates the Buf_inTime object, a method to calculate the waiting time while the next process is still in busy. The Buffer1 object also activates the load object, a method to move the entity onto the pallete object (ambulance) and to load the pallete object (ambu-lance) from the Buffer object to the PRT object. Based on the probability distribution of actual and idle errands carried in the FlowControl object, the entities (rescue event calls) go to process of RT-PCT1-TT-CT-DT or IE, respectively. They then enter the unload_port object, which activates the unload object, a method to unload entities to the out_port object and to move the pallete objects (ambulances) back to the Buffer object. The out_port object also activates the avgltspan object, a method to calculate the average life span for each entity. The entities then terminate in the Drain object, which ends the subgroup’s operation. The inTime, outTime method gathers the start time and end time of each entity (rescue event call). The PRT object (preparation time) is the interval between the time the subgroup unit is notified and the time it responds by sending an ambulance rescue team. The RT object (response time) is the interval between the time the ambulance rescue team responds and the time it arrives at the scene. The PCT1 object (processing time) is the interval between the time the ambulance rescue team arrives at the scene and treats the patient and the time it leaves the scene. The TT object (transport time) is the interval between the time the ambulance rescue team leaves the scene and arrives at the hospital. The CT object (caring time) is the interval between the time the ambulance rescue team arrives at the hospital and the time it leaves the hospital. The DT object (depar-ture time) is the interval between the time the ambulance rescue team leaves the hospital and the time it is back in service for the next rescue call. The IE object (idle errand time) is the interval between the time the ambulance departs from the subgroup and returns to the subgroup without fulfilling a rescue. Idle errands may result from false alarms; fradulent or prank calls; vague, insufficient descriptions given to the dispatcher preventing success in reaching the patient; too long a response time for patients to wait for the ambulance to arrive, and the possibility of having no ambulance available for rescue (which did not happen in empirical nor simulated data).
trauma patients was significantly different than for non-trauma patients (P ⬍ 0.05). Thus, these time distributions were managed separately.
The developed simulation model is shown in Fig 2. The rescue pattern for each individual response unit is displayed in Fig 3. Among the times for each step of the rescue, there are no significant differences (P ⬎ 0.05) between the empirical data and simulated ones. The av-erage of each simulated turnaround time is 37.72 minutes
(standard deviation, 0.59 minutes), which is close to 37.75 minutes (standard deviation, 1.33 minutes) of em-pirical data. Based on the current number of staffed ambulances per response unit, the average utilization rate of each response unit was 8.78% (Table 2). The average time interval between 2 rescue calls for the headquarters was 6 minutes. The possibility of 2 sequential rescue calls being reported simultaneously to the same response unit was only 8.1%. However, the situation for an event
TABLE 2. Ambulance Rescue Team Utilization Rates for EMS Subgroups among Different Alternatives
Subgroups (Rescue Units)
% of Idle Errands* (IE)
Ambulance Rescue Team Utilization Rates (%)
Empirical Data Computer-Simulated Data
Current Equipped Ambulance Level†
Lower Equipped Ambulance Level‡
Lower Idle Errand Rate by 10%§
[IE-(IE⫻ 0.1)]
Lower Idle Errand Rate by 20%㛳 [IE-(IE⫻ 0.2)]
Lower Idle Errand Rate by 30%¶ [IE-(IE⫻ 0.3)] EMS1 31.74 10 19 20 20 20 EMS2 34.38 5 10 12 10 11 EMS3 33.85 6 6 6 6 6 EMS4 21.25 3 4 3 3 4 EMS5 28.95 15 15 15 15 16 EMS6 28.36 13 26 26 26 27 EMS7 16.10 5 10 10 10 10 EMS8 27.85 17 35 35 36 36 EMS9 17.27 4 11 10 11 11 EMS10 32.76 16 17 17 17 17 EMS11 25.66 6 11 12 11 12 EMS12 30.95 14 27 27 28 28 EMS13 29.86 2 7 7 7 8 EMS14 29.89 4 8 8 9 8 EMS15 35.64 7 7 7 7 7 EMS16 28.00 6 13 13 13 13 EMS17 13.77 11 22 22 22 22 EMS18 44.39 10 22 23 22 24 EMS19 10.15 20 20 20 20 20 EMS20 36.31 8 28 28 26 28 EMS21 27.80 6 13 13 13 13 EMS22 32.58 6 11 12 12 12 EMS23 30.77 7 7 7 7 7 EMS24 31.71 6 12 12 13 12 EMS25 29.75 2 6 6 7 7 EMS26 30.38 1 1 1 1 1 EMS27 36.36 28 28 28 28 28 EMS28 37.43 3 6 6 6 7 EMS29 33.04 7 12 14 13 15 EMS30 30.43 3 3 3 3 3 EMS31 21.02 8 16 15 16 16 EMS32 32.47 6 13 13 13 14 EMS33 37.04 8 30 27 28 31 EMS34 18.50 23 48 52 49 48 EMS35 7.66 12 24 24 25 25 EMS36 38.03 8 9 9 9 9 Average 28.67 8.78 15.47 15.64 15.61 16.00
NOTE. The percent of utilization rate equals the percent of time the ambulance rescue teams are used for go-errands (true plus idle errands) instead of sittinginactive. For example, the average utilization rate of 8.78% for the current situation indicates that 91.22% of the time ambulance rescue teams are ready to go for 24 hours a day but sit idle, waiting for the next rescue call to come in. An ambulance rescue team consists of one ambulance staffed with one team of two Emergency Medical Technicians.
*Idle errand: ambulance departure from the subgroup and return to the subgroup without fulfilling a rescue, ie, false alarm. †Current situation: the number of staffed ambulances per subgroup ranges from 1 to 3.
‡Staffed ambulance level has been reduced to 1 per subgroup.
§Staffed ambulance level has been reduced to 1 per subgroup, as above, and the idle errand rate has been set lower by 10%. 㛳Staffed ambulance level has been reduced to 1 per subgroup, as above, and the idle errand rate has been set lower by 20%. ¶Staffed ambulance level has been reduced to 1 per subgroup, as above, and the idle errand rate has been set lower by 30%.
with no ambulance available for rescue (an invalid call) never occurred during the simulation time period.
If the levels of available ambulances staffed with EMTs are reduced from the present 1 to 3 ambulances per response unit to 1 (called lower equipped level), the average utiliza-tion rate will increase from 8.78% to 15.47% for each staffed ambulance (see Table 2). Under those conditions (as shown in Table 3), the average times required for ambu-lance arrival at the incident site (6.27⫾ 0.12 minutes) and arrival at the hospital (21.12 ⫾ 0.20 minutes) are slightly longer than the ones of the current equipped level (current situation) (6.00⫾ 0.09 minutes and 20.89 ⫾ 0.22 minutes, respectively). However, there is no statistical delay in am-bulance arrival at the scene for patients after the amam-bulance level was decreased. No invalid calls in the form of having no ambulance available for rescue occurred in the entire simulation time, whether under the existing, current situa-tion reported rate or under the scenario of reduced ambu-lance and team staffing to 1 per response unit (lower equipped level). Therefore, we conclude that with fewer ambulances and rescue team staff, the cost can be reduced and the utilization rate and the performance in the given event report rate can be improved. Based on the results of this research, we determined that the subject EMSsystem has a high idle errand rate (28.67%) (see Table 1). The simulation predicts the possible outcome when the number of ambulances per EMSsubgroup is reduced to 1, and the idle errand rate is reduced by 10%, 20%, and 30%. By performing analysis of variance tests across multiple alter-natives, we found that there were no significant differences in the time intervals from ambulance arrival at the scene and arrival at the hospital, although the utilization rate of am-bulances rises (see Tables 2 and 3). Under the current event report rate, no calls occurred during the simulation that resulted in having no ambulance available for rescue. We
conclude that even if the number of ambulances is de-creased, one can still try to reduce the idle errand rate make the rescue teams and ambulances more effective and effi-cient.
The outcome of patients for the prehospital rescue model is affected by an important factor—the time required for providing the emergency care at the scene and definite care in the hospital emergency department. Under the current EMSmodel, the time spent to transport patients to a hospital was 20.89 minutes for all patients and 23.63 minutes for prehospital cardiac arrest patients. The average time taken for a rescue team to arrive at scene was 6.0 minutes for all patients. After we changed the number of ambulances, the average time taken for a rescue team’s arrival at scene was 6.27 minutes; the mean time spent to transport patients to a hospital was 21.12 minutes for all patients and 23.86 min-utes for prehospital cardiac arrest patients. For prehospital cardiac arrest patients, there is no statistical difference among the times required to reach the hospital under the 2 scenarios. The same result can be found between other alternatives (see Table 3). Therefore, we conclude that the care delivered to patients will not be delayed even though the number of ambulances and the idle errand rate have both been changed (see Table 3).
DISCUSSION AND CONCLUSION
Simulation is generally defined as “the imitation of the operation of a real-world process or system over time.”14 “Simulation involves the generation of an artificial history of the system and the observation of that artificial history to draw inferences concerning the operating characteristics of the real system that is represented.”14Simulation is used to describe and analyze the behavior of a system, ask what-if questions about the real system, and aid in the design of real
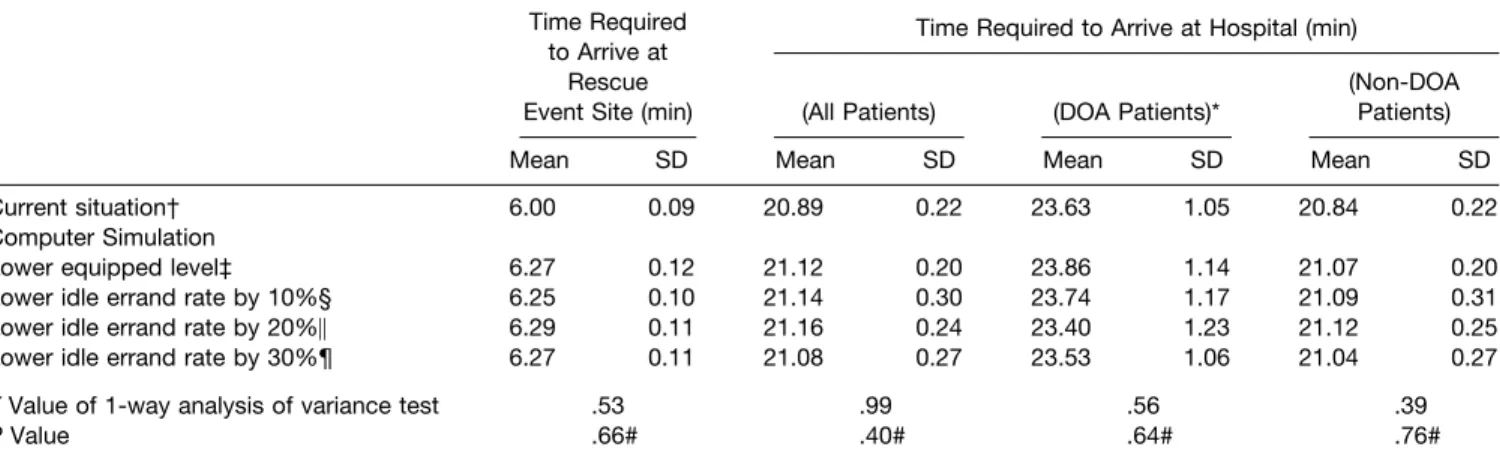
TABLE 3. Time Performance Indicators of Ambulance Rescue Teams for Current Situation and amongMultiple Alternatives
Time Required to Arrive at
Rescue Event Site (min)
Time Required to Arrive at Hospital (min)
(All Patients) (DOA Patients)*
(Non-DOA Patients)
Mean SD Mean SD Mean SD Mean SD
Current situation† 6.00 0.09 20.89 0.22 23.63 1.05 20.84 0.22
Computer Simulation
Lower equipped level‡ 6.27 0.12 21.12 0.20 23.86 1.14 21.07 0.20
Lower idle errand rate by 10%§ 6.25 0.10 21.14 0.30 23.74 1.17 21.09 0.31
Lower idle errand rate by 20%㛳 6.29 0.11 21.16 0.24 23.40 1.23 21.12 0.25
Lower idle errand rate by 30%¶ 6.27 0.11 21.08 0.27 23.53 1.06 21.04 0.27
F Value of 1-way analysis of variance test .53 .99 .56 .39
P Value .66# .40# .64# .76#
NOTE. An ambulance rescue team consists of one ambulance staffed with one rescue team of 2 Emergency Medical Technicians. Abbreviation: DOA, dead on arrival.
*DOA⫽ patients found to be in prehospital cardiac arrest.
†Current situation: The number of staffed ambulances per subgroup ranges from 1 to 3. ‡Staffed ambulance level has been reduced to 1 per subgroup.
§Staffed ambulance level has been reduced to 1 per subgroup, as above, and the idle errand rate has been set lower by 10%. 㛳Staffed ambulance level has been reduced to 1 per subgroup, as above, and the idle errand rate has been set lower by 20%. ¶Staffed ambulance level has been reduced to 1 per subgroup, as above, and the idle errand rate has been set lower by 30%. #There is no significant difference under a level 0.05.
systems. In management science, simulation is a problem-solving methodology for the solution of many real-world problems.
There are various kinds of simulation models, and their ramifications are complex.14Dynamic system models gen-erally can be classified into 3 groups: symbolic models, analytic models, and simulated models.14,15Among those, the simulated model is a tool of performance assessment, generally using computer software to simulate a system’s behavior, explore real-world causal relationships, and assess the system’s performance in terms of resource utilization rate, turn-around time, waiting time, and so on. In addition, it can be used to predict possible outcomes for the system after changing some manipulable conditions. By simulating various alternatives and predicting their corresponding re-sults, a conclusion can be provided for decision makers’ reference.
Many fields use simulation methods to resolve problems in complicated systems such as military simulations, includ-ing war strategy simulation, arms and troop distribution simulation, logistics transportation simulation, and commu-nication simulation.15Service systems’ simulation includes process reengineering simulation, on-line simulation, and resource management simulation. Distribution systems’ simulation covers manufacturing process simulation, per-formance evaluation simulation, and cycle-time simulation, among others. The medical care systems’ simulation covers the range of total quality management or continuous quality improvement and resource management simulation.16-20 The previously mentioned applications all attempt to use simulation techniques for real-world operations and man-agement.
The advanced computer simulation software was applied in our research to remodel the subjective EMSsystem. To mimic the real performance of the system, the following empirical data are essential to establish the simulated model, including frequency of incident happening, time required in every activity of EMSoperation, amount of resources, and final destination. By simulating changes in resource alloca-tion, performance of the EMSsystem can be expected to improve. In summary, the conclusions are as follows: (1) the utilization rates of EMT personnel and ambulances of the subject system are presently low; therefore, the number of staffed ambulances can be reduced to increase the utili-zation rate while maintaining the current rules of operation and (2) decreasing the number of staffed ambulances would not noticeably increase patients’ rescue waiting time (less than 1 minute increase on average) or produce idle calls because of ambulance nonavailability.
Therefore, according to the results of our research, we suggest that EMTs and ambulances of every response unit be reduced to 1 team with 1 ambulance in a subjec-tive EMSsystem to reduce costs and increase efficiency while maintaining the same operational pattern of medi-cal service.
However, we also find that for the prehospital cardiac arrest patients, around 24 minutes are usually required to transport them to the hospital, whereas it takes only about 6 more minutes for EMTs to arrive at the scene. The literature review indicates that the prognosis for prehospital cardiac arrest patients was determined by the use of basic lifesaving
and advanced lifesaving techniques, and the best time for that intervention is within 8 minutes of the incident.1,2,21-24 Therefore, if medical personnel or advanced lifesaving per-sonnel can perform rescues earlier at the scene, would the patient survival rate be elevated? This deserves further research attention.
This study provides a research methodology and sugges-tions toward specific policy direcsugges-tions, although the study is constrained by its database. In view of limited observation information in our research, the seasonal or monthly im-pacts cannot be integrated, and the amount of services is assumed to be the same as for previous patterns. Hopefully, future research may address these limitations and impacts and provide service projections based on empirical data covering longer periods of time.
REFERENCES
1. Urban N, Bergner L, Eisenberg MS: The costs of a suburban paramedic program in reducing deaths due to cardiac arrest. Med Care 1981;4:379-392
2. Valenzuela TD, Criss EA, Spaite D, et al: Cost-effectiveness analysis of paramedic emergency medical services in the treatment of prehospital cardiopulmonary arrest. Ann EmergMed 1990;19: 1407-1411
3. Riediger G, Sperber TF: Efficiency and cost-effectiveness of advanced EMS in West Germany. Am J EmergMed 1990;8: 76-80
4. Hallstrom A, EisenbergMS, Bergner L: Modelingthe effective-ness and cost-effectiveeffective-ness of an emergency service system. Soc Sci Med 1981;15C:13-17
5. Nichol G, Detsky AS, Stiell IG, et al: Effectiveness of emer-gency medical services for victims of out-of-hospital cardiac arrest: A metaanalysis. Ann EmergMed 1996;27:700-710
6. White RD, Asplin BR, Bugliosi TF, et al: High discharge survival rate after out-of-hospital ventricular fibrillation with rapid defibrillation by police and paramedics. Ann EmergMed 1996; 28:480-485
7. Forrer CS, Swor RA, Jackson RE, et al: Estimated cost effec-tiveness of a police automated external defibrillator program in a suburban community: 7 years experience. Resuscitation 2000;52: 23-29
8. Nichol G, Hallstrom AP, Ornato JP, et al: Potential cost-effec-tiveness of public access defibrillation in the United States. Circu-lation 1998;97:1315-1320
9. Hauswald M, Yeoh E: Designing a prehospital system for a developingcountry: estimated cost and benefits. Am J EmergMed 1997;15:600-603
10. Moore L: Measuringquality and effectiveness of prehospital EMS. Prehosp EmergCare 1999;3:325-331
11. Spaite D, Benoit R, Brown D, et al: Uniform prehospital data elements and definitions: A report from the uniform prehospital emergency medical services data conference. Ann Emerg Med 1995;25:525-534
12. BestFit software, Version 2.0. Palisades Corporation, New-field, NY
13. eM-Plant software, Version 4.6.1. Neu-Isenburg, Germany, Tecnomatix Technologies, Ltd, October 2000
14. Banks J: Handbook of Simulation: Principles, Methodology, Advances, Applications and Practice (ed 1). New York, Ny, John Wiley & Sons, 1998, pp 3-30
15. Pidd M: Computer Simulation in Management Science (ed 4). Chichester, England, John Wiley & Sons, 1998, pp 3-23
16. Ohboshi N, Masui H, Kambayashi Y: A study of medical emergency workflow. Comput Methods Programs Biomed 1998;55: 177-190
17. Saunders CE, Makens PK, Leblanc LJ: Modelingemergency department operations usingadvanced computer simulation sys-tems. Ann EmergMed 1989;18:134-140
18. McGuire F: Usingsimulation to reduce length of stay in emergency department. JSHS 1997;5:81-90
19. Hashimoto F, Bell S: Improvingoutpatient clinic staffingand schedulingwith computer simulation. J Gen Intern Med 1996;11: 182-184
20. Chin L, Fleisher G: Planningmodel of resource utilization in an academic pediatric emergency department. Ped Emerg Care 1998; 14:4-9
21. Nichol G, Laupacis A, Stiell IG, et al.: Cost-effectiveness analysis of potential improvements to emergency medical services for victims of out-of-hospital cardiac arrest. Ann EmergMed 1996; 27:711-720
22. Jermyn BD: Cost-effectiveness analysis of a rural/urban first-responder defibrillation program. Prehosp Emerg Care 2000; 4:43-47
23. Cummins RO, Ornato JP, Thies WH, et al: Improvingsurvival from sudden cardiac arrest: The “chain of survival” concept: a statement for health professionals from the Advanced Cardiac Life Support Subcommittee and the Emergency Cardiac Care Commit-tee, American Heart Association. Circulation 1991;83;1832-1947
24. Kerber RE: Electrical treatment of cardiac arrhythmias: defi-brillation and cardioversion. Ann EmergMed 1993;296-301