Keywords:
Taiwan; Ferret badger; Rabies; EpidemiologyIntroduction
On July 17, 2013, RABV was detected in Taiwan ferret badgers in Taiwan Island [1]. Ferret badger (Melogale moschata) is the sole reservoir host for the rabies virus, and the epidemic is only prevalent in Taiwan Island [1,2]. Epidemiologically, it is indicated that there were the Main (West) and East epidemic areas separated by the Central Mountain Ranges [2,3]. The phylogeny of nucleoprotein and glycoprotein genes of ferret badger rabies virus revealed the RABV to be clustered in two distinct groups, TWI and TWII, which were consistent with the geographic segregation into the East and West areas separated by the Central Mountain Range [3]. Chiou et al. [4] indicated that RABV could be cryptically circulating in the environment. An understanding of the underlying mechanism might shed light on the complex interaction between RABV and its host. Lin et al. [5] indicated that the origin of the epidemic could be in the Eastern Taiwan, then the Formosan ferret badger rabies moved across the Central Mountain Range to western regions and separated into two branches. A retrospective study of Formosan ferret badger rabies indicated that the ferret badger population in Taiwan had been affected by rabies prior to 2010 [6].
Over the past several decades, studies of wildlife revealed that suitable habitat was a function of features of landscape and human demography, such as: human population density, road density, land ownership, forest type, agriculture type etc. Landscape ecologists use sophisticated analyses of habitat use that consider multiple characteristics of the environment. Consequently, habitat selection of the wildlife is the act of choosing the combination of available abiotic and biotic elements that best fulfills the life-history needs [7,8]. Evidence of the association of land use and human demographics in rabies epizootics has been reported. Identification of these factors influencing the spread of rabies can help to assess risk for rabies and provide the improved planning and efficient application of rabies control program [9-11].
The ferret badger is omnivorous wildlife mustelid, mainly feeding on invertebrates and fruits. The most important food sources of ferret
badgers are earthworms and insects [12]. The body mass for adults were 0.90 ± 0.14 kg [13], or 0.8~1.6 kg [14]. The animal is considered a weak competitor and not usually found in urbanized areas accordingly [3,15]. Direct quantitative estimation of ferret badger population densities over broad geographic regions by usual conventional trapping and infrared cameras record in different elevations and locations would be prohibitively expensive. Consequently, using measures of landscape features and other factors that are predictive of favorable ferret badger habitat, offers an attractive alternative approach.
The objectives of this article were to examine the association between various environmental and demographic features of townships and the occurrence of ferret badger rabies in the East Epidemic Area in Taiwan.
Study area
The study included Hualien County, Taitung County and Pingtung County which constitute the East Epizootic Area of ferret badger rabies in Taiwan Island, excluding 3 island townships. Townships of above-mentioned 3 counties were included in the study, totaling 59 townships
and 10,939 km2 of land.
Data collection
All research data concerning ferret badger rabies from 2013 to 2016 in this research were downloaded from the governmental website of BAPHIQ http://www.baphiq.gov.tw/view.php?catid=10980, with the
*Corresponding author: Chang-Young Fei, School of Veterinary Medicine, National
Taiwan University, Taipei, Taiwan, Republic of China, Tel: 886910161024; Fax: 886223661475; E-mail: [email protected]
Received June 03, 2017; Accepted June 09, 2017; Published June 16, 2017 Citation: Shih TH, Chiang JT, Wu HY, Tu WJ, Tsai CT, et al. (2017) The Landscape
and Demographic Features Associated with Ferret Badger Rabies in Taiwan East Area. J Prob Health 5: 178. doi: 10.4172/2329-8901.1000178
Copyright: © 2017 Shih TH, et al. This is an open-access article distributed under
the terms of the Creative Commons Attribution License, which permits unrestricted use, distribution, and reproduction in any medium, provided the original author and source are credited.
Abstract
This study evaluated landscape characteristics associated with the incidence of ferret badger (Melogale
moschata) rabies in the East Epidemic Area, Taiwan, where the disease has been endemic from 2013 till date. This
study included 268 cases of ferret badger rabies reported from 59 townships during 2013-2016. A multivariable logistic regression analysis revealed that for townships with elevation between 0 and 200 m, or between 201 and 600 m, the estimated probability of the incidence of ferret badger rabies for each township increases with the rise of forest area. For townships with elevation higher than 600 m, the association is negative, a fact reflected by the interaction effect between variables of forest and elevation fitted in the model. This model provided by the combination of different land use types, human population density and elevation measures of townships, may be used in estimating the incidence probability of prioritizing areas for ferret badger rabies control on oral vaccination.
The Landscape and Demographic Features Associated with Ferret Badger
Rabies in Taiwan East Area
Tai-Hwa Shih1, Jeng-Tung Chiang2, Hung-Yi Wu3, Wen-Jane Tu4, Cheng-Ta Tsai1, Shih-Chiang Kuo1 and Chang-Young Fei5* 1Bureau of Animal and Plant Health Inspection and Quarantine (BAPHIQ), Council of Agriculture, Taipei, Taiwan, Republic of China (ROC) 2Department of Statistics, National Chengchi University, Taipei, Taiwan, ROC
3College of Veterinary Medicine, National Chung Hsing University, Taichung, Taiwan, ROC 4Animal Health Research Institute (AHRI), Council of Agriculture, Tamsui, Taiwan, ROC 5School of Veterinary Medicine, National Taiwan University, Taipei, Taiwan, ROC
permission of BAPHIQ. Methods of sample collection and diagnostic examination of rabid ferret badgers were described by Shih et al. [3]. Every case was geocoded by the location of townships. Once geocoded, each rabies case was assigned to the corresponding townships and the number of cases by township was categorized and calculated. A final total of 59 townships and 268 ferret badger rabies cases were included in the study. Average elevation of each township was downloaded from Taiwan Geospatial One-Stop (TGOS) website of the Ministry of Internal Affairs.
Land use
To study the association of different land use types, the area of each land use type was obtained for each township. The Taiwan Land Cover Data of 2008 edition from the “Land Use Investigation of Taiwan” was downloaded and used to extract land use data for the study area (http:// lui.nlsc.gov.tw/LUWeb/FileDL/FileDLShow.aspx?page=1). For this study the land use types were categorized by Taiwan government into 9 types. The nine types are: 1. Agriculture, 2. Forest, 3. Transportation, 4. Water, 5. Architecture, 6. Public institution, 7. Entertainment, 8. Mine, 9. Others.
Statistical analysis
SAS Statistical Software version 9.4 was used to perform the data analysis. We calculated statistics for townships with cases and without cases for each of the landscape variables, and tested for differences of landscape variables, elevations, and human population density in townships with and without ferret badger rabies cases using the nonparametric Mann Whitney test. We then fitted a logistic regression model to the data, and used the fitted model to estimate the probability of incidence of ferret badger rabies for each township. In addition, spatial autocorrelation was also assessed and found to be present but low, and comparison showed that it did not affect the regression results. We therefore used the non-spatial model to present our findings.
Results
Landscape composition and rabies surveillance
There are 3 counties in total that comprises 62 townships in the East Epizootic Area in Taiwan. Two island townships in Taitung County, the Green Island and Orchid Island, as well as one island township in Pingtung County, the Liouciou Island, were excluded in this study.
A total of 59 townships and 10,939 km2 of land were included in the
study. Among them, 25 out of the 59 townships reported at least one of the 268 ferret badger rabies cases during 2013 to 2016 period. The annual average number of cases during the 4 year-period in the 25 townships was 2.68 (268/25/4) per township. The maximum number of ferret badger rabies cases in townships was Chenggong, where a total of 82 cases was reported for the 4-year period. Table 1 indicates the land-use type and area in 59 townships of the East Epidemic. Table 2 indicates numbers of townships with cases from 2013 to 2016 annually, which implies the expansion trend of the ferret badger rabies at the East Epidemic Area.
Statistical analysis
Table 3 presents comparisons of areas of land use types, elevations, and human population density between townships with and without ferret badger rabies cases. At the 0.05 level of significance, forest area, architecture area, population density and elevation were found to be highly significantly different between the two groups of townships.
Townships with larger forest area, smaller architecture area, sparse population density and situated in higher elevation region appear to be more likely to have ferret badger rabies cases.
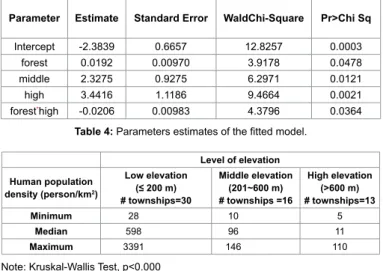
Table 4 presents the SAS output for a fitted logistic regression model of the data. Originally, forest area, architecture area, population density and elevation, the four variables that were found to be statistically significant in Table 3, were all included in the model. However, architecture area and population density were found to be insignificant in the model, and hence were dropped from further considerations. In addition, the elevation is classified into 3 classes to reflect the fact that it is found to be not linearly correlated with the probability of having ferret badger rabies: 0~200 m, 201~600 m, and >600 m. The class of townships with elevation between 0 and 200 m is served as the reference class of comparison in the model. The fitted model is:
ˆ log ˆ 1 p p
− = -2.3839+0.0192 forest+2.3275 middle+3.4416
high-0.0206 forest × high
where ˆp is the estimated probability of incidence of ferret badger
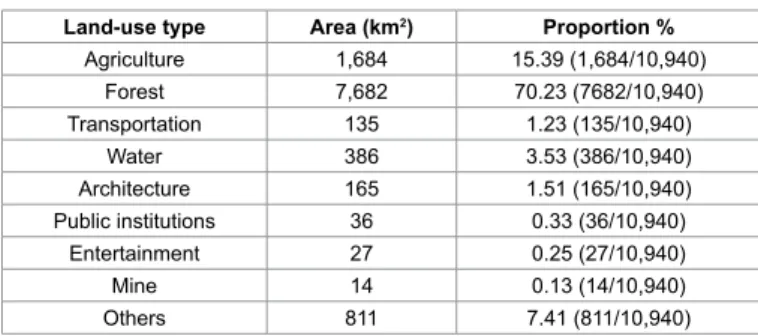
Land-use type Area (km2) Proportion %
Agriculture 1,684 15.39 (1,684/10,940) Forest 7,682 70.23 (7682/10,940) Transportation 135 1.23 (135/10,940) Water 386 3.53 (386/10,940) Architecture 165 1.51 (165/10,940) Public institutions 36 0.33 (36/10,940) Entertainment 27 0.25 (27/10,940) Mine 14 0.13 (14/10,940) Others 811 7.41 (811/10,940)
Table 1: Land-use type and area in 59 townships of the East Epidemic Area in
Taiwan.
No. Counties 2013 2014 2015 2016 Subtotal
1 Hualien 2 1 0 1 4
2 Taitung 10 1 1 1 13
3 Pingtung 3 1 4 0 8
Total 15 3 5 2 25
Table 2: Number of townships with cases of ferret badger rabies occurred annually
in the East Epizootic Area, Taiwan, 2013 ~ 2016.
Land use type Difference of each type among townships
(km2) Median values P values
w/ cases, n=25 w/o cases, n=34 Total, n=59
Agriculture 25.20 24.10 0.624 Forest 112.50 2.95 0.000* Transportation 1.90 2.00 0.319 Water 5.40 3.30 0.149 Architecture 1.50 2.85 0.007* Public Institution 0.20 0.40 0.051 Entertainment 0.10 0.20 0.206 Mine 0.03 0.04 0.707 Others 6.30 3.90 0.058
Population Density (people/
km2) 49.20 474.88 0.000*
Elevation (m) 380.00 28.00 0.000*
Table 3: Geographic differences between townships with and without ferret badger
rabies, forest stands for the forest area, middle is a dummy variable associated with the class of townships with elevation ranging between 201 and 600 m, high is a dummy variable associated with the class of townships with elevation higher than 600 m, and forest × high is the interaction effect between variables forest and high. Hosmer-Lemeshow goodness of fit test showed a P-value of 0.4039, an indication that there is no lack of fit of the model to the data. It follows from the model that the estimated probability of the incidence of ferret badger rabies for each township can be calculated as follows:
2.3839 0.0192 2.3275 3.4416 – 1
ˆ
1 exp forest middle high 0.0206 fores
p= t high
+ − + + + ×
where (middle=0, high=0), (middle=1, high=0), (middle=0, high=1) indicate the class of counties with elevation lower than or equal to 200 m, the class of counties with elevation between 201 and 600 m, and the class of counties with elevation higher than 600 m, respectively. For any township, once we know its elevation class, and forest area, the estimated probability can be easily found. For example, for a township
with forest area=150 km2, 1. If its elevation ≤ 200 m, we have forest=150,
middle=0, high=0 and hence its estimated probability of having ferret badger rabies is (2.3839 0.0192 .15 1 ˆ 0.6215 1 exp 0) p − + = = +
2. If its elevation is between 201 and 600 m, we have forest=150, middle=1, high=0 and hence its estimated probability of having ferret badger rabies is (2.3839 0.0192 .150 2.32 1 ˆ 75 0.9439 1 exp ) p + + = − + =
3. If its elevation is higher than 600 m, we have forest=150, middle=0, high=1, and hence its estimated probability of having ferret badger rabies is (2.3839 0.0192 .150 3.4416 0.0 1 ˆ 0.7001 1 e px 206.150) p= − + + − = +
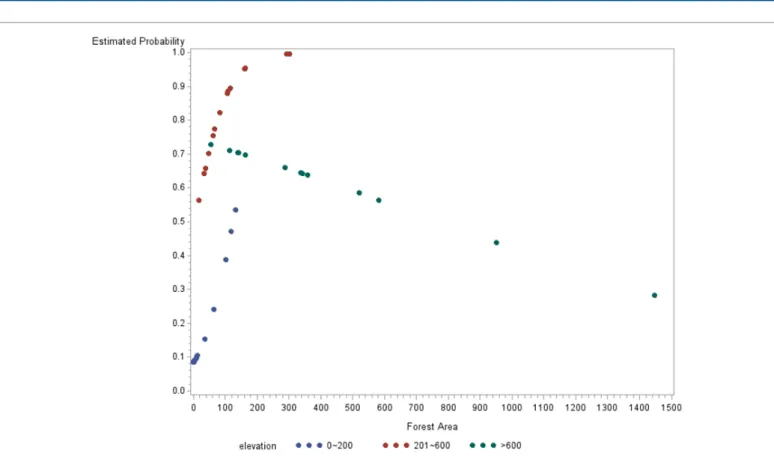
Following the same arguments, we can calculate the estimated probabilities of incidence of ferret badger rabies for each township, and Figure 1 provides a graphical summary of the results. The insight of the fitted model is apparently easier to interpret in terms of the plot.
According to Figure 1, we can first observe that the spread of forest areas associated with townships of different elevation classes are quite different. Townships with elevation less than or equal to 200 m generally have smaller forest areas and are less spread, ranging between 0.02 and
131.60 km2. Townships with elevation between 201 m and 600 m follow
have forest areas ranging between 16.1 and 301.8 km2. Townships with
elevation higher than 600 m have the widest spread of forest areas,
ranging from 55 to 1447 km2. We can also see from the plot that for
townships with elevation between 0 and 200 m, or between 201 and 600 m, the estimated probability of incidence of ferret badger rabies is increasing with the rise of the area of forest. Instead, for townships with elevation higher than 600 m, the estimated probability of incidence of ferret badger rabies is decreasing with the increase of the area of forest, a fact reflected by the interaction effect between variables forest and high fitted in the model. Nevertheless, if we draw a vertical line above any value of forest area in the plot, we can conclude that for townships with the same forest area, it is always true that townships with elevation ranging between 201 and 600 m have the highest estimated probability of the incidence of ferret badger rabies, followed by townships with
elevation higher than 600 m. Townships with elevation less than or equal to 200 m are least likely to find ferret badger rabies cases.
Table 5 presents the summary statistics of population density associated with the three levels of elevation. Kruskal-Wallis test was performed to see the differences in population density. The P value is close to 0, which means there is a strong evidence that population densities are different among the three levels of elevations. In fact, townships with low elevation tend to be most populated, whereas townships with high elevation tend to be least populated. In addition, population density and forest area appear to be negatively correlated among the three levels of elevation. Since population density, forest area, and the elevation are strongly associated, population density becomes redundant once forest area and the elevation are included in a regression model. This provides a possible explanation why population density was found to be highly statistically significantly different between the townships with and without ferret badger rabies cases in Table 3, but was not found to be significant in the fitted logistic regression model.
Discussion
There are two ferret badger rabies epidemic areas in Taiwan, one on the east side of the Central Mountain Range and one on the west side. These two epidemic areas are considered as two independent groups in epidemiology [2] as well as in phylogeny of nucleoprotein and glycoprotein genes [16]. This study is the research results of the east epidemic area.
Having tested and analyzed by Mann Whitney test (Table 3) as well as the multivariable logistic regression analysis, we discovered that the elevation as well as the area of forest of townships had significant association, either positive or negative, with the incidence of ferret badger rabies (Table 4; Figure 1). Shih et al. [3] also pointed out that the incidence rates of ferret badger rabies are significantly different (p<0.001) between townships of elevations of lower or higher than 200 m. This study also found that human population densities of townships were highly significantly different among the 3 classes of elevations (Kruskal-Wallis Test, p<0.000, Table 5), which implies the influence (association) of people to the living resources of ferret badger habitats. In townships of low elevations, where few ferret badger rabies occurred, possibly due to the high human population density causes lack of green space to generate foods that ferret badgers favor, such as earthworms etc. Besides, high numbers of stray dogs that rely on humans to survive
Parameter Estimate Standard Error WaldChi-Square Pr>Chi Sq
Intercept -2.3839 0.6657 12.8257 0.0003
forest 0.0192 0.00970 3.9178 0.0478
middle 2.3275 0.9275 6.2971 0.0121
high 3.4416 1.1186 9.4664 0.0021
forest*high -0.0206 0.00983 4.3796 0.0364
Table 4: Parameters estimates of the fitted model. Level of elevation Human population density (person/km2) Low elevation (≤ 200 m) # townships=30 Middle elevation (201~600 m) # townships =16 High elevation (>600 m) # townships=13 Minimum 28 10 5 Median 598 96 11 Maximum 3391 146 110
Note: Kruskal-Wallis Test, p<0.000
Table 5: Comparison of human population density among the three classes of
in townships of low elevations also pose threat to ferret badgers’ survival, which is also stated and initiated as a new issue of the dog-human-wildlife interface [17]. In townships of middle elevations, there is a positive correlation between the incidence rate of ferret badger rabies and the area of forest. It is possibly due to it being a rich source of food that ferret badgers favor as well as having few stray dogs in the greenspace forest. In townships of high elevations, incidence of ferret badger rabies is low, and is negatively correlated with the areas of forest in townships. It is possibly due to the fact that cases of suspected ferret badger rabies are mainly found and notified to government by residents. Lower human population density in high elevations of townships (Table 5) implies lower rabies-infected ferret badgers being found accordingly.
This study is the first to utilize multivariable logistic regression analysis to study the association between landscape characteristics and ferret badger rabies incidence, thus the results differ from raccoon rabies. Jones et al. [9] uses multivariable logistic regression analysis to studied the large raccoon rabies epidemics and found the incidence has a positive correlation with a high percentage of agricultural land use, high water coverage in combination with low human population density, and low water coverage with high human population density. Recuenco et al. [10] utilizes Poisson multivariable regression analysis to study the raccoon rabies epidemics and found that the incidence rate of raccoon rabies has a positive correlation with low human population density, lack of river and lakes, and lack of highways. However, it has a negative correlation with elevations and wetlands. Raccoons are middle sized carnivores, weighing between 4 kg-10 kg, and having the ability to utilize human habitats. Due to their strong adaptability of food sourcing, they often appear in cities scavenging the leftovers from human garbage [18]. Rabies are spread by biting, therefore the incidence rate has an important relation to habitats of reservoir animals. Ferret badgers are small-sized carnivores, their habitat is different from raccoons, therefore the landscape characteristics of rabies incidence are different.
Conclusion
In conclusion, this research study can propose a model to predict the incidence rate of ferret badger rabies in the east epidemic area, and can be utilized for reference to oral vaccination administration to largely reduce the cost of epidemic prevention.
Funding
This research was funded by Grant 106AS-9.9.1-BQ-B3 from the BAPHIQ with the project: A Strategic Study of Animal Rabies Prevention in Taiwan.
Acknowledgements
The authors would express their deepest appreciation to Feng Chia University Geographic Information System Research Center for her assistance in this research in the data collection of elevations and land use. The authors also express their deepest appreciation to colleagues working at the Epidemiology Division, AHRI for identifying suspected rabid samples.
Competing Interests
There are no competing financial or commercial interests.
References
1. OIE (2016) The World Organization for Animal Health. Immediate notification from Dr Ping-Cheng Yang, President, Agriculture Technology Research Institute, Council of Agriculture, Hsinchu City, Chinese Taipei.
2. Chang SS, Tsai HJ, Chang FY, Lee TS, Huang KC, et al. (2016) Government response to the discovery of a rabies virus reservoir species on a previously designated rabies-free island, Taiwan 1999 to 2014. Zoon Public Health 63: 396-402.
3. Shih TH, Wallace R, Wu HY, Tu WJ, Inoue S, et al. (2017) The progression of Taiwan ferret badger rabies from July 2013 to December 2016. J Zoon Dis Public Heal 1: 3.
4. Chiou HY, Hsieh CH, Jeng CR, Chan FT, Wang HY, et al. (2014) Molecular characterization of cryptically circulating rabies virus from ferret badgers, Taiwan. Emerg Inf Dis 20: 790-798.
5. Lin YC, Chu PY, Chang MY, Hsiao KL, Lin JH, et al. (2016) Spatial temporal dynamics molecular evolution of re-emerging rabies virus in Taiwan. Int J Mol Sci 17: 392.
6. Chang JC, Tsai KJ, Hsu WC, Tu YC, Chuang WC, et al. (2015) Rabies virus infection in Ferret badgers (Melogale moschata subaurantiaca) in Taiwan: A retrospective study. J Wildlife Dis 51: 923-928.
7. Mladenoff DJ, Clayton MK, Pratt SD, Sickley TA, Wydeven AP (2009) Changes in occupied wolf habitat in the northern great lakes region. In: Edward H, Timothy RD, Adrian PW (eds.). Recovery of Gray Wolves in the Great Lakes Region of the United States: An Endangered Species Success Story. pp: 119-138.
8. Turner MG, Gardner RH (2015) Organisms and landscape pattern. In: Turner MG, Gardner RH, Landscape Ecology in Theory and Practice, pp: 229-285. 9. Jones ME, Curns AT, Krebs JW, Childs JE (2003) Environmental and human
demographic features associated with epizootic raccoon rabies in Maryland, Pennsylvania, and Virginia. J Wildlife Dis 39: 869-874.
10. Recuenco S, Eidson M, Kulldorff M, Johnson G, Cherry B (2007) Spacial and temporal patterns of enzootic raccoon rabies adjusted for multiple covariates. International Journal of Health Geographics 6: 14.
11. Recuenco S, Eidson M, Cherry B, Kulldorff M, Johnson G (2008) Factors
associated with endemic raccoon (Procyon lotor) rabies in terrestrial mammals in New Yourk State, USA. Prev Vet Med 86: 30-42.
12. Chuang SA, Lee LL (1997) Food habits of three carnivore species (Viverricula indica, Herpestes urva, and Melogale moschata) in Fushan Forest, northern Taiwan. J Zool 243: 71-79.
13. Zhang L, Wang Y, Zhou Y, Newman C, Kaneko Y, et al. (2010) Ranging and activity patterns of the group-living ferret badger Melogale moschata in central China. J Mamm 91: 101-108.
14. Storz JF, Wozencraft WC (1999) Melogale moschata. Mam Spe 3: 1-4. 15. Pei KJC (2001) Daily activity budgets of the Taiwan ferret badger (Melogale
moschata subaurantiaca) incaptivity. Endang Species Res 3: 1-11.
16. Tsai JC, Hsu WC, Chuang WC, Chang JC, Tu YC, et al. (2016) Emergence of a sylvatic enzootic Formosan ferret badger-associated rabies in Taiwan and the geographical separation of two phylogenetic groups of rabies viruses. Vet Microbiol 182: 28-34.
17. Gompper ME (2014) The dog-human-wildlife interface: assessing the scope of the problem. In: Gompper ME (eds.). Free-Ranging dogs and wildlife conservation.1st edn. Oxford University Press, pp: 9-45.
18. Hadidian J, Prange S, Rosatte R, Riley SPD, Gehrt SD (2010) Raccoons (Procyon lotor). In: Gehrt SD, Riley SPD, Cypher BL (eds.). Urban Carnivores: ecology, conflict and conservation. 1st edn. The Johns Hopkins University Press, pp: 35-47.
Citation: Shih TH, Chiang JT, Wu HY, Tu WJ, Tsai CT, et al. (2017) The
Landscape and Demographic Features Associated with Ferret Badger Rabies in Taiwan East Area. J Prob Health 5: 178. doi: 10.4172/2329-8901.1000178
OMICS International: Publication Benefits & Features Unique features:
• Increased global visibility of articles through worldwide distribution and indexing • Showcasing recent research output in a timely and updated manner • Special issues on the current trends of scientific research Special features:
• 700+ Open Access Journals • 50,000+ editorial team • Rapid review process
• Quality and quick editorial, review and publication processing • Indexing at major indexing services
• Sharing Option: Social Networking Enabled
• Authors, Reviewers and Editors rewarded with online Scientific Credits • Better discount for your subsequent articles