國 立 交 通 大 學
應 用 化 學 研 究 所
博 士 論 文
電子用新型環氧樹脂與 BT 樹脂共交聯材料之研究
Co-cured Materials Based on Novel Epoxies and
Novel BT Resins for Electronic Application
研
究
生:王明偉
指導教授:林木獅 博士
中華民國 九十六 年 七 月
i
電子用新型環氧樹脂與 BT 樹脂共交聯材料之研究
學生:王明偉 指導教授:林木獅 國立交通大學應用化學學系﹙研究所﹚博士班 摘 要 在這本篇論文研究中,我們發展出新型含矽氧烷及亞醯胺基環氧樹脂和氰酸 酯化合物。在第Ⅰ章中我們成功合成含矽氧烷、亞醯胺四官能基環氧樹脂,這項 設計主要目的是希望藉此改善傳統環氧樹脂之機械性、熱穩定性及尺寸安定性。 在第 II 章中,我們將有機-無機混成材料-POSS 導入商用環氧樹脂,藉著 POSS 的高度自由體積及其他特性降低介電常數。 另外,商業上 BT 樹脂是由氰酸脂及 BMI 所混成,他可以提供良好的機械強 度及電氣性質,因此廣泛的被應用於封裝產業。然而,商業用 BT 樹脂存在著不 易硬化、加工困難及介電常數較高等問題;因此,在本論文中第 III,IV 和 V 章主要的研究目標在於利用分子結構設計將低介電常數之官能基如 siloxane, imide 等,設計為高分子主鏈。另外為增加與 BT 樹脂中 BMI 交聯性及反應性吾 人將 allyl C=C 鍵結併入合成新穎的氰酸脂樹脂。吾人利用這種新型含矽氧烷 亞醯胺、乙烯基氰酸脂與等當量 BMI 混合形成新型的 BT 樹脂。然後該新穎的 BT 樹脂在與不同當量的商用環氧樹脂共交聯反應,藉以改善商用環氧樹脂的物性及 電氣性質。ii
為了更進一步了解氰酸脂/環氧樹脂最佳應用及共交聯行為過程,在第 III
章中我們利用 FT-IR 觀察交聯過程中官能基變化。而在第 III, IV, and V.章中
我們利用 DSC、TGA、TMA、Gel fraction 測試材料的各種物性,在第 V 章,利用 新穎的 BT 樹脂與商業用環氧樹脂摻混,並進一步與新型的含矽氧烷亞醯胺基環 氧樹脂形成新型的共交聯材料,以改善傳統環氧樹脂缺點,使得這類共交聯材料 達到多數微電子製程應用上的要求。最後在第 VI 章中吾人利用 FT-IR 觀測氰酸 脂、BMI、環氧樹脂三成分間交聯硬化動力學參數之研究,分別探討氰酸脂/BMI、 氰酸脂/環氧樹脂、氰酸脂/BMI/環氧樹脂各成分系統間官能基的變化,發現其中 氰酸脂之反應機構與文獻上發表大致相同,且其中在三個系統中反應級數 n 值極 為相近,趨近於 2。其中自催化反應常數 k2 大約為非催化反應常數 k1 大 10 倍; 在活化能測試上,自催化活化能 E2 及未催化活化能 E1 皆可以得到,且 E2、E1 隨成分增加而逐漸升高,可能是因為多成分共交聯間會有較小的凝膠分率所致。
iii
Co-cured Materials Based on Novel Epoxies and Novel BT
Resins for Electronic Application
student:Ming-Wei Wang Advisors:Dr. Mu-Shih Lin
Department of Applied Chemistry
College of Science
National Chiao Tung University
ABSTRACT
In this study novel materials based on epoxy and cyanate ester containing
siloxane and imide groups were investiged.Chapter I dealed with siloxane- and
imide-containing tetrafunctional epoxy, which was designed mainly to improve
mechanical performance , thermal stability and dimensional stability. In chapter II,
incorporating POSS moiety into epoxy resin resulted in reduction of dielectric
constant with sacrifice of some other properties. BT resin, ie., blend of cyanate ester
and bismaleimide (BMI), possesses good mechanical strength and is currently used in
packaging material. However, lack of resin curing and dielectric constant are
drawbacks of the commercial BT resin. Therefore, focus on the improvement of resin
curing, dielectric constant and mechanical performance was the important goal in
iv
a cyanate ester. This cyanate ester was blended with equivalent amounts of modified
BMI to form a novel BT resin. Materials are then prepared by co-curing this novel BT
resin with different epoxies to improve the resin curing and material performances.
For better understanding of optimal application, curing behavior was studied in
chapter III. Properties of the co-cured materials were studied in chapters III, IV, and V.
In chapter V, co-cured materials were also prepared by blending the novel BT resin
with commercial epoxy to form part A resin, which then, further co-cured with
different amounts of a novel epoxy containing siloxane and imide. This co-cured
material possessed most of the properties required for microelectronic application.
Study of curing kinetics is given in chapter VI. In kinetic studies of the three
components system (cyanate ester/ BMI/epoxy), functional group changes basically
were the combination of the two systems ( cyanate ester/epoxy and cyanate
ester/BMI). There was no new chemical bonding found between the two net
works( cyanate ester/epoxy and cyanate ester/BMI). Kinetic parameters found
indicated very similar to one another among the three different systems. The rate
constant of catalytic reaction (k2) was approximately 10 times higher than that of
non-catalytic reaction (k1). Increased activation energies for both catalyzed (E2) and
non-catalyzed (E1) reactions were observed, compared with those of the component
v
誌 謝
「人因夢想而偉大」這句話從專科時代一直深放在自己內 心裡,每當深夜燈火闌珊、四下靜寂之時,總會想起這句經典名句。 到底夢想些什麼?該如何去圓夢?這二十年多年來,隨著成長的歷練而 不段的重複上演著。 十三年前碩士班時期,在恩師林木獅老師的指導下,踏入探索高 分子科學行列,從最簡單的實驗態度乃至影響實驗結果之過程,林博 士莫不千百般的叮嚀、指導,並從旁協助,如同幼童習車般,先以扶 持,俟平穩後,放手令其穩健行駛。在老師諄諄教誨下得以一窺高分 子化學之美及材料物性科學之奧秘。退伍後,初入社會的年輕小夥 子,有幸踏入國內傳統產業龍頭-台塑企業,從基層做起一直至小主 管,從中確實學習台塑企業的「知福、惜福、造福」理念,徹底自內 心審視人生及未來;然社會治安驟變,適時發生舉目震驚之聳動治安 案件,在夢想的驅使下,個人又做出另一項重大決定,就是投身警界, 貢獻一己之長。 在中央警察大學學習相關刑事技能及鑑識科學的同時,欣聞恩師 林木獅博士告知碩士班時期之論文發表於國際期刊,此時,心中盪漾 著莫名的感動與驕傲,深覺高分子科學領域與生活科學密不可分,在 恩師林木獅博士鼓勵下及警大指導老師駱宜安教師支持下,於 89 年
vi 再度重回母校-交大,再度投入探索高分子科學奧秘的行列。 在博士班求學二千五百多個日子裡,不斷周旋於學校、家庭與工 作職場三者之間,其中內心及體力上的煎熬,一直不斷的打擊著自 我,也曾幾何時興起乾脆休學的念頭!然在這七年來的過程中,幸而 不時有貴人、長官的提攜、同學及朋友的安慰、家人的鼓勵,在親情 及友情的支持下渡過重重難關,步入更重要的人生階段。 如今論文即將付梓,能夠成功的完成這篇論文對我的人生有著非 比尋常重大意義,特別感謝這幾年來恩師林木獅博士在論文、實驗上 的指導,甚而廢寢忘食、焚膏繼晷地幫明偉修改論文並翻譯成英文發 表於國際高分子期刊上,與國際科學同步。另感謝警察局歷任局長包 括葉局長坤福、林局長德華、周局長壽松、黃局長宗仁、吳主秘資照、 及刑警大隊林大隊長宏儒、交通隊黃隊長奇謀、少年隊林組長文輝、 及鑑識課蔡股長多賀的支持、鼓勵與提攜,讓明偉得以排除萬難在公 餘之際前往學校進修及做實驗;感謝歷屆的學、弟妹慧貞、志浩、婉 婷、小施、仁鴻、張董、小高在論文及實驗上的協助,中山科學院周 博士進益在材料測試上的幫忙,謝謝大家。 最後,感謝含辛茹苦養育我多年的父、母親,不斷鼓勵我追求新 知,也時時給我勉勵、照護,讓我有強健的體魄可以克服長期實驗上 及工作上的辛勞;感謝大哥-明輝每年幫我申報所得稅,讓我可以得
vii 知節稅之道、大姊-嘉惠、二姐-雅瑩,教導我投資理財觀念、小弟-建富,沒有你我就不可能會踏進警界,也不會有機會完成博士學位; 也感謝我的愛妻-惠玲,為我生下這麼既美麗、可愛又貼心,調皮又 搗蛋的一對女兒宥蓁、宥萱,另外,更感謝我的泰山大人及丈母娘幫 我照顧二位小寶貝,讓我得以無後顧之憂,全心全力於工作、學業上 努力。要感謝的人實在太多太多,今天明偉的成功皆來自於各位貴人 的協助。在此,特別向各位說聲感恩,大家對明偉的幫助,吾將永銘 在心。
謝謝你們!!!
vii
目
錄
中文提要 ……… i 英文提要 ……… iii 誌謝 ……… v 目錄 ……… vii 表目錄 ……… xiii 圖目錄 ……… xvi 前言……… 2 一、 含矽氧烷亞醯胺四官能基環氧樹脂之合成、物性及硬化行 為研究……… 5 1.1 摘要……… 6 1.2 簡介……… 6 1.3 實驗部分……… 7 1.3.1 化學藥品……… 7 1.3.2 實驗儀器……… 8 1.4 藥品合成……… 8 1.5 共交聯材料製備……… 10 1.6 結果與討論……… 11 1.6.1 化合物結構鑑定……… 12 1.6.2 動態 DSC 測試……… 18 1.6.3 硬化反應動力學探討……… 19 1.6.4 硬化反應過程中官能基變化……… 22 1.6.5 凝膠分率測試……… 23
viii 1.6.6 熱膨脹係數測定……… 24 1.6.7 熱安定性探討……… 26 1.6.8 動態機械性質分析……… 28 1.6.9 介電常數測試……… 31 1.7 結論……… 32 1.8 參考文獻……… 33 二、 低介電常數含 POSS 環氧樹脂以含 POSS 硬化劑及含矽氧烷 亞醯胺硬化劑硬化之物性探討研究……… 34 2.1 摘要……… 35 2.2 簡介……… 35 2.3 實驗部分……… 36 2.3.1 化學藥品……… 36 2.3.2 樣品製備……… 37 2.3.3 實驗儀器……… 38 2.4 結果與討論……… 38 2.4.1 動態 DSC 測試……… 41 2.4.2 硬化反應過程中官能基變化……… 42 2.4.3 凝膠分率測試……… 43 2.4.4 玻璃轉移溫度測試……… 44 2.4.5 熱膨脹係數測定……… 45 2.4.6 熱安定性測試……… 46 2.4.7 介電常數測定……… 47 2.5 結論……… 48
ix 2.6 參考文獻……… 49 三、 含矽氧烷亞醯胺及乙烯基氰酸脂與環氧樹合成共交聯材料 之物性及硬化行為研究……… 51 3.1 摘要……… 52 3.2 簡介……… 53 3.3 實驗部分……… 54 3.3.1 化學藥品……… 54 3.3.2 實驗儀器……… 54 3.3.3 藥品合成……… 55 3.3.4 共交聯材料製備……… 59 3.4 結果與討論……… 60 3.4.1 化合物結構鑑定……… 61 3.4.2 動態 DSC 測試……… 70 3.4.3 硬化反應過程中官能基變化……… 74 3.4.4 凝膠分率測試……… 78 3.4.5 熱安定性探討……… 79 3.4.6 膨脹係數測定……… 81 3.4.7 動態機械性質探討……… 82 3.4.8 介電常數測試……… 85 3.5 結論……… 86 3.6 參考文獻……… 87 四、 環氧樹脂與含矽氧烷亞醯胺之 BT 樹脂合成共交聯材料之
x 物性及硬化行為研究……… 90 4.1 摘要……… 91 4.2 簡介……… 91 4.3 實驗部分……… 93 4.3.1 化學藥品……… 93 4.3.2 藥品合成……… 94 4.3.3 儀器設備……… 94 4.4 結果與討論……… 95 4.4.1 動態 DSC 測試……… 95 4.4.2 硬化反應過程中官能基變化……… 96 4.4.3 凝膠分率測試……… 99 4.4.4 熱安定性探討……… 100 4.4.5 熱膨脹係數測定……… 102 4.4.6 動態機械性質探討……… 103 4.4.7 介電常數測試……… 106 4.5 結論……… 107 4.6 參考文獻……… 107 五、 新型環氧樹脂及新型 BT 樹脂共交聯材料之合成及物性研 究……… 109 5.1 摘要……… 110 5.2 簡介……… 110 5.3 實驗部分……… 111 5.3.1 化學藥品……… 111
xi 5.3.2 共交聯材料之製備……… 113 5.3.3 儀器設備……… 113 5.4 結果與討論……… 114 5.4.1 動態 DSC 測試……… 118 5.4.2 凝膠分率測試……… 120 5.4.3 熱安定性探討……… 121 5.4.4 熱膨脹係數測定……… 123 5.4.5 動態機械性質探討……… 124 5.4.6 介電常數測試……… 127 5.5 結論……… 128 5.6 參考文獻……… 129 六、 氰酸脂/BMI/環氧樹脂三成分系共交聯動力學研究…… 131 6.1 摘要……… 132 6.2 簡介……… 133 6.3 實驗部分……… 134 6.3.1 化學藥品……… 134 6.3.2 儀器設備……… 135 6.4 結果與討論……… 135 6.4.1 氰酸脂樹脂硬化反應……… 135 6.4.2 LECY/Epoxy 反應……… 136 6.4.3 LECY/BMI 反應……… 141 6.4.4 LECY/BMI/Epoxy 反應……… 144 6.4.5 動力學研究……… 146
xii (1)LECY/Epoxy 系統動力學分析……… 148 (2)LECY/BMI 系統動力學分析……… 151 (3)LECY/BMI/Epoxy 系統動力學分析……… 154 6.5 結論……… 157 6.6 參考文獻……… 158 七、 總結……… 160
xiii
表 目
錄
一、 含矽氧烷亞醯胺四官能基環氧樹脂之合成、物性及硬化行為
研究……… 5
1.1 Curing conditions of samples……… 10
1.2 The maxium exothermic temp. of samples (MDA)…… 19
1.3 Kinetic data of samples ……… 21
1.4 Gel fraction results of samples ……… 24
1.5 Thermal expansion coefficients of samples ……… 26 1.6 Thermogravimetric analysis of samples ……… 27 1.7 Storage modulus and glass transition temperatures of
samples……… 29
1.8 DMA results (peak height and area of Tanδ) of samples 31 1.9 Dielectric constant and dissipation factor of samples 32
二、 低介電常數含 POSS 環氧樹脂以含 POSS 硬化劑及含矽氧烷亞
醯胺硬化劑硬化之物性探討研究……… 34
2.1 Gel fractions of cured samples……… 44
2.2 Coefficients of thermal expansion (CTE) and Tg's for
samples ……… 47
2.3 Dielectric constants for systems I and II ……… 48
三、 含矽氧烷亞醯胺及乙烯基氰酸脂與環氧樹合成共交聯材料
xiv
3.1 Data for Maximum exothermic peaks for BT/epxy
samples ……… 72
3.2 Co-curing stages of samples.……… 74
3.3 Absorbances associated with functional group changes during co-curing of the blend ( BT resin/epoxy in equivalent ratio) at 190 o C.……… 75
3.4 Gel fraction results of samples ……… 78
3.5 Thermal stability of samples. ……… 80
3.6 CTE values of samples. ……… 81
3.7 Storage modulus(E") and glass transition temperature (Tg) of samples.……… 83
3.8 Values of peak hight, peak width and peak area. …… 84
3.9 Values of dielectric constant and dissipation factor of samples……… 86
四、 環氧樹脂與含矽氧烷亞醯胺之 BT 樹脂合成共交聯材料之物 性及硬化行為研究……… 90
4.1 Increase (+) and decrease (-) of absorbance associated with the corresponding functional groups.………… 97
4.2 Gel fractions of samples.……… 100
4.3 Tempeartures of 5 weight loss and char yields of samples……… 100
4.4 CTE of samples before Tg ……… 102 4.5 Storage modulus(E") and glass transition
xv
temperatures (Tg's) found from DMA thermograms……… 104
4.6 Damping peak height, peak width and peak area…… 105
4.7 Dielectric constants and dissipation factors of samples……… 106
五、 新型環氧樹脂及新型 BT 樹脂共交聯材料之合成及物性研 究……… 109
5.1 Maximum exothermic peaks for epoxy/BT resin curing……… 119
5.2 Gel fractions of samples.……… 121
5.3 GA thermograms of samples……… 122
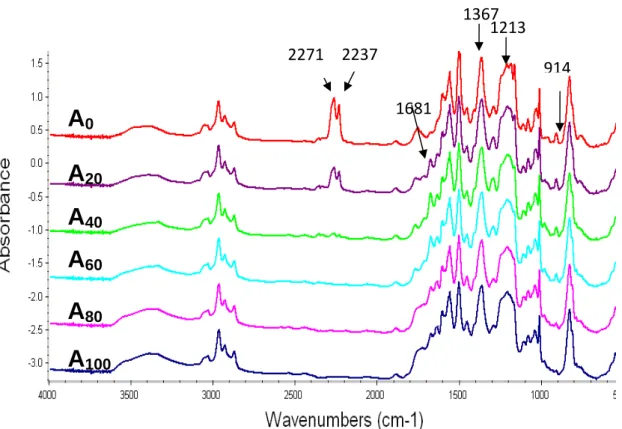
5.4 Values of CTE for samples ……… 123
5.5 Storage modulus(E") and glass transition temperature (Tg) form DMA……… 125
5.6 Peak height, peak width and peak area of samples…… 126
5.7 Measured dielectric constant and dissipation factor for various samples ……… 128
六、 氰酸脂/BMI/環氧樹脂三成分系共交聯動力學研究 …… 131 6.1 Kinetic parameters for LECY/Epoxycuring system… 150 6.2 Kinetic parameters for curing LECY/BMIsystem … 153 6.3 Kinetic parameters for curing LECY/BMI/Epoxy system 157
xvi
圖 目
錄
一、 含矽氧烷亞醯胺四官能基環氧樹脂之合成、物性及硬化行為 研究……… 5 1.1 1 H NMR spectrum of compound Ⅰ……… 121.2 FT-IR spectrum of compound Ⅰ……… 13
1.3 FT-IR spectrum of compound Ⅱb ……… 14
1.4 1
H-NMR spectrum of compound Ⅱb ……… 15
1.5 FT-IR spectrum of compound Ⅲ ……… 16
1.6 1
H-NMR spectrum of compound Ⅲ ……… 17
1.7 Dynamic DSC of samples(GA-240/Ⅲ/MDA) ……… 18
1.8 Typical dynamic DSC of sample (GA-240/Ⅲ/MDA
=0.8/0.2/1) with different heating rate ……… 20 1.9 Plot of ln(Φ/Tm2
)vs 1/Tm of sample……… 21
1.10
FT-TR of sample GA-240/Ⅲ/MDA=0.8/0.2/1) ……… 22 1.11
FTIR absorbance spectra for the reactions of sample E
(GA-2 40/Ⅲ/MDA =0.8 / 0.2 / 1 )at 180 o
C for various
times (At, t in mins) ……… 23
1.12 TMA thermograms of samples(GA-240/Ⅲ/MDA) ………… 25 1.13 TGA thermograms of samples(GA-240/Ⅲ/MDA) ………… 27
1.14 Tanδof samples(GA-240/Ⅲ/MDA) ……… 28
xvii
二、 低介電常數含 POSS 環氧樹脂以含 POSS 硬化劑及含矽氧烷亞
醯胺硬化劑硬化之物性探討研究……… 34
2.1 1 H-NMR spectrum of POSS-A……… 40
2.2 Figure 2.2 FT-IR spectrum of POSS-A……… 40
2.3 Dymamic DSC of system Ⅱ(ERL-4221/anhydride/POSS-A= 1/0.8 /0.05) ……… 41
2.4 FT-IR spectrum of system Ⅱ……… 42
2.5 Difference spectra of system Ⅱ……… 43
2.6 DSC thermograms of system Ⅱ ……… 44
2.7 Typical TMA thermogram of system Ⅱ……… 45
2.8 TGA thermograms for system Ⅱ……… 46
三、 含矽氧烷亞醯胺及乙烯基氰酸脂與環氧樹合成共交聯材料 之物性及硬化行為研究……… 51
3.1 1 H-NMR spectrum of compound I……… 64
3.2 FT-IR spectrum of compound I……… 65
3.3 1 H-NMR spectrum of compound Ⅱ ……… 65
3.4 FT-IR spectrum of compound Ⅱ ……… 66
3.5 1 H-NMR spectrum of compound Ⅲ ……… 66
3.6 FT-IR spectrum of compound Ⅲ……… 67
3.7 1 H-NMR spectrum of compound Ⅳ ……… 67
3.8 FT-IR spectrum of compound Ⅳ ……… 68
3.9 1H-NMR spectrum of compound Ⅴ ……… 68
xviii
3.11 FT-IR spectrum of compound Ⅴ ……… 69
3.12 FAB Mass spectrum of compound Ⅴ……… 70
3.13 Dynamic DSC thermograms for various BT/epoxy samples 71 3.14 Successive absorbance changes (At , t in mins) of the blend (epoxide/c=c/cyano=1/1/1) during co-curing reaction at 250 o C ……… 76
3.15 FTIR difference spectra (At – Ao, t in mins ) of the blend (epoxide/c=c/cyano=1/1/1) during co-curing reaction at 250 o C ……… 77
3.16 TGA thermograms of samples……… 80
3.17 TMA thermograms of samples……… 82
3.18 Storage modulus versus temperature of samples … 84 3.19 Damping peak (tanδ) of samples……… 85
四、 環氧樹脂與含矽氧烷亞醯胺之 BT 樹脂合成共交聯材料之物 性及硬化行為研究……… 90
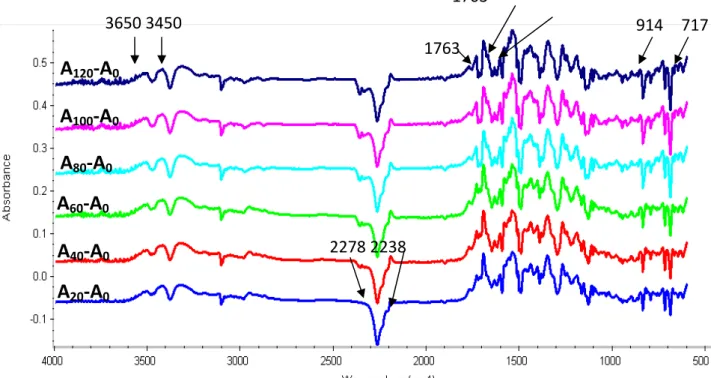
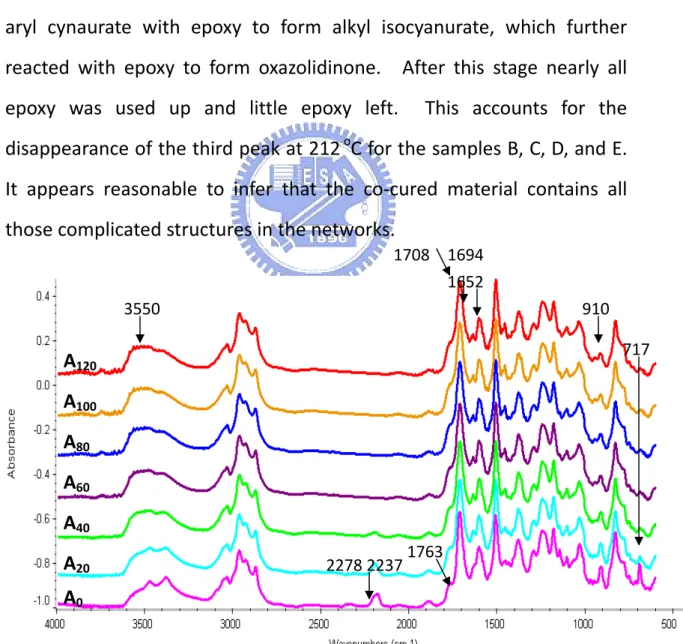
4.1 Exothermic peaks for Co-cured epoxy/BT samples… 95 4.2 Successive IR absorbance (At, t in mins.) changes for BT resin/epoxy cured at 250 o C……… 98
4.3 Difference spectr (At-Ao, t in mins.) of BTrein/epoxy cured at 250 oC……… 99
4.4 TGA thermograms for co-cured samples……… 101
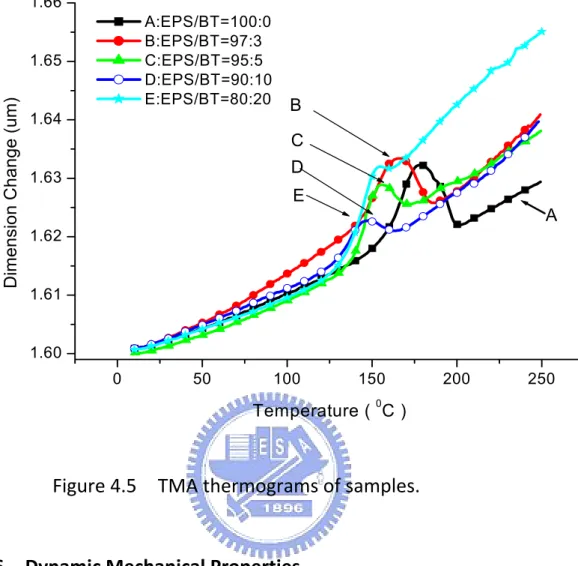
4.5 TMA thermograms of samples ……… 103
xix
五、 新型環氧樹脂及新型 BT 樹脂共交聯材料之合成及物性研
究……… 109
5.1 1 H-NMRspectrum of the novel epoxy VII……… 116
5.2 13 C-NMRspectrum of thecompound VII……… 116
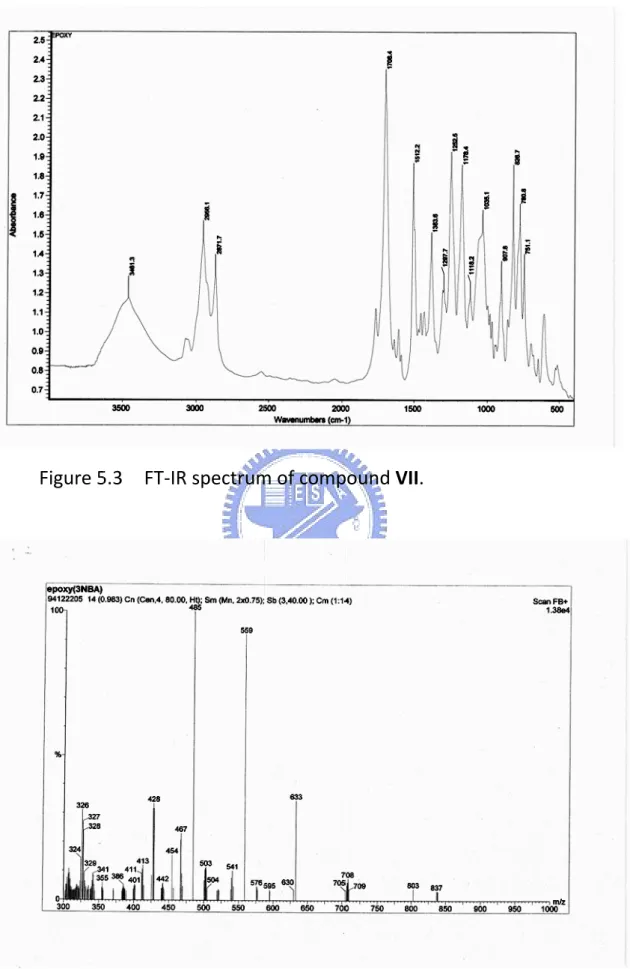
5.3 FT-IR spectrum of compound VII ……… 117
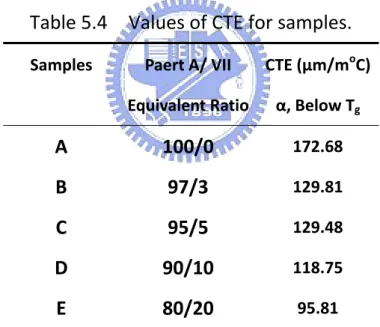
5.4 Fab Mass spectrum of compound VII……… 117
5.5 Dynamic DSC thermograms for the epoxy/BT resin blends……… 119
5.6 Sequences of Alder-Ene Reaction……… 120
5.7 TGA thermograms of samples……… 122
5.8 TMA thermograms for samples ……… 124
5.9 DMA thermograms showing Storage modulus versus tempera -ture for samples………126
5.10 DMA thermograms showing dampin peaks(Tan δ) of samples ……… 127
六、 氰酸脂/BMI/環氧樹脂三成分系共交聯動力學研究 …… 131
6.1 FTIR absorbance spectra for the reactions of LECY/ Epoxy at 140 o C.for various time (At, t in mins.)… 137 6.2 Difference spectra (At–Ao, t is in mins.) for the reaction of LECY /Epoxy at 140 o C for various time…… 141
6.3 FTIR absorbance spectra for the reactions of LECY/BMI at 160 oC for various times (At, t in mins) ……… 143
xx
thereactions of LECY/ BMI at 160 o
C……… 144 6.5 FT-IR absorbance spectra for the reactions of LECY/BMI
/EPOXY at 140 o
C for various time (At, t in mins) … 145
6.6 Difference spectra (At-Ao, t in mins) the reaction of
LECY/ BMI/ Epoxy at 140 o
C for various time……… 146 6.7 Plot of conversion,α, versus reaction time t for the
LECY/Epoxy System……… 148
6.8 Plot of dα/dt vs αfor LECY/Epoxy system ……… 149 6.9 Plot of ln[(dα/dt)/(1-α)n
-k1] vs lnα for LECY/Epoxy
system……… 149
6.10 Plot of ln k vs 1/T for LECY/Epoxy system……… 150 6.11 Plot of conversion,α, versus reaction time t for the
LECY/BMI System……… 151 6.12 Plot of dα/dt vs αfor LECY/BMI system……… 152 6.13 Plot of ln[(dα/dt)/(1-α)n
-k1] vs lnα for LECY/BMI
system……… 152
6.14 Plot of ln k vs 1/T for LECY/BMI system……… 153 6.15 Plot of conversion,α, versus reaction time t for the
LECY/BMI/Epoxy System……… 155 6.16 Plot of dα/dt vs αfor LECY/BMI/Epoxy system………… 155 6.17 Plot of ln[(dα/dt)/(1-α)n-k1] vs lnα for LECY/BMI
/Epoxy system……… 156 6.18 Plot of ln k vs 1/T for LECY/BMI/Epoxy system………… 156
1
Co‐cured Materials Based on Novel Epoxies
and Novel BT Resins for Electronic Application
2
INTRODUCTION
We are in the midst of an electronics era. Almost every aspect of our daily life has been touched or assisted by electronic devices. This electronic revolution is only possible through our ability to miniaturize integrated circuits (ICs). Polymers play a significant role in achieving the current state‐of‐the‐art in microelectronics. They are not only found in final products such as housing of components, packaging of IC chips and intermetallic dielectric layers, but also employed extensively in major processing steps. Some specialty polymers most commonly used in microelectronics are polyimides, silicones, and epoxies. Traditionally, liquid photoresists and polyimides are used in the fabrication of ICs. Printed circuit boards (PCBs) require composite substrates reinforced with epoxy and/or phenolics. IC encapsulating materials and die attach adhesives are also primarily epoxy composites. Polyimides and polyesters are employed in flexible circuit board manufacture. Siloxane and polyimides are used in intermetallic dielectric layers. High resistivity, high breakdown voltage, low dielectric constant and easy of processing make these polymers particularly suitable as insulating layers in multi‐level interconnections, intermetallic dielectrics and IC packaging. Low dielectric constant results in short media propagation times, low signal coupling and high characteristic impedance lines. Other rationale for the adoption of these specialty polymers are resin curing, moisture diffusion, mechanical strength, thermal stability,…,etc.
Furthermore, for optimal processing, an accurate knowledge of the kinetics of curing and polymer conversion as functions of curing
3
temperature are vital.
In this study, novel materials based on epoxy and cyanate ester containing siloxane and imide groups are designed and prepared, and are expected to possess most of the above properties for potential microelectric application. Chapter I deal with siloxane‐ and imide‐containing tetrafunctional epoxy, which are designed mainly to improve dielectric constant, dissipation factor, thermal stability and mechanical strength. In chapter II, incorporating of POSS into epoxy resin results in reduction of dielectric constant with sacrifice of some other properties. BT resin, i.e., blend of cyanate ester and bismaleimide (BMI), possesses good mechanical strength and is currently used in packaging material. However, lack of resin curing and dielectric constant are the drawback of the commercial BT resin. Therefore, focus on the improvement of resin curing, dielectric constant and further performance improvement is the goal of studies in chapters III, IV and V, where siloxane , imide and allyl groups are incorporated into cyanate ester,and blended with equivalent amounts of modified BMI to form novel BT resin. Co‐cured materials are then prepared by co‐curing this unique BT resin with different amounts of epoxy to improve the resin curing and material performances. In chapter V, co‐cured materials are also prepared by blending BT resin with commercial epoxy to form part A resin, which then, further co‐cured with different amounts of siloxane and imide containing epoxy resin (VII). This novel material possesses most of the properties required for microelectronic application. For better understanding of optimal application, polymer conversion and
4
curing behavior are also investigated in chapter III. Properties of siloxane and imide containing BT / epoxy co‐cured material are studied in chapters III, IV, and V. Study of curing kinetics is given in chapter VI.
5
Chapter I
Synthesis, Curing Behavior and properties of Siloxane and
Imide‐containing Tetrafunctional Epoxy
6
1.1 ABSTRACT
A novel tetrafunctional epoxy resin contain siloxane and imide groups, i.e., N,N,N’,N’‐tetraglycidyl‐bis(4‐aminophenyl)‐5,5’ (1,1,3,3‐ tetramethyl‐1,1,3,3‐disiloxane‐bisnorbornane‐2,3‐dicaroximide, was synthesized and characterized. The curing behavior of this resin and the properties of the its cocured material with commercial tetraglycidyl m‐xylenediamine (GA‐240) was studied. Functional group changes during cocuring reactions were investigated with FTIR. Kinetic parameters were analyzed with dynamic DSC. Thermal properties were measured with TGA, TMA and DMA. Curing kinetics revealed that this novel tetrafuctinal epoxy indicated a lower activation energy and lower curing temperature than GA‐240. The cocured materials, due to the presence of siloxane and imide groups in the polymer matrix, show higher glass transition temperature, better dimensional stability and toughness, and also enhanced properties than pure GA‐240. Key words: siloxane and imide‐containing tetrafunctinal epoxy, co‐cured materials, electronic packaging, toughness, enhanced properties. 1.2 INTRODUCTION Epoxy resin, because of its easy processing and excellent adhesion, is one of the most widely used thermosets, especially in the field of package and PC board in electronics industry. Demand for the epoxy resin in the new era of electronic application lies in improved thermal properties, better toughness, lower dielectric constant, lower curing temperature and easy processing, etc. Furthermore, the vertsification of
7
the bulk state curing would result in internal residual stress in the polymer matrix, and subsequently leads to device failure. Siloxane, due to its flexibility, when incorporated in the epoxy chain, would therefore improve the toughness and lower the internal residual stress. In addition, since siloxane is an excellent water repelling material, an epoxy resin containing such a siloxane group would somehow show a lower dielectric constant. Similar ideal of molecular design was also applied to imide group for its good mechanical property and long term reliability. Tetrafunctional epoxide was deliberately designed in this new resin to enhance the cross‐linking and further improve its glass transition temperature and mechanical properties. Synthesis and characterization of other tetrafunctioinal epoxies can also be referred from literature [1(a), 1(b)].Since the commercially available tetraglycidyl m‐xylediamine ( electronic grade, GA‐240) is relatively hard and brittle, When GA‐240 is blended with this siloxane and imide‐containing tetrafunctional epoxy, the cocured material apparently show enhanced thermal properties and toughness, but lower residual stress. In this work, we would like to report such a study. 1.3 EXPERIMENTAL 1.3.1 Chemicals 5‐norbornane‐2,3‐dicarboxylic anhydride (i.e., nadic anhydride) was purchased from Merck Co.. Tetramethyldisiloxane was bought from Lancaster Co., catalyst. Platnum‐cyclovinyl‐methylsiloxane complex (as catalyst for hydrosilation) was provided from UCT, and 4,4’‐methylene
8 dianiline, from CVC, epichlorohydrin from Tedia Co., and 4‐nitroaniline from Janssen Co.. Solvents toluene and N,N‐dimethyl‐ formamide were purified by adding calcium chloride and were distilled. All other chemicals were used directly without further purification. 1.3.2 Instruments All 1H‐NMR spectra were obtained with Varian Unity 300MHz NMR, using CDCl3 as solvent. IR spectra were obtained from Avatar 360 FT‐IR
(Nicolet Co.) with a resolution of 4 cm‐1. Dynamic differential scanning calorimeter (DSC) thermograms were performed with Seiko Instrument DSC 200 under 100ml/min of nitrogen flow with heating rates of 3, 5, 10 and 15 oC/min. Thermogravimetric analyzer (TGA) and thermo‐ mechanical analyzer (TMA) thermograms were performed with Du Pont TA 2950 and 2940 with a heating rate of 10 oC/min. Samples with dimension of 4 x 1 x 0.2 cm were tested with dynamic mechanical analyzer (DMA) at 1 Hz with a heating rate of 3 oC/min., temperature ranging from 30 to 300 oC. Dielectric constants of cured samples were measured with a DEA Du Pont 2970 dielectric analyzer at 1MHz. 1.4 Preparation of Materials Synthesis of 5,5’‐(1,1,3,3‐tetramethyl‐1,1,3,3‐disiloaxanedialyl) bisnorbornane‐2,3‐ dicarboxylic anhydride (I) Nadic anhydride (131.33g, 0.8mole) in 500 ml of toluene, to which tetramethyldisiloxane (53.6 g, 0.4 mole) and catalyst platinum‐cyclovinyl methyl‐siloxane complex were added and stirred at 80 oC for 46 hours. The reaction mixture was concentrated to precipitate the product. The product was
9 recrystallized from ether, giving a white crystal with mp. Of 135‐7 oC (70 % yield), which shows 1H‐NMR(CDCl 3,ppm):δ:0.03~0.05(m,12H),0.63~0.68(m, 2H),1.56~1.68(m,8H),2.75~2.78(m,2H),2.85(m,2H), 3.39~3.43(m,4H)
IR: anhydride νc=o 1856, 1780 cm‐1; siloxane νsi‐o‐si 1082 cm‐1,νc‐si 1225
cm‐1. Synthesis of N,N’‐bis(4‐aminophenyl)‐5,5’‐(1,1,3,3‐tetramethyl‐ 1,1,3,3‐ disiloxanedialyl)‐bisnorbornane‐2,3‐dicarboximide (IIb) Into a three necked flask, I (11.58 g, 0.025 mole) in 20 ml DMF and 4‐nitroaniline (7.60 g, 0.055 mole) in 20 ml DMF were charged. Reaction proceeded at ambient temperature for 6 hours, then benzene was added, imidization proceeded in a Dean‐Stark apparatus. After removal of water, a yellow solid (IIa) was obtained . IIa (7.07 g, 0.01 mole)was dissolved in 300 ml ethanol and Pd/C (0.4 g) was added under Hydrogen atmosphere to reduce the nitro group into NH2 at room temperature for 24 hours. A red product of IIb was obtained (5.67 g, 88% yield). 1H‐NMR(CDCl 3,ppm)shows:δ:0.00~0.01(m,12H),0.61(m, 2H),1.54~1.61(m,8H),2.72(m,2H),2.78(m,2H),3.15(m, 4H),3.66(s,4H),6.59~6.63(d,4H),6.87~6.90(d,4H)
IR: imide, νc=o 1768, 1705 cm‐1; siloxane, νsi‐o‐si 1082 cm‐1,νc‐si 1225 cm‐1.
Synthesis of N,N,N’,N’‐tetraglycidyl‐bis(4‐aminophenyl)‐5,5’‐(1,1,3,3‐ tetramethyl‐1,1,3,3‐disiloxanedialyl)‐bisnorboenane‐2,3‐dicarboximi‐d e (III) IIb (20.00 g, 0.031 mole), epichlorohydrin (96.79 ml, 1.24 mole),
10
was refluxed at 110 o C for 8 hours. Product III was extracted with dichloromethane, washed with water and dried with MgSO4. A
greenish solid (20.6 g, 76.7 % of yield) with mp of 127‐31o C was isolated. 1H‐NMR and IR spectra of compound III are given in Figures 1.1 and 1.2, where 1H‐NMR(CDCl3,ppm)shows:δ:0.04~0.06(m,12H),0.67 (m,2H),1.60(m,8H),1.82~1.87(m,4H),2.57(m,4H),2.78 ~2.85(m,8H),3.16~3.23(m,8H),6.83~6.85(d,4H),7.04 (d,4H) IR shows: epoxide, ν910 cm‐1.
This tetrafunctional epoxy (III) was titrated by the pyridinium chloride method [2] to find an epoxide equivqlent weight (EEW) of 432.
1.5 Preparation of Cocured Materials
Blends of GA‐240/III/MDA in equivalent ratios of (A) 1/0/1, (B) 0.95/0.05/1, (C) 0.9/0.1/1, (D) 0.85/0.15/1, (E) 0.8/0.2/1, and (F) 0/1/1 were mixed thoroughly and was each filled into DSC aluminum pan and scanned from 30 to 300 oC under 100ml/min of nitrogen flow at a Table 1.1 Curing conditions of samples Sample Equivalent Ratio Curing Conditions [Temp(℃)/Time(hr)] GA‐240/Ⅲ/MDA A(1/0/1) 150/2 + 180/4 + 200/2 B(0.95/0.05/1) 140/2 + 170/4 + 200/2 C(0.9/0.1/1) 140/2 + 170/4 + 200/2 D(0.85/0.15/1) 130/2 + 160/4 + 200/2 E(0.8/0.2/1) 130/2 + 160/4 + 200/2
11
heating rate of 10 oC/min. Maximum curing exothermic peak for each sample was found at (A) 129.9 oC, (B) 173.1 oC, (C) 170.3 oC, (D) 166.6 oC, (E) 165.2 oC and (F) 152.2 oC. Test samples were then cured at the three stages shown in Table I. 1.6 RESULTS AND DISCUSSIONS The synthesis of siloxane and imide containing tetrafunctonal epoxy (III) is given in the following scheme: Scheme 1. Synthesis of Tetrafunctional epoxy (III) O O O Si O Si CH3 CH3 CH3 CH3 H H O O O Si CH3 CH3 O Si CH3 CH3 O O O + 2 Pt complex toluene,80℃ Ⅰ O Si Si CH3 CH3 CH3 CH3 O O O O O O NO2 H2N + 2 DMF/Benzene H2 Pd / C -H2O Ⅱa Ⅱb O Si Si CH3 CH3 CH3 CH3 N N O O O O O2N NO2 O Si Si CH3 CH3 CH3 CH3 N N O O O O H2N NH2
N H2 1.6 Com and act (Fig Fig N N NaOH (aq) 110 ℃ .1 Struc mpound I d tetramet ive Pd com gure 1.1). gure 1.1 1 N O O O O N ctures Det was prepa thyldisilox mplex. T In the b H NMR sp Si O Si CH3 CH3 CH3 CH3 N N terminatio ared from xane in the Trace of th beginning, pectrum o 12 N O O N O O III on m the hydro e molar ra he reaction the two v f compou NH2 Si O Si CH3 CH3 CH3 CH3 osilylation atio of 2:1 n was mon vinylic H’s nd Ⅰ. + N O O n of nadic under the nitored wi in norbor O C 4 N anhydride e catalysis ith 1H‐NM nene occu Cl O O e s of MR urs
at δ ppm new wh and evid abs and abs abs CH3 δ 0.63 ppm m. Afte w absorpt ile δ 0.03 d those at dence of p Figure 1.2 sorption o d 1220 ㎝‐ sorption a sorptions a 3 stretchin For the m, and the er 24 hour ion at δ 0 to 0.05 pp δ 0.63 to producing 2 FT‐IR sp of anhydrid ‐1(anhydr t 1680 ㎝ at 1083 ㎝ ng of the p e structure e two Si‐H rs of react .6 ppm wa pm indicat 3.43 ppm g I. FT‐IR ectrum of de at 1782 ride,C—O ㎝‐1 (C=C s ㎝‐1(Si—O product co e determi 13 H’s in tetra ion, both as observe ting 12 H’s m indicatin spectrum f compoun 2、1852 ㎝ O—C stret stretching) O—Si stret onfirms th ination of methyldis absorptio ed, indicat s of the 4 g the 4 H’ m of I (Figu nd Ⅰ. ㎝‐1 anhyd tching). ) of norbo tching, ) e structur IIb, the IR siloxane oc on disappe ting 2 H’s methyl gr ’s on anhy ure1. 2) sh dride,C=O The disa ornene , th and 1258 re of I. R absorpti ccurs at δ eared and at the C‐S roups on S ydride, an hows an O stretchi ppearanc he new 8 ㎝‐1(Si— on at 176 4.7 a Si, Si, ng) e of — 8、
170 imi Figu and 1H‐ silo am 05 ㎝‐1(i de group ure1. 3 FT The co d 3369 cm NMR spec oxane atδ ine, and mide,C= (Figure1.3 T‐IR spectr oupled do m‐1 proves ctrum (Fig 0.00~0.0 δ6.59 ~ =O stretc 3). rum of com ublet of a s the redu gure 1.4) s 01 ppm, ~ 6.90 pp 14 ching)str mpound asymmetri uction of n shows 12 4 H’s atδ pm for t rongly sup Ⅱb. ic N‐H stre nitro grou H’s of tetr δ3.66 ppm the 8 H’ pports the etching oc up into pr ramethyl g m for the s on be e existence ccurs at 3 imary am groups in two prim nzene rin e of 460 ine. the mary ngs.
Figu All 1.5 320 ure1. 4 1H these evid ) at 910 00‐3500 ㎝ H‐NMR spe dence con ㎝‐1(e ㎝‐1 ,(νO‐H) i ectrum of nfirms the poxy ring indicates t 15 compoun structure g stretchi that III is a nd Ⅱb. e of IIb. FT ng)and an oligome T‐ IR absor broad a er. rption (Fig bsorption gure n at
The Hf ppm δ 3 (4H Figure1. 5 e 1H‐NMR at δ 0.67 m (4H),H .16~3.23 H). 5 FT‐IR sp spectrum 7 ppm (2H Hn at δ 2.57 3 ppm (8H ectrum of m (Figure 1 H) ,Hd.e a 7 ppm (4H H),Hi at δ 16 f compoun 1.6) shows at δ 1.60 p H),Hb.c.l a δ 6.83~6. nd Ⅲ. s Hg at δ 0 ppm (8H) t δ 2.78~ 85 ppm (4 .04~0.06 ,Hm:at ~2.85 ppm 4H),Hh a 6 ppm (12H δ 1.82~1 m (8H),Ha at δ 7.04 p H), 1.87 a.j at ppm
Figu Wh the Hh’s of i spe of I O O ure 1.6 1H here Hh rep e epoxide, s, and 4 H ntegrated ectrum (Fi II. A rea N O O H‐NMR spe presents o and from m’s. If th d areas of gure 1.6) asonable s ectrum of one H on t the struc he product Hh to Hm = shows thi structure o N O O 17 compoun the benzen cture of III, t III contai = 1: 1. It is s is the ca of III is giv O Si Si CH3 CH3 CH3 CH3 e f g nd Ⅲ. ne ring , H , one mole ins tetragl s observed ase, thus c ing in the N O O a b c d f Hm represe ecule of II lycidyl gro d that 1H‐N conforms t following N h i ents one H I contains oup, the ra NMR the structu : O O j k l H on s 4 atio ure m n
III w equ mo ver pre O O n = 1.6 are F was titrate uivalent w olecular we ry close to epared is a N 0.95 .2 Dyna Maxim e listed in F Figure1.7 B F ed by the H weight (EEW eight of 17 1, which a dimmer. O Si S CH3 CH3 C C N O O amic DSC mum exoth Figure 1.7 Dynamic D B=0.95/0. F=0/1/1. HCl‐pyridi W) of 443 728. The reveals th Si CH3 CH3 N O O hermic pea and are s DSC of sam 05/1;C=0 18 ne metho was foun e calculate hat the tet N CH CH2 O O CH2 CH OH OH aks for var summarize mples(GA‐ 0.9/0.1/1 od [2], and d, which m ed repeati trafunction O CH2 CH OH CH CH2 OH O n rious blen ed in Table ‐240/Ⅲ/M ;D=0.85/ d an epoxi means III h ing unit, n nal epoxy N N O O nds of GA‐ e 1.2 MDA),A= 0.15/1;E de has a n, is 0.97, thus O Si Si CH3 CH3 CH3 CH3 240/III/ M =1/0/1; E=0.8/0.2/ N O O N MDA /1; O O
19 Table 1.2 The maxium exothermic temp. of samples (MDA) Sample Equivalent Ratio Max. exothermic temp.(℃) GA‐240/Ⅲ/MDA A(1/0/1) 179.9 B(0.95/0.05/1) 173.1 C(0.9/0.1/1) 170.3 D(0.85/0.15/1) 166.6 E(0.8/0.2/1) 165.2 F(0/1/1) 152.2 It is obvious that Sample A , GA‐240 cured with equivalent MDA, shows the highest curing temperature at 179.9 ℃. As more III incorporated into GA 240, The curing reaction shifts to lower
temperature. Sample F, only III cured with equivalent MDA, shows
a maximum exothermic temperature at 152.2℃. As III contains a tertiary amine, (imide group), which played a catalytic effect on the epoxy cure [3]. This explain the reason why blends containing more quantity of III would show lower exothermic temperature. 1.6.3 Curing Kinetics The activation energy of curing reaction can be studied with dynamic DSC [4‐8]. Figures 1.8 gives the typical dynamic DSC thermograms for sample E at heating rates of 3℃/min,; 5℃/min,; 10℃ /min , and 15℃/min. According to the method developed by Kissinger
20
[4,5,9], the activation energy, Ea , can be calculated by :
2.303 d log(Φ/Tm2) /d(1/Tm) = -Ea/R (1)
where Tm is the Maximum peak temperature in K,
Φ is the heating rate in℃/min, R is Gas constant (8.314 JK‐1mol‐1), and Ea is the activation energy (KJ/mole). A plot of ln(Φ/Tm2) versus 1/Tm
is given in Figure 1.9. The calculated Ea values are listed in Table 1.3.
Figure 1.8 Typical dynamic DSC of sample (GA‐240/Ⅲ/MDA=0.8/0.2/1)
with different heating rate.
21 Figure 1.9 1/Tm V.S ln(Φ/Tm2) of sample (GA‐240/Ⅲ/MDA=0.8/0.2/1) Table 1.3 Kinetic data of samples Sample Equivalent Ratio Heating Rate (℃/min) Ea, KJ /mole 3 5 10 15 GA‐240/Ⅲ/MDA A(1/0/1) 151 163.1 179.9 193.6 55.51 B(0.95/0.05/1) 142.8 156 173.1 184.9 53.80 C(0.9/0.1/1) 139.6 151.7 170.3 181 52.97 D(0.85/0.15/1) 137.1 148.3 166.6 179.1 51.81 E(0.8/0.2/1) 135.2 147.6 165.2 178.1 50.75
22 Result shows that Sample A has the highest activation energy of 55.51 KJ/ mole. As more III blended into GA‐240, lower activation energies were found. This result is in consistent with the finding in Maximum exothermic peak shift (Figure 1.7 and Table 1.2), because imide group played a catalytic role during curing reaction. Furthermore, the tetrafunctonal epoxy III contains a flexible siloxane in the main chain which may, in part, show higher chain mobility and thus account for its easy processing. 1.6.4 Functional Group Changes during Curing Reaction Typical functional group changes during curing reactions for Sample E is given in Figure 1.10, and the difference spectra using the absorbanceof Si‐O‐Si at 1050 to 1060 cm‐1 as internal Figure 1.10 FT‐TR of sample (GA‐240/Ⅲ/MDA=0.8/0.2/1),A=initial; B=130℃/10mins;C=160 /10mins℃ ;D=160 /20mins℃ ; E=200℃/10mins. 910 A B C D E
23 Figure 1.11 FTIR diffeeence spectra for the reactions of sample E (GA‐240/Ⅲ/MDA=0.8/0.2/1)at 180 oC for various times (At, t in mins). reference, is giving in Figure 1.11 The absorption of epoxide at 910 cm‐1 decreases with time. The absorptions of NH2 (from the curing agent,
MDA) at 3460 and 3369 cm‐1 are clearly decreased, and eventually broadened because of overlapping with the absorption of newly produced OH group. 1.6.5 Gel Fractions The fully cured samples were continuously extracted with acetone in Soxhlet extractor for 24 hours to extract the uncured portions. Gel fractions of samples are listed in Table 1.4. It is found that all the gel
24 fractions of the 5 samples are high enough over 97%, meaning that these samples are potentially easy to process and contains high cross‐linking. Table 1.4 Gel fraction results of samples Sample Equivalent Ratio Gel fraction (%) GA‐240/Ⅲ/MDA A (1/0/1) 98.3 B (0.95/0.05/1) 97.6 C (0.9/0.1/1) 97.4 D (0.85/0.15/1) 98.0 E (0.8/0.2/1) 97.1 1.6.6 Coefficients of Thermal Expansion (CTE)
The first thermal expansion coefficient (α1) of each sample was measured from the slope of TMA thermogram before Tg ; the second thermal expansion coefficient (α2) was read from the slope of same TMA thermogram after Tg (Figure 1.12) and the values are listed in Table 1.5.
Figu Sin ind rela the co‐ exp co‐ dev dim also mo abo exp ure 1.12 T B Each TM ce all the icated in atively low e pure GA‐ cured sam pansion co cured ma vice fabric mensional o are, pr olecular int ove Tg, th pansion co TMA therm =0.95/0.0 MA was t se sample Table 1.5 w coeffici ‐240 (sam mples, It i oefficient terials hav cation. T stability o obably in teraction he co‐cur oefficients mograms o 05/1;C=0 tested in es are hig 5, they ar ent of th ple A in w is found t can be e ve improv The low t of these s n part, du of imide g red mater s than the 25 of sample 0.9/0.1/1 a tempe hly crossl re, therefo ermal exp which GA‐2 that as III
effectively ved dimen
thermal e amples ar ue to the
group in I rials appa e pure GA s(GA‐240/ ;D=0.85/ erature ra inked wit ore, therm pansion b 240/III/M is added y reduced nsional sta expansion re due to e presence II. When t arently in A‐240, pre /Ⅲ/MDA) /0.15/1;E ange of 3 h high ge mally stab before Tg. DA = 1/0/ into GA‐ d. That ability and coefficie high cross e of hard the tempe dicate hig esumably ),A=1/0/ E=0.8/0.2/ 30 to 280 el fractions ble and sh . Compa /1) with ot 240, ther means th d are good nt and go s‐linking a d and str erature ra gher ther because /1; /1. 0 C. s as how ared ther rmal hese d for ood and, ong ises rmal the
26
flexible siloxane moiety in this tetrafunctional epoxy III shows much higher mobility, leaving larger free volume in the co‐cured materials. Table 1.5 Thermal expansion coefficients of samples Sample Equivalent Ratio CTE1 α1 (μm/m℃) * CTE2 α2 (μm/m℃) ** GA‐240/Ⅲ/MDA A(1/0/1) 79.6 136.9 B(0.95/0.05/1) 56.55 108.4 C(0.9/0.1/1) 55.95 141.7 D(0.85/0.15/1) 53.68 203.3 E(0.8/0.2/1) 55.33 1234.6 *α1: CTE before Tg, ** α2: CTE after Tg 1.6.7 Thermal Stability The on‐set tmperature of 5 % weight loss and %residual weight at 450 o C are found from TGA thermograms (Figure 1.13) and are listed in Table 1.6.
27 Figure 1.13 TGA thermograms of samples(GA‐240/Ⅲ/MDA),A=1/0/1; B=0.95/0.05/1;C=0.9/0.1/1;D=0.85/0.15/1;E=0.8/0.2/1. Table 1.6 Thermogravimetric analysis of samples Sample Equivalent Ratio 5% Weight Loss Temp(℃) Residue Weight (%) at 450℃ GA‐240/Ⅲ/MDA A(1/0/1) 302.2 43.3 B(0.95/0.05/1) 278.3 47.8 C(0.9/0.1/1) 283.6 53.4 D(0.85/0.15/1) 257.4 54.8 E(0.8/0.2/1) 251.4 60.7 103
28 TGA thermogram of Sample A indicates one stage of pyrolysis. While other samples pyrolyze in two stages but show higher residual weight, which is probably due to the presence of thermally stable imide group [10]. 1.6.8 Dynamic Mechanical Analyzer Damping peaks (tanδand Storage Modulus(G') of samples are giving in Figures 1.14 and 1.15 and data are listed in Table 1.7. Figure 1.14 Tanδof samples(GA‐240/Ⅲ/MDA),A=1/0/1;B=0.95/0.05/1; C=0.9/0.1/1;D=0.85/0.15/1;E=0.8/0.2/1.
29 Figure 1.15 Storage modulus of samples(GA‐240/Ⅲ/MDA),A=1/0/1; B=0.95/0.05/1;C=0.9/0.1/1;D=0.85/0.15/1;E=0.8/0.2/1. Table 1.7 Storage modulus and glass transition temperatures of samples Sample Equivalent Ratio Storage Modulus (MPa) Tg (℃) GA‐240/Ⅲ/MDA A(1/0/1) 1775 217.1 B(0.95/0.05/1) 1210 213.8 C(0.9/0.1/1) 1099 226.3 D(0.85/0.15/1) 636 227.1 E(0.8/0.2/1) 443 185.5,228.5
30
GA‐240 has a Tg of 217.1℃, as III incorporated into GA‐240, these
co‐cured samples still have relatively high Tg’s. Sample E shows two Tg’s at 228.5 ℃ and a shoulder at 185.5 ℃ (probably a transition of
siloxane), indicating possible phase separation. Therefore, 20% of III is the maximum amount that can be incorporated into GA‐240, or otherwise, more III might cause drawback in the mechanical property because of phase separation [11]. Sample A has a storage modulus of 1775 MPa, other samples indicate storage modulus decreases as III incorporated. This is because the existence of soft siloxane in the samples. However, the rubber siloxane play a toughness role in the samples [11]. In general, high cross‐inking materials are hard and brittle. The siloxane portions in III, when incorporated into a high cross‐linking material, clearly improve the toughness of these samples, as can be seen from the increased damping peak height and the area of Tanδ in Table VIII. This phenomenon has been discussed in literature [12,13]. Furthermore, it appears that the G’ profiles of samples A, C and D near Tg’s are not regular (Figure 1.14). This phenomenon happens presumably because of incomplete cure. As incompletely cured samples are reheated during DMA test, probably post‐cure would occur to some extent, leading to some fluctuations as observed from the G’ profiles.
31 Table 1.8 DMA results (peak height and area of Tanδ) of samples Sample Equivalent Ratio Peak height Area of Tanδ GA‐240/Ⅲ/MDA A(1/0/1) 0.24 13.8 B(0.95/0.05/1) 0.37 20.6 C(0.9/0.1/1) 0.40 25.4 D(0.85/0.15/1) 0.45 29.0 E(0.8/0.2/1) 0.48 34.4 1.6.9 Dielectric Constants Dielectric constants and dissipation factor of cured samples were measured with a DEA Du Pont 2970 dielectric analyzer at 1 MHz of frequency and data are listed in Table 1.9. In general, dielectric constant and dissipation factor would be reduced as water repellent material is incorporated in a polymer blend [7]. Unfortunately, this is not the case expected as observed from data. As it is well known that OH group produces when epoxy cures [3]. The high polarity of OH group in III would no doubt play a drawback in dielectric constant and dissipation factor. Furthermore, since GA‐240 and III each contains four epoxides which must produce lots of OH groups after they are cured. This probably explain why relative high dielectric constants and
dissipation factors are observed for these samples. Use of less MDA as curing agent could be one way to lower the dielectric constant and dissipation factor. Because less diamine used would produce less OH’s
32 but in the meantime cause less cross‐linking. It seems apparently, dielectric constant and mechanical properties must compromise in some way. Table 1.9 Dielectric constant and dissipation factor of samples Sample Equivalent Ratio Dielectric constant Dissipation factor GA‐240/Ⅲ/MDA A(1/0/1) 5.71 0.036 B(0.95/0.05/1) 5.16 0.036 C(0.9/0.1/1) 5.43 0.038 D(0.85/0.15/1) 7.21 0.081 E(0.8/0.2/1) 6.02 0.069 1.7 CONCLUSSION Since commercial tetrafunctional GA‐240 is a relatively hard and brittle material. Blending siloxane and imide‐containing tetrafunctional epoxy III into GA‐240 to improve the physical properties appears permissible. The imide group in III contains tertiary amine and played a catalytic role to the curing reaction of epoxy and lower the activation energy and curing temperature. The soft rubber section of siloxane played a toughness role. The co‐cured materials apparently showed improved dimensional stability, lower thermal expansion coefficient, and enhanced toughness. However, increased dielectric constant of samples is the drawback because more OH’s were produced in the cured material. This drawback could be possibly improved by using less MDA as curing agent.
33 1.8 REFERENCES 1. (a) A.M. Atta, R. Mansour, and M. I. Abdou, J. Polym. Res., 12(2), 127‐138 (2005). (b) S. G. Hong, C. K. Chan, and C. C. Chuang,J. Polym. Res., 12(4), 295‐303 (2005). 2. H. Lee and K. Neville, edited, “Handbook of Epoxy Resins”, McGraw‐Hill, New York, 1967, ch. 4. 3. K. J. Saunders edited, “Organic Polymer Chemistry”, Chapman and Hall, London, 1973, ch. 16, p.384. 4. S. T. Ozawa, J. Thermal Analysis, 9, 369‐373 (1976). 5. M. k. Um. I. M. Daniel and B. S. Hwang, Composite Sci. & Technol., 62, 29‐40 (2002). 6. J. A. Ramos, N. Pagani, C. C. Riccardi, J. Borrajo, S. N. Goyares and I. Mondragon, Polymer, 46,3323‐3328 (2005). 7. P. Masto, E. Martuscelli, G. Ragosta, and L. Mascia, Polymer, 42, 5189‐5198 (2001). 8. D. Rosu, C. N. Cascaval, F. Mustagia, and C. Ciobanu, Thermochimica Acta, 383, 119‐127 (2002). 9. C. P. Reghunadham Nair, K. K.rishman and K. N. Ninan, Thermochimica acta, 359, 61‐69 (2000). 10. T. S. Yang, J. Chen, and L. Fan, Europ. Polym.J, 43, 1470‐79 (2007) 11. .C. Keith Riew, edited, “Rubber‐Toughened Plasyics”, Advances in chemistry series 222, ACS, Washington DC, 1989. 12. M. S. Lin and S.T. Li, Polymer, 38(1), 53‐58 (1997). 13. J. Jang and S. Shin, Polymer, 36, 1199‐1207 (1995).
34
Chapter II
Low Dielectric Constant POSS‐containing E
poxy Cured
with POSS‐containing Nadic Anhydride and Siloxane and
Imide‐containing Anhydride
35 2.1 ABSTRACT The commercially available epoxy (ERL‐4221) was with both POSS‐containing nadic anhydride (POSS‐A) plus siloxane‐ and imide‐containing anhydride( I). POSS‐A was prepared by hydrosylilation of nadic anhydride with dimethylsilane cyclopentyl‐POSS schwab hydride. The structure of POSS‐A was confirmed by 1HNMR and IR spectra. The thermal properties of cured epoxy were characterized with DSC, TGA and TMA. Dielectric constant was measured with Du Pont DEA 2970 dielectric analyzer at 1 MHz. Experimental result revealed that increasing POSS content results in a decrease of dielectric constant. However, the decreased dielectric constant appears to be compensated by the polar OH groups produced during epoxy curing reaction. The bulky POSS moiety probably hindered the epoxy curing reaction, resulting in incomplete cure and relatively low gel fraction. Consequently the observed Tg can not be increases. Keywords: POSS‐containing nadic anhydride, cured epoxy, thermal properties, decreased dielectric constant. 2.2 INTRODUCTION POSS molecule has been successfully incorporated into linear polymer chain to form nanocomposite materials since 1993. These materials showed improved thermal and mechanical properties. Examples found in literature, including methacrylates [1], styrenics [2], norbornens [3,4] ,urethanes [5], cyanate ester [6],and others [7‐11] . In
36 view of the POSS molecule, its cubic structure is constructed from Si‐O‐Si bonds with a cyclopentyl ring connected to each Si‐ atom. Such a unique nano scale structure would remain in the polymer matrix, resulting in nanocomposite as reported in literature. On the other hand, since the Si‐O‐Si moiety is hydrophobic, and therefore, when POSS molecule is incorporated into polymer matrix, it would be expected to show a decreased dielectric constant. Our previous report [12] on a study of co‐cured tetrafunctional epoxy, although showed enhanced thermal and mechanic properties, however, a drawback in an increased dielectric constant was inevitablly observed because lots of polar OH groups produced during epoxy cure. Therefore, in order to enhance thermal, mechanical and dielectric properties, we are interested in preparing this material from di‐functional epoxy co‐cured with both POSS‐A and siloxane‐ and imide‐containg anhydride (I). 2.3 EXPERIMENTAL 2.3.1 Chemicals Dimethylsilane cyclopentyl‐POSS schwab hydride was purchased from Hybrid Plastics, USA. 5‐norbornene‐2,3‐dicarboxylic anhydride was bought from Merck Co. , teatramethyl disiloxane was shiped from Lancaster Co., platinum‐ cyclovinyl methylsiloxane complex from UCT Co., and 5‐amino‐ 1‐naphthol from Showa Co.. The commercial ly available difunctional epoxy resin (ERL‐4221) with an epoxy equivalent weight of 142 g/eq. and a structure of O O O C H2 O
37 was purchased from Union Carbide, USA. Determination of epoxy equivqlent weight (EEW) was done by the pyridinium chloride method [6]. 5,5’‐(1,1,3,3‐tetramethyl‐ 1,1,3,3‐disiloxa nedialyl)‐bis‐norbornane‐ 2,3‐dicarboxylic anhydride (anhydride I) was synthesized from the hydrosylilation of 5‐norbornene‐ 2,3‐dicarboxylic anhydride and tetra‐ methyldisiloxane, using platinum‐ cyclovinyl‐ methylsiloxane complex as catalyst, as reported in our previous paper [12]. Synthesis of 5‐norbornene‐2,3‐dicarboxylic anhydride dimethyl‐ silaneyl cyclopentyl‐POSS (POSS‐A) Into a three‐necked flask, nadic anhydride (2.46 d, 0.015 mole) in toluene (100 ml) together with platinum‐cyclo‐ vinyl methylsiloxane complex (0.1 ml) was charged, keeping temperature at 80 o C. Then, dimethylsilane cyclopentyl‐POSS schwab hydride (9.75 g, 0.01 mole) was added gradually. The reaction proceeded for 46 hours, and then, most toluene was removed by rotary evaporator. As acetonitrile (25 ml) ) was added to the above residue, white solid product (POSS‐A) was isolated (9.40 g, 82.6% yield), with mp
of 157‐8 o C after recrystallization. 1H‐NMR(Figure 1.1)shows δ:0.01
~0.2(m,12H),0.6(t,1H),0.95(m,Cy‐CH,7H) ,1.55(m,Cy‐CH2, 42H),1.72(m,Cy‐CH2,14H),2.8(m,1H),3.9(m,2H) 2.3.2 Sample Preparation Epoxy(ERL‐4221)/Anhydride I/POSS‐A in equivalent ratios of (A) 1/0.8/0, (B) 1/0.8/0.03, (C) 1/0.8/0.05, and (D) 1/0.8/0.1 were blended, together with each 1.8 x 10‐4 mole of 1‐methylimidazole as catalyst.
38 Samples were heated to pe‐cure, cure, and post‐cure, respectively at: Sample A: 125℃(1 hour), 140℃(3 hours), 160℃(1 hour) Sample B: 125℃(1 hour), 140℃(3 hours), 160℃(1 hour) Sample C: 130℃(1 hour), 150℃(3 hours), 165℃(1 hour) Sample D: 140℃(1 hour), 160℃(3 hours), 175℃(1 hour) 2.3.3 Instruments
1HNMR spectrum was performed with Varian Unity‐300 NMR spectrometer, using d‐chloroform as solvent. IR spectra were obtained with FTIR (Avatar 360FT‐IR, Nicolet Co with a resolution of 4 cm‐1), wave‐number scanned from 400 to 4000cm‐1. DSC (Differential Scanning Calorimeter) thermograms were obtained with Perkin‐Elmer DSC 7 instrument at a heating rate of 10℃/min. in a nitrogen flow of 80ml/min. TGA (Thermogravimetric Analyzer) thermograms were obtained with Du Pont TA 2950, at a heating rate of 10℃/min. in a nitrogen flow of 100ml/min. TMA (Thermomechanical analyzer) thermograms were measured with Du Pont TA2940instrument. Dielectric constants were tested with DuPont Dielectric Analyzer (DEA 2970) at 1 MHz. 2.4 RESULTS and DISCUSSIONS The synthesis procedures was followed according to Scheme I. Scheme I:
O O O Si O Si CH3 CH3 CH3 CH3 H H O O O Si CH3 CH3 O Si CH3 CH3 O O O + 2 Pt complex toluene,80℃
Ⅰ
39 Si Si O Si O Si O O O Si O Si O Si O O O O O Si Cy Cy Cy Cy Cy Cy Cy O SiH CH3 CH3 O O O Si Si O Si O Si O O O Si O Si O Si O O O O O Si Cy Cy Cy Cy Cy Cy Cy O Si CH3 CH3 O O O + toluene,80℃Pt complex Cy=cyclopentyl POSS‐A 5,5’‐(1,1,3,3‐tetramethyl‐1,1,3,3‐disiloxanedialyl)‐bis‐norbornane‐ 2,3‐dicarboxylic anhydride ( I )
was synthesized by hydrosylilation
of 5‐norbornene‐2,3‐dicarboxylic anhydride and tetra‐methyldisiloxane, using platinum‐cyclovinyl‐methylsiloxane complex as catalyst, as reported in our previous paper [12].Similar hydrosylilation was
employed
to prepare POSS‐Afrom
5‐norbornene‐ 2,3‐dicarboxylic anhydride (i.e., nadic anhydride) and dimethylsilane cyclopentyl‐POSS schwab hydride. The 1H‐NMR spectrum was used to monitor the peak changes. As hydrosylilation proceeded, it was found that the peak of the active hydrogen on the POSS gradually decreased, and eventually completely vanished after 46 hours of reaction. The 1H‐NMR spectrum of POSS‐A is given in Figure 2.1. FT‐IR(Figure 2.2)of POSS‐A shows the characteristic absorption of anhydride at 1850, 1778 ㎝‐1(anhydride,C =O stretching)and 1221 ㎝‐1(anhydride,C—O—C stretching). While the absorption of C=C at 1680 ㎝‐1 on the reactant nadic anhydride dispeared, indicating that POSS was successfully bonded to nadic anhydride.Figu Figu ure 2.1 1H ure 2.2 FT H‐NMR spe T‐IR spectr ectrum of rum of PO 40 POSS‐A SS‐A
41 2.4.1 Dynamic DSC The dynamic DSC thermograms are given in Figure 2.3, from which the maximum exothermic peak of each sample was found. The maximum exothermic peaks for was found at 140 to 160℃. It appears that as more POSS incorporated, the maximum curing exothermic peak shifts to higher temperature, presumably because the bulky POSS molecule hindered the curing reaction, and a higher temperature would compensate such a steric hindrance. Based on the collected data, proper curing condition was set for the material as mentioned in the experimental section. Figure 2.3 Dymamic DSC of system Ⅱ(ERL‐4221/anhydride/POSS‐A= 1/0.8 /0.05) 1/0.8/0 1/0.8/0.03 1/0.8/0.05 1/0.8/0.1
42 2.4.2 Functional Group Changes during Curing Reaction Figure 2.4 shows FTIR spectra for various compositions during curing reaction. Figure 2.5 shows the difference spectra, using benzene absorbance at νc=c=1511 cm‐1 as internal reference which was set to zero (the base line). It was found that the strong absorbances of epoxide at 904 cm‐1 and anhydride at 1780 and 1856cm‐1(anhydride C=O) gradually decreased with time. In the meantime, new s absorbances of ester at 1737 cm‐1 (νc=o) and OH at 3500 to 3600 cm‐1 (νOH) gradually increased.
All these fuctional groups changes account for the smoothly curing of epoxy by anhydride. Figure 2.4 FT‐IR spectrum of system Ⅱ(ERL‐4221/anhydride/POSS‐A=1/ 0.8/ 0.05) 130 ℃ /20min Start 140 ℃ /20min 155 ℃ /20min 165 ℃ /20min
![Figure 6.17 Plot of ln [(dα/dt)/(1‐α) n ‐k 1 ] vs lnα for curing LECY / BMI system at 130 o C (o),140 o C (▲ ), 150 o C (▓ ),and 160 o C (x).](https://thumb-ap.123doks.com/thumbv2/9libinfo/8753586.206369/178.892.143.789.132.1118/figure-plot-dα-lnα-curing-lecy-bmi-c.webp)
