國立交通大學
材料科學與工程研究所
碩士論文
利用銦-錫氧化物(ITO)廢料回收高純度銦材
Recycling high purity indium from ITO wasted
materials
研究生: 廖筱媛
指導教授: 朝春光博士
劉增豐博士
利用銦-錫氧化物(ITO)廢料回收高純度銦材
Recycling high purity indium from ITO wasted materials
學生: 廖筱媛 Student: Shiau-Yuan Liau 指導教授: 朝春光博士 Advisor: Dr. C.G. Chao 劉增豐博士 Dr. T.F. Liou 國立交通大學 材料科學與工程學系 碩士論文 A Thesis
Submitted to Department of Material Science and Engineering College of Engineering
National Chiao Tung University in partial Fulfillment of the Requirements
for the Degree of Master
in
Materials Science & Engineering July 2008
Hsinchu, Taiwan, Republic of China
I 利用銦-錫氧化物(ITO)廢料回收高純度銦材 研究生:廖筱媛 指導教授: 朝春光博士 劉增豐博士 國立交通大學 材料科學與工程研究所碩士班 摘要 內含銦-錫氧化物的 ITO 酸洗液或 ITO 汙泥中含有貴金屬銦,本研究 將整合濕法冶金與火法冶金,提供一具經濟價值之銦回收方法。銦於溶液 中為離子狀態,利用濕法冶金法(電析法或化學置換法)可將銦元素由溶液 中取出,另外火法冶金法(造渣技術)可將銦元素由固態廢料中取出,以上 所得的粗銦經真空熔煉後可使金屬銦與氧化層分離,可得到 3N(99.9%)高 純度之銦材。回收後的銦材由感應耦合電漿質譜儀、分析掃描式電子顯微 鏡、能量分散光譜儀、光學顯微鏡分析,從銦的顯微組織、成份分析之結 果,銦的純度可達到 3N。回收 ITO 酸洗液可以得到純銦 17.69g/L,且其 純度為 3N。回收酸洗液的過程中,以鎂粉當做濕法冶金中的置換劑,其 鎂粉的量約為4.67g/L,且操作溫度在室溫下便可。另外氫氧化鈉為火法冶 金中的造渣物質,添加量大約 6g/L 可以得到 17.69g/L 的純銦。回收 ITO 汙泥可以得到5.39g/L 的純銦,且其純度為 99.7%。在回收污泥的過程中, 以鋅粉作為濕法冶金中的置換劑,其鋅粉的量約為3g/L,且操作溫度需超 過攝氏 60 度才會反應完全。氫氧化鉀為火法冶金中的造渣物質,添加量
大約5.33g/L 可以得到 5.39g/L 的純銦。從濕法冶金中若可置換出越多的海 綿銦,則在火法冶金中獲得的銦含量也相對提高一些。在本實驗中,從酸 洗廢液置換出的海綿銦,經火法冶金提煉後銦的損失率為33%,由污泥廢 料中提煉出的純銦其損失率為24%。 本研究針對銦元素的回收方法、回收效率,結合濕法冶金及火法冶金 法,製作出高純度的銦材。另外,本研究亦將藉由此題目,深入探討銦之 電化學與熱力學反應特性。
III
Recycling high purity indium from ITO wasted materials
Student: Shiau-Yuan Liau Advisor: Dr. C.G.Chao Dr. T.F. Liou
Department of Material Science and Engineering National Chiao Tung University
Abstract
The study was used to establish a method to recycle indium from ITO wasted solution and ITO wasted mud. The economical and efficient method was presented in the processes of hydrometallurgy and pyrometallurgy. In the hydrometallurgy method (chemical replacement), the powder of Mg and Zn were used to be the reducing agents. No matter in the ITO wasted solution or ITO wasted mud, the sponge indium was obtained by hydrometallurgy. In the pyrometallurgy method (slags making), the alkali compounds liked NaOH and KOH were used to make slags. The pure indium with a purity of 99.9% (3N) could be obtained from the sponge indium. The recycled indium was analyzed by Scanning Electron Microscopy, Energy Dispersive X-ray analysis, Inductively Coupled Plasma-mass spectrometry and Optical Microscope. In recycling indium from ITO wasted solution, the addition of Mg was 4.67g/L to replace the sponge indium and the operation temperature was room temperature. Moreover, the addition of NaOH was 6g/L to refine the sponge indium. The amount of pure indium was obtained 17.69g/L with a purity of 3N. In recycling indium from ITO wasted mud, the addition of Zn was 3g/L to replace the sponge indium and the operation temperature was 60℃. Besides the addition of
KOH was 5.33g/L to refine the sponge indium. The amount of pure indium was obtained 5.39g/L with a purity of 99.7%. In this article, the recycling process involved electrochemical technology, vacuum smelting technology, thermodynamic theorems and microstructure analysis. Therefore, we detailed to study and discuss the behavior and characterization of indium by electrochemistry and thermodynamics.
V 誌謝 兩年的碩士學位得以完成,首先衷心感謝指導教授朝春光博士與劉增 豐博士,感謝您在這兩年來對學生耐心的指導與解惑,不管是學業上及未 來生活上對學生的關心,在此謹獻上學生由衷的謝忱與敬意。 在學位口試期間,承蒙勝華科技資深處長黃俊銘博士撥空蒞臨指導, 對本論文提供多方面的建議與指正讓論文內容能更加完整及嚴謹,在此學 生僅致上由衷的謝意。 兩年碩士生涯中首先感謝實驗室建仲學長,在實驗上的幫助並且鼓勵 督促我使我遭遇挫折仍能樂觀以對。而在實驗技巧上的提點及英文撰寫的 評點方面要感謝士勛學長,總能給予我很大的啟發並且孜孜不倦的修改我 的第一篇英文論文,真是辛苦了!謝謝實驗室同伴仕漢、大緯、郁祥,隔壁 的張小瑜、呂小錚、柚子寶、ppp 還有陳剛好同學,使我在實驗室這段日 子聊天打屁每天都過得很開心。還有應化系的喬盈學妹、剛當上爸爸的陳 進興先生,在我去串門子時能熱情的招呼我,很感謝你們!還有實驗室學弟 妹佑慈、哲毅、亮延、柏叡,隔壁實驗室的學弟妹境妤、馬特,謝謝你們 的幫忙與協助使實驗室可以順利進行研究。感謝好友玉芬、游拉風、小牛、 譽馨、嘉麗、振瑋、gb 在兩年碩士生活中不斷給予關懷與鼓勵,僅此一併 感謝。 兩年的碩士生活匆匆飛逝,在求學生涯中最要感謝的是我的家人,尤 其是我的父母親。你們辛苦的養育我、支持我、鼓勵我,使我在求學過程 中可以無後顧之憂,也是我最強的後盾,我永遠愛你們!同時也要感謝男友 敬懿,有你在身邊讓我學會了包容與體諒,使我能勇敢面對未來的挫折與 挑戰,真的謝謝有你如此重要且絕對的存在,感恩你!最後還有我親愛的哥 哥,與你一同聊skype 的日子很開心,感謝你聽我發牢騷和打蟑螂的小事, 有你一路支持與陪伴,才能讓我專心且順利的完成學業。
Table of Contents
中文摘要 Ⅰ Abstract Ⅲ 誌謝 Ⅴ Table of Contents Ⅵ List of figures Ⅸ List of tables ⅩⅢ Chapter 1. Introduction………... 1 1.1. Motivation………... 1Chapter 2. Literatures Review……...………. 6
2.1.0. Background of indium……… 6
2.2.0. Refinement background and applications of indium……….. 8
2.2.1. Refinement background of indium………. 11
2.2.2. Methods of refinement high purity indium from ITO wasted materials……….. 12
2.2.2.1. Electrolysis……….. 12
2.2.2.2. Vacuum distillation method……… 13
2.2.2.3. Zone purification method………... 13
2.2.2.4. Hydrometallurgy and pyrometallurgy method……… 13
2.3. Thermodynamics theorems and chemical analysis for recycling indium……….. 14
2.3.1. Reagents of indium in the research………. 20
2.3.2. Pourbaix diagram………. 22 2.3.3 The methods of hydrometallurgy and pyrometallurgy in the 24
VII
research……….
Chapter 3. Experimental procedures……..……….... 26
3.1.0. Recycling indium……….. 26
3.1.1. Recycling from ITO wasted mud………. 26
3.1.2. Recycling from ITO wasted solution……… 27
3.1.3. Removal of residual Sn………... 28
3.2.0. Analysis……… 30
3.2.1. Composition testing by EDX & ICP……….…….. 30
3.2.2. Microstructures testing by SEM & OM………... 31
Chapter 4. Results and Discussions………... 35
4.1.0. The thermodynamic theorems in the hydrometallurgy……… 35
4.1.1. The pourbaix diagram of Zn and Mg………... 35
4.2. The ICP and EDX results of ITO wasted solution after hydrometallurgy……… 39
4.2.1. The EDX results of FPD wasted substrates……….. 39
4.2.20. The results of removal of Sn……… 42
4.2.3. The ICP results and the analysis of suspension before hydrometallurgy……… 44
4.2.4. The EDX results of sponge indium after hydrometallurgy….. 45
4.3.0. The ICP and EDX results of ITO wasted mud after hydrometallurgy……… 47
4.3.1 The EDX results of ITO wasted mud………... 47
4.3.2 The EDX results of sponge indium after hydrometallurgy….. 50
4.4. The thermodynamic theorems in the pyrometallurgy………... 51 4.4.1. The calculations for the possible thermodynamic reactions in 51
pyrometallurgy……….
4.5. The EDX and OM results of ITO wasted solution after
pyrometallurgy……….. 57
4.5.1. The EDX results of ITO wasted solution………. 57
4.5.2. The OM images of ITO wasted solution……….. 59
4.6. The EDX and OM results of ITO wasted mud after pyrometallurgy 61 4.6.1 The EDX results of ITO wasted mud………... 61
4.6.2. The OM images of ITO wasted mud……… 62
4.7. Optimized experimental conditions in the research…………. 64
4.7.1. Optimized Electro-polishing Condition………... 64
4.7.2. The properties and polishing skills of indium……….. 65
4.7.3. Optimized Conditions of Hydrometallurgy and Pyrometallurgy……….. 65
4.7.3.1. Optimized conditions of ITO wasted solution……….. 65
4.7.3.2. Optimized conditions of ITO wasted mud……… 68
4.7.4. The Work Window in the research……… 71
Chapter 5. Conclusions………... 72
Chapter 6. Future works………. 73
IX
List of Figures
Figure 1.1. The refinement situation of world countries (1995~2001)... 3
Figure 1.2. The indium supply and demand forecast……….. 4
Figure 2.1. The forecasts for products quantities of thin film solar cell. 10 Figure 2.2. The current extracting process and applications of indium.. 12
Figure 2.3. Variation of the oxidation potentials of each element with the relationship of ion concentration……… 17
Figure 2.4. The pourbaix diagram of Ca………. 22
Figure 2.5. The simple pourbaix diagram for the system indium-water, at 25℃……….. 23
Figure 3.1. Color change of ITO wasted solution………... 27
Figure 3.2. The drying Sn powder……….. 29
Figure 3.3. The pure indium plate for substitution……….. 29
Figure 3.4. The instrument of FE-SEM (JSM-6500F)……… 31
Figure 3.5. The reaction steps of electro-polishing………. 32
Figure 3.6. The relative steps of above………... 32
Figure 3.7. The samples of electro-polishing. (a) The front view of holder and it had a conductive piece of Cu. (b) The holder were used to put the indium in it……….. 33
Figure 3.8. The whole experimental flow chart in the research……….. 34
Figure 4.1. The pourbaix diagram of magnetism……… 35
Figure 4.2. The pourbaix diagram of zinc………... 36 Figure 4.3. The different parts of FPD wasted substrates. (a) Al
1000X. (d) The ITO films, 2000X. (e) The ITO films, 500X. (f) The ITO films, 3000X………... 39 Figure 4.4. EDX results of the ITO wasted materials. (a) SEM images
of Al fragments (drug-formed) (b) EDX results of Al fragments. (c) SEM images of Al substrates. (d) EDX results of Al substrates. (e) SEM images of ITO films. (f) EDX results of ITO films. (g) SEM images of ITO films (needle-formed). (h) EDX results of ITO films……… 41 Figure 4.5. The EDX results for removal of Sn powder. (a) SEM
images of indium plate with Sn powder. (b) EDX results of indium plate, and Sn powder was retained on it. (c) SEM images of the powder onto indium plate. (d) EDX result of the powder, and it was composed of Sn. (e) SEM images of “clean” indium plate. (f) EDX results of indium plate, and it was all composed of In………... 43 Figure 4.6. The EDX results of suspension. (a) SEM images of
suspension. (b) EDX results of suspension, and the signals of Al and Sn were evident………. 45 Figure 4.7. The EDX results of sponge indium were replaced by Zn.
(a) SEM images of sponge indium. (b) EDX results of sponge indium, and the raw indium included many kinds of elements……… 46 Figure 4.8. The EDX results of sponge indium were replaced by Mg.
(a) SEM images of sponge indium. (b) Residual Mg could be found in the raw indium………... 46
XI
Figure 4.9. Pictures of process of recycling indium. (a) The sands would be precipitated underneath the beaker. (c) The sponge indium without drying. (d) The drying indium powder. (e)The side images of pure indium. (f) The front images of pure indium………. 48 Figure 4.10. The EDX results of ITO wasted mud. (a) SEM image of
ITO wasted mud (b) Cr ions would be found in it because of the stain steel of the sputtering chamber wall………….. 49 Figure 4.11. EDX results of sponge indium by Zn. (a) SEM image of
sponge indium.(b) Cr and Cl- ions would be found in the raw indium……… 50 Figure 4.12. Variation of the Gibbs free energy of each element with the
increase of temperature………. 53 Figure 4.13. Variation of the partial pressure of oxygen for each
element with the increase of temperature………. 55 Figure 4.14. Variation of the vapor pressure of each element with the
increase of temperature………. 57 Figure 4.15. EDX results of pure indium were replaced by Zn and the
slags with NaOH. (a) SEM image of pure indium. (b) Residual Sn in pure indium………... 57 Figure 4.16. EDX results of pure indium which was replaced by Mg
and the slags with NaOH. (a) SEM image of pure indium. (b) The indium with a purity of 100 %... 58 Figure 4.17. OM images of pure indium were replaced by Mg and the
OM image of pure indium, 100X. (c) OM image of pure indium, 200X……… 59 Figure 4.18. OM images of indium, 100X. The indium was replaced by
Zn and the slags with NaOH………. 60 Figure 4.19. OM images of indium, 200X. The indium was replaced by
Mg and the slags with NaOH……… 60 Figure 4.20. EDX results of pure indium from ITO wasted mud. (a)
SEM images of pure indium. (b) The indium with a purity of 99.9 wt%………... 61 Figure 4.21. OM images of pure indium were replaced by Zn and the
slags with KOH. (a)OM image of pure indium, 50X. (b) OM image of pure indium, 100X. (c) OM image of pure indium, 200X……… 62 Figure 4.22. OM images of indium, 200X. The indium was replaced by
Mg and the slags with KOH………. 63 Figure 4.23. OM images of indium, 200X. The indium was replaced by
Zn and the slags with KOH……….. 63 Figure 4.24. The OM image of pure indium (99.999%)………... 65 Figure 4.25. Influence of Mg addition to the amounts of recycling
indium, at 25℃………. 66 Figure 4.26. Influence of NaOH addition to the amounts of pure
indium, at 25℃………. 67 Figure 4.27. Influence of two temperatures on the amounts of sponge
indium, at 60 and 80℃ ℃………. 68 Figure 4.28. Influence of two temperatures on the amounts of pure
XIII
indium, at 60℃ and 80℃………. 69 Figure 4.29. Influence of three temperatures on the amounts of pure
indium, at 25℃, 60℃, and 80℃……….. 69 Figure 4.30. Influence of KOH addition to the amounts of pure indium,
List of Tables
Table 1.1. The comparisons of various TCO films……… 1 Table 2.1. The consumption of indium for various countries………… 7 Table 2.2. The comparison of the two elements……… 8 Table 2.3. The possible reactions of indium in the research………….. 17 Table 4.1. The summary of two kinds of reducing agents in the
hydrometallurgy………. 38 Table 4.2. The results of ICP test………... 44 Table 4.3. The oxidation reactions of each element: (included the
values of ΔG)………. 52 Table 4.4. The sublimation and evaporation of each element………… 56 Table 4.5. The condition of electro-polishing……… 64 Table 4.6. The optimized conditions of hydrometallurgy……….. 71 Table 4.7. The optimized conditions of pyrometallurgy……… 71
Chapter 1
Introduction
1.1 Motivation
In recent years, the TCO (transparent conducted oxide) films were widely used in the field of FPD (flat panel displays), because the TCO films have some practical characters like good conductivity and high transparency for visible light. The kind of films was used as a coating layer for display of computers and other electronic device, such as cell phones, instrumentation panels, CD players, etc. [1] There are many forms of TCO, such as AZO(Al-Zn oxide), ATO(Sb-Sn oxide), and FTO(F-Sn oxide), but ITO(indium tin oxide) might catch the most attentions due to its unique properties of transparency and conductivity. In the table 1-1, the comparisons of various TCO films were showed as follow.
Table 1-1 The comparisons of various TCO films [2]
comparison AZO ITO FTO
Properties ZnO-base, dope Al 6×E-4 Ωcm (2%Al) 80% (in visble) In2O3-base, dope Sn 3×E-4 Ωcm 85%(depended on substrates, in visble)
SnO2-base, dope F
90% (in visble ), 1.5×E-2 Ωcm used in DSSC (dye sensitized solar cell) Disadvantages
for fabrication
The large dense thins are necessary ( by sputtering)
ITO targets was used over 70% , depended on world output
F would make the materials toxic catalogs
Among all TCO films, the ITO occupies the most significant application in the field of FPD markets. At 1968, Boort and Groth [3] of the Holland Company discovered the ITO, a kind of low resistance and transparent conducted material, and its resistivity is about 3×E-4 Ωcm. In addition, the value is nearly the same with that of metals; the excellent property of conduction make the kind of thin film be used extensively. ITO targets commonly used in FPD markets; furthermore, the world consumption of indium is also over 70% till the end of 2008.[4] Because of the fast development of the FPD markets, the large demands for ITO films were expected. In addition, the high transparency of visible light and ability of infrared reflection widened the more applications for using the ITO films. In recent five years, the main stream still focused on the ITO films and the demand for indium was increasing gradually.
Developments of FPD industries have been investigated for several years. From the fabrication of flat panel display, the better films would be needed relatively. In order to ensure the transparency and conduction of the thin films, most of industries selected the ITO films as the sources materials. The sputtering process to deposit ITO onto glass is inefficient. A large number of rejects are unsuitable for fabricating the display screens. The rejects were usually in grinding sludge or on the shields of the sputtering chamber wall. [1] Besides, the abundance of indium in earth crust is very small and dispersed. Indium is such a rare element and would not be mined in our country; most of indiums are compounded with the metal ores like Zn and Pb. If the inefficient ITO deposition and the increasing demands of indium kept on, the upgrade of industry would be limited seriously. Therefore, recycling indium became a
[4] in the nearly future.
Two methods to recycling indium are introduced, one method is electrolysis and the other is vacuum distillation. [5] In the method of electrolysis, the metal indium could be attained a 99.99% purity and obtained at least 0.5 ppm each of impurities, such as Si, Fe, Ni, and Cu…etc. An abnormal increase of Si content in the final product and the difficulty of preserving high-purity indium for a long time caused the process inefficient. In the method of vacuum distillation, a purer indium could be gotten by the two-step thermal purification. The key problem for the method is only the impurity with lower vapor pressure than indium could be separated away, so those with higher vapor pressure could be separated in other ways to yield indium. Therefore, the method of hydrometallurgy and pyrometallurgy was used to recycle indium from ITO wasted solution in the article. The oxide layer of indium could be eliminated after annealing. The purity of indium could be maintained for a long time and no obvious impurities would be produced during the process.
World refinery production was estimated at 200 tons at 1996. In the fig.1-1, the world countries included China, France, Japan and Canada established the processes of refinement in the early 1995. There are eight major producing countries; the top four, Canada, France, Japan, and Russia accounts for 75% of the total. China was the first country to refining indium from the year 1995 because of the abundant quantities and scales of factories. Another important country is Japan, which has the world’s largest consumption of indium. [6] The development for ITO is so prosperous that the work of indium refinement would be the next current treads. In addition, Canada has greater resource of indium than any other country-about 27% world storages.
Fig. 1-2 the indium supply and demand forecasts [4]
The figure 1-2 was done by the association of ICA (The Indium Corporation), established in 1934, investigating potential uses of the element indium. The future trends are influenced by many factors:
(1)World economy in general
(2)Specific industries trends (e.g. the mining, electronics or energy sectors) However, additional virgin outputs coming from increased efficiencies and
treatment of residues would cause “the demand market.”
The goal of this research is to establish a process for recycling indium. The problem must be solved by separating In and Sn first because the two elements had some familiar properties and easily compounded with each other. In semiconductor industries, the standard recycling processes were applied to recycle many economical metals, such as W, Mo, Bi, Au, Pd, Pt…etc.[5] The recycling wasted solution could be HCl, H2SO4, H3PO4, and HNO3, but the
cyanide solution was not suitable to apply these procedures due to its toxic character. The cyanide often used to recycle the rare and precious metals, such as Au, Pd, and Pt. [5] No toxic cyanide in those reclaiming procedures make the experiments safe and practicable.
Chapter 2
Literatures Review
2.1 Background of indium
Indium, which discovered by Ferdinand Reich and Theodore Richter[7], was be identified as a by-product of a wider range of commercial ores including tin (stannite and cassiterite), copper (polymetallic ores), zinc (sphalerite), and lead (galena)…etc.[8] Indium originally would be extracted from zinc and lead ores because of the primarily economic reasons. In addition, indium was found to be a minor component in zinc ores, but market supply was mainly depended on the requirements of zinc market. Furthermore, indium appears widely dispersed on the earth surface, is estimated to be 0.05 ppm for the continental and 0.072 ppm for the oceanic crust, respectively. [4] Because the abundance of indium is so imbalance, the supply around the globe is in terms of geography and political policies.
In the early 1990s, a sudden rush of research for ITO, the potential of thin film technology would be discussed widely. The ITO films consisted of 90% In2O3 + 10% SnO2. Surge in demand for indium caused the price of In
increasing. [4] World production of indium was 173 tons in 1996. (66 tons from the European Union, 40 tons from Canada, 25 tons from China, 20 tons from Japan, 18 tons from the Community of Independent States, and 4 tons from Peru.)[6] The indium was used in making bearing alloys, germanium transistors, rectifiers, thermistors, and photoconductors. Indium could be plated onto metal and evaporated onto glass to form a mirror as good as those made of silver with higher resistance to atmospheric corrosion photocells. In the Fig.2-1, it
presented the consumption situations of indium for some countries. Russia, Canada, and China would be the three large consumption countries in the early 1996.
Table 2-1 The consumption of indium for various countries [6]
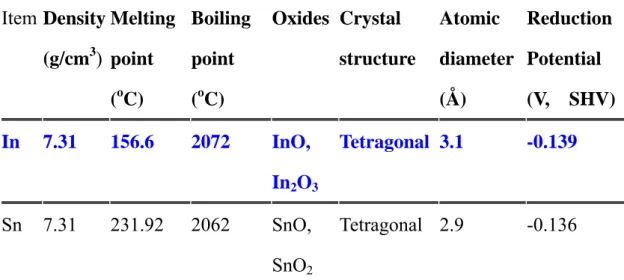
Tin and indium have many familiar properties, such as melting point, boiling point, density, crystal structure, and atomic diameter…etc. The crystal structure of indium is tetragonal. (a: 325.23 pm, b: 325.23 pm, c: 494.61 pm α: 90.000°, β: 90.000°, γ: 90.000°) The Table 2-2 showed the comparison with In and Sn.
Table 2-2 The comparison of the two elements Item Density (g/cm3) Melting point (oC) Boiling point (oC) Oxides Crystal structure Atomic diameter (Å) Reduction Potential (V, SHV) In 7.31 156.6 2072 InO, In2O3 Tetragonal 3.1 -0.139 Sn 7.31 231.92 2062 SnO, SnO2 Tetragonal 2.9 -0.136
2.2 Refinement background and applications of indium
Indium is a rare element and ranks 61st in abundance in the Earth’s crust at an estimated 240 parts per billion by weight. [9] It is about three times more abundant than silver or mercury. Indium is available in several forms including bar, pieces, powder, nanosize activated powder, rods, shot, sheet and wires; it is a very soft, silvery-white metal with a brilliant luster. In the section 2-1, indium was usually discovered predominantly in zinc-sulfide ore mineral, the sphalerite. The recent applications for indium are as follows (until the end of 2007): [9]
1. ITO targets (70%)
2. Electronic and semiconductor (12%)
3. Solders and low-melting-point alloys (12%) 4. Research (6%)
Let’s firstly focus on the third point, the applications for low-melting-alloy system. After developing lead-free solders for electronic application, several
indium-base systems including tin-indium, tin-zinc-indium, tin-silver (-antimony)-indium, and tin-bismuth-indium were presented. These researches achieved the potential applications in communications and transportation in the industrial laboratories. Indium is also used as a strengthening agent for lead solders and as the base material for many low-melting-point solders due to its flexibility (over a greater temperature range) and the character of low- melting- point. [10-13] In addition, while the WHO claimed to stop using lead solders, indium became the maintenance for lead-free solders.
Since the cost of fuel is getting high in the recent ten years, the substitution was found increasingly. Especially, the solar cell researches were turned into a hot issue recently; they are the fundamental source and would not be tired out for a long time.
When the energy on the earth would be exhausted one day, some experts predicted the solar cell industry would increase the requirement of copper-indium-diselenide.[14] The development of solar cell from indium, mostly solar cell was made of silicon wafer in the past. Using the silicon wafer as the substrates of solar cell had some advantages, such as low cost of equipment, high yields from process, fast producing rate, and good translation efficiency. Therefore, Si wafers would be predicted as the main stream for the solar cell market. Recently, many countries in the world tried best in the thin-film solar cell because of the lack of poly-silicon. A thin-film solar cell was made by sputtering multiple layers, which could induce photoelectric effect on the substrate of metal, glass, and plastic…etc, and its thickness is only several micrometers. This new material is much thinner than the original silicon wafer, and the consumption of silicon wafer would be decreased. There are two semiconductor compounds, CIS (copper indium diselenide) and CIGS
(copper indium gallium diselenide), for producing thin-film solar cell. These semiconductor compounds have wide absorption range and good stability. Nevertheless, there are two disadvantages for CIS and CIGS. One is the lifetime; traditional solar cell could use about 20 years, and the life time of thin film solar cell is shorter than 10 years. Because the translation efficiency of thin film solar cell was lower than that of silicon wafer, the large area for thin film solar cell would be required. The other is the cost; costs of thin film solar cell are lower than that of the traditional solar cell, but the equipments for sputtering costs are much higher. Therefore, total cost of fabrication process for thin film solar cell would not be declined. For these reasons, there is still much dilemma for developing the CIS and CIGS thin-film solar cell. The developments for all kinds of thin films solar cell would be depicted as following Fig.2-1. The light-blue line represented the CIGS films. In the future, developing new sources and reducing expenses of indium are other important issues.
2.2.1 Refinement background of indium
The American government established an association named the Indium Corporation (ICA) at 1934 to investigate potential uses of the element indium. The association offered over 72 years of indium refining, processing, fabricating, and application engineering experience. [4] As the demand for indium was increasing, more countries were investing lots of efforts to find efficient way for recycling indium. All we want to do is not only extracting them from ores, but also refining out other impurities from primary indium. Base metal smelters were improving the extraction process of indium from ores & minerals, which concentrating with low indium contents. In addition, these smelters are now more aggressively seeking and purchasing indium containing concentrates from various sources. Refining capacity has been increasing on a worldwide. In 2004, Korea Zinc installed a brand new extraction and refining processing line at their zinc smelter. Dowa Mining increased their indium capacity in Japan. Others have installed refining lines to purify crude indium into higher purities. [4]
Recycling became very significant for the first time in 1996 [6] and affected the market and prices. Recycling of indium could expand rapidly if the current price of indium is sustained or continues to increase. The current processes of extracting indium were shown in the figure 2-2. Many countries had an aggressive recycling program that made up for any shortfalls in domestic production and imports of indium. [4]
Fig. 2-2 The current extracting process and applications of indium [4]
2.2.2 Methods of refinement high purity indium from ITO wasted materials In the section, three methods, which could be used to refine indium, would be introduced. The United States Patent No.060580 offered some methods, such as electrolysis, vacuum distillation and zone purification…etc.
2.2.2.1 Electrolysis
In the methods of electrolysis, the metallic indium would be obtained a purity of 99.99 % (4N), and contained at least 0.5 ppm each of impurities such as Si, Fe, Ni, Cu, Ga, and Pb. The purification from waste compound semiconductors had the problem that large equipment and prolonged time was needed to separate and recover indium. Even if the United States Patent showed the production of 4N-purity indium, pure In couldn’t maintain for a long period because of an abnormal increase in the Si content of the final. [5]
2.2.2.2 Vacuum distillation method
In the method of vacuum distillation, the pure indium would be attained by two-step thermal process. [5] Indium in an “indium feed” was evaporated and then condensed for recovery in the first thermal purification step. In the second thermal purification step, the product of the first step would be separated from impurity elements of lower vapor pressure and the recovered indium was heated. Basically, In could evaporate away impurity elements of higher vapor pressure at higher temperature. As a result, not only the impurities elements with lower pressure than indium would be found, but also those with higher vapor pressure could be separated in an efficient manner to yield indium with a purity of 99.99% or higher. The central concept of the method was using the different vapor pressures to separate indium from other metals. In addition, some elements with higher vapor pressure than indium are P, S, Cl, P, Ca, Zn, As, Cd, and Pb…etc; and those with lower vapor pressure are Al, Si, Fe, Ni, Cu, and Ga…etc.
2.2.2.3 Zone purification method
In the zone purification method, the purified indium mass had to be cut and there was a potential hazard of contamination [5]; hence, the purification process inevitably suffered from a limited and lower throughput. Furthermore, when the purified indium was cast into an ingot, impurities might enter to cause contamination.
2.2.2.4 Hydrometallurgy and pyrometallurgy method
Among all methods were introduced before, the hydrometallurgy and pyrometallurgy would be the better choices. The hydrometallurgy offered
simple and fast experimental procedures, and the whole process could be finished just for three hours. Comparing other methods of recycling indium, the shortest times also required 15 days. [4] The multiple procedures of other methods made the whole process inefficient and the costs of recycling were getting high. Moreover, the hydrometallurgy with higher chemical selections was suitable to use in the ITO wasted solution. The reducing agents liked Zn and Mg was put in it, and the indium would be replaced gradually. The extra reactions were overlooked by the theorems of electrochemistry except the possible reactions in Zn, Mg, and In. In the research, the hydrometallurgy was first used to recycle the raw indium from the ITO wasted solution. After that, the raw indium was refined by the method of pyrometallurgy, it could avoid other impurities during the process. Therefore, the purity of indium would be attained for a long period. The coherent compositions could be gotten after annealing under the melting point of indium, 156℃. In the chapter three, the detail procedures would be mentioned.
2.3 Thermodynamics theorems and chemical analysis for recycling indium
Many chemical reduction methods were used to extract the indium out from the ITO wasted solution. First, the metals ions with the lower electromotive force could be replaced by the metals with the higher electromotive force from the solution. A few elements which were more activated than indium would be chosen to be the reducing agents. From the pourbaix diagrams, the relative reduction potential of each element could be found, some suitable elements could be selected from the diagrams. Indium
would be deionized to these ions, In+, In2+, In3+, and InOH2+ when it existed in acidic solutions. Indium would be the oxides, In2O3, when it existed in neutral
solutions. Finally, indium would be deionized to InO2- as it existed in base
solutions. If we want to know the chemical reactions about the atoms, ions, and oxides in aqueous solutions, the electrochemical theorems by the “Nernst’s equations” [15] would be defined as follow:
K ln nF RT E E= o − (2-1) E: reduction potential
E°: standard reduction potential R: gas constant
T: temperature
n: the number of interaction electrons F: Faraday constant
K: the equilibrium constant of ions
The possible electrochemical reactions of indium in the solution were shown in the Table 2-3, and the simpler pourbaix diagram was established according to it. Based on the information of pourbaix diagram of In [16], the metal indium would be the stable In3+ ions in acidic solutions. In neutral solution, indium would be covered by an oxide layer on its surface; and the oxide would cut off any reactions between indium and aqueous solution. Indium would be precipitated by the compounds like InCl3 and InF3 in the HCl
(hydrochloric acid) and HF (hydrofluoric acid), respectively. Both precipitate compounds would not be dissolved in acidic solutions. Through controlling the pH value and electrovoltage of the chemical reactions, indium would be ions in aqueous solutions. Furthermore, the metal indium also could be precipitated on
) ( log 0295 . 0 763 . 0 ; 2 2 2 − + + + → =− + ⋅ Zn E Zn e Zn o
cathode electrode in the cell by the electrolysis. The specific ions like In3+ would be replaced in aqueous solutions at the difference of oxidation voltages of Zn, Al, and Mg, which are -0.76V, -1.67V, and -2.34V. All the voltages are lower than the indium voltage of -0.34V. Therefore, if we put Zn, Mg, and Al plates or powder in aqueous solutions, the indium could reduce ions to metal. The oxidation voltages of above-mentioned:
) Mg ( log 0295 . 0 363 . 2 E ; Mg e 2 Mg+2 + −→ o =− + ⋅ +2 (2-2) ) Al ( log 0197 . 0 663 . 1 E ; Al e 3 Al+3+ − → o =− + ⋅ +3 (2-3) (2-4) ) In ( log 0197 . 0 342 . 0 E ; In e 3 In+3+ − → o =− + ⋅ +2 (2-5)
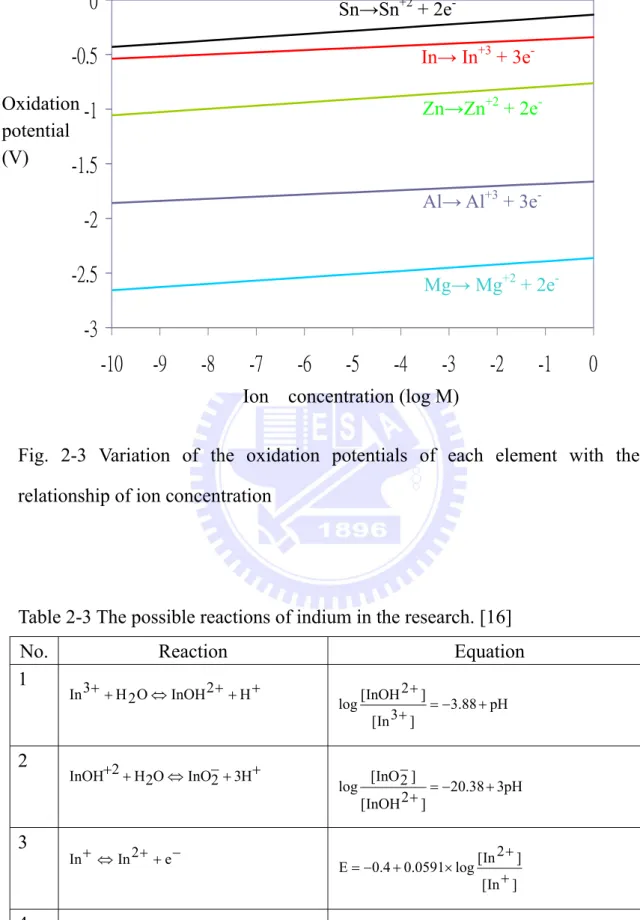
Another factor to influence the oxidation potential of compound is the concentration of metal ions in solutions. The relationship of oxidation potential and ion concentrations between each element was depicted in the figure 2-3. The magnesium was at the last one and with the greater ability of oxidation than other elements. Tin is the first one and with a lower oxidation potential than indium; therefore, tin was still retained in the ITO wasted solution. As above mentioned, tin and indium have many familiar properties; and a new separation method would be created to extract tin from indium. Eq.2-6 is the oxidation voltage of Sn: ) Sn ( log 0259 . 0 136 . 0 E ; Sn e 2 Sn+2 + −→ o =− + ⋅ +2 (2-6)
Fig. 2-3 Variation of the oxidation potentials of each element with the relationship of ion concentration
Table 2-3 The possible reactions of indium in the research. [16]
No. Reaction Equation
1 + + + ⇔ + + O InOH2 H 2 H 3 In pH 88 . 3 ] 3 In [ ] 2 InOH [ log =− + + + 2 + + − ⇔ + + 3H 2 InO O 2 H 2 InOH pH 3 38 . 20 ] 2 InOH [ ] 2 InO [ log =− + + − 3 − + + ⇔ + In2 e In ] In [ ] 2 In [ log 0591 . 0 4 . 0 E + + × + − = 4 − + + ⇔ + In3 2e In ] In [ ] 3 In [ log 0295 . 0 443 . 0 E + + × + − =
-3
-2.5
-2
-1.5
-1
-0.5
0
-10
-9
-8
-7
-6
-5
-4
-3
-2
-1
0
Ion concentration (log M)Oxidation potential (V) Mg→ Mg+2 + 2e -Al→ Al+3 + 3e -Zn→Zn+2 + 2e -Sn→Sn+2 + 2e- In→ In+3 + 3e
-5 − + + + + ⇔ + + O InOH2 H 2e 2 H In ] In [ ] 2 InOH [ log 0295 . 0 pH 0295 . 0 33 . 0 E + + × + − − = 6 − + + + − ⇔ + + 4H 2e 2 InO O 2 H 2 In ] In [ ] InO [ log 0295 . 0 pH 118 . 0 262 . 0 E +2 − × + − = 7 − + + ⇔ + In3 e 2 In ] 2 In [ ] 3 In [ log 0591 . 0 489 . 0 E + + × + − = 8 − + + + ⇔ +3H2O In2O3 6H 6e In E=−0.19−0.0591pH 9 + + ⇔ + + 6H 3 O 2 In O 2 H 3 3 In 2 log[In3+]=7.73−3pH 10 + + ⇔ + + 4H 3 O 2 In O 2 H 2 InOH 2 log[InOH2+]=3.85−2pH 11 + + − ⇔ +H2O 2InO2 2H 3 O 2 In log[InO2−]=−17.05+pH 12 − + + ⇔In e In E=−0.139+0.0591×log[In+] 13 − + + ⇔In3 3e In E=−0.342+0.0197×log[In3+] 14 − + + + + ⇔ +H2O InOH2 H 3e In E=−0.266−0.0197pH+0.0197×log[InOH2+] 15 − + + + − ⇔ +H2O InO2 4H 3e In E=0.146−0.0788pH+0.0197×log[InO2−] 16 − + + + ⇔ + + 6H 4e 3 O 2 In O 2 H 3 In 2 E=−0.216−0.0886pH−0.0295×log[In+] 17 InH⇔In+H+ +e− E=−1.951−0.059pH
In addition, the principle of electrolysis was introduced to refine indium. There are many methods, such as electrolysis, vacuum distillation, and chemical replacement could be used to recycling indium. The equipment of electrolysis was easier than other methods so it would be chosen for us. The “first” indium by chemical replacement would be defined as the raw metal indium, with a purity of 95%~99%. The indium with a higher purity about 99.9% would be attained after repeated refining, and the kind of indium was so called “fine” indium. Through the electrolysis process, the raw metal indium could turn into fine metal indium with a purity of 99.999% (5N) at least.
Before electrolysis, these impurities metals such as aluminum, tin, and zinc…etc should be removed. The processes of electrolysis were done by twice or three times, and the high purity indium would be obtained gradually. In the procedures, the high-purity indium plate (about 5N) was used as cathode electrode, and the raw metal indium plate from vacuum pyrometallurgy was used as anode electrode. The electrolyte was the In2(SO4)3 or InCl3 solution.
The electrochemical reaction was shown as following [29]:
In(pure, anode)︱In2(SO4)3,H2SO4,H2O(electrolyte)︱In(raw, cathode)
All parts of the electrolyte would deionize in:
In2(SO4)3 → 2In3++ 3SO42- (2-7)
H2SO4 → 2H++ SO42- (2-8)
H2O → H++ OH- (2-9)
Some electrochemical reactions through external voltages would work possibly. There are three reactions at the anode electrode were showed as follows:
In → In3+ + 3e- (-0.343V) (2-10) 2H2O → O2 + 4H+ + 4e- (1.229V) (2-11)
Some impurities, such as Sn, Bi, Ni, Cu, and Sb, have higher oxidation potential than indium in the anode electrode. Therefore, no compounds would precipitate at the cathode electrode during electrochemical reactions. However, one reaction about aluminum would occur, the oxidation potential of Al was lower than that of In and the compound Al(OH)3 would be produced in base
solution. As a result, the effect of aluminum at the anode electrode could be ignored. The possible reactions were occurred at the cathode electrode:
In3+ + 3e- → In (0.343V) (2-13) H+ + 2e- → 0.5H2 (0V) (2-14)
The standard oxidation potential of hydrogen is lower than indium, and indium would be over-potential and produce In3+ by the hydrogen ions. Some hydrogen gas was out in the process of electrolysis. The ion In3+ would be reduced and precipitated metal indium on the cathode electrode.
2.3.1 Reagents of indium in the research
The method of replacement was the fast one in recycling indium. A model was used to explain the processes of replacement. Each element with different oxidation potential and the element with lower oxidation potential could be replaced by higher ones. The chemical equilibrium reaction [29] could be expressed like that:
M1n++M2 → M2n++M1 (2-15)
From above reaction, the ion M1n+ was the original ones in the solution, and the
element M2 is the replaced metal added in. The M2n+ was the metal ions
replaced from the solution, and the metal M1 was the element precipitated after
The oxidation potential of Zn:
Zn → Zn+2 + 2e- -0.763V (2-16) The oxidation potential of In:
In → In+3 + 3e- -0.342V (2-17) The oxidation potential of zinc was lower than that of indium, and indium from ITO wasted solution would be replaced by metal zinc. Then it would be dissolved, the metal indium was precipitated underneath the solution. The chemical equilibrium formula was shown:
Inn+ + Zn → Znn+ + In (2-18)
Except the element zinc, there were many elements with lower oxidation potential than indium, such as Li, K, Ca, Na, Mg, and Al, whose oxidation potentials are -0.32V, -2.924V, -2.87V, -2,71V, -2.34V, and -1.67V, respectively. [17] These elements all were the reducing agents in the research. There were two reasons of choosing the elements Zn and Mg as the reducing agents. One is the cost; the Zn and Mg powder are cheaper than other elements. The other is the oxidation potentials; Zn and Mg are with lower oxidation potentials than indium. The element like Ca was also with the lower oxidation potentials than indium, but Ca still was unsuitable to as the reducing agent. In the next section, the reason would be introduced.
2.3.2 Pourbaix diagram
The pourbaix diagram could be defined by the thermodynamic theorems in aqueous solution. The ordinate axis of this diagram is the reduction potential E(volts), and the abscissa axis is pH value of solution. A pourdaix diagram was separated into four quadrants: upper left side is acid oxidizing zone, left underneath is acid reducing, upper right side is basic oxidizing, and right underneath is basic reducing. The four quadrants would be used to present the state of some compounds, or the states we wanted also could be observed from the diagram. In the figure 2-4, the pourbaix diagram of Ca [16] would be introduced. The interphase compound (CaH2) would be produced between the
Ca2+ and Ca, and itformed at a wide range of pH value. Therefore, it was hard to ignore the appearance of the interphase compound during the reaction Ca→
Ca2+ + −. e 2
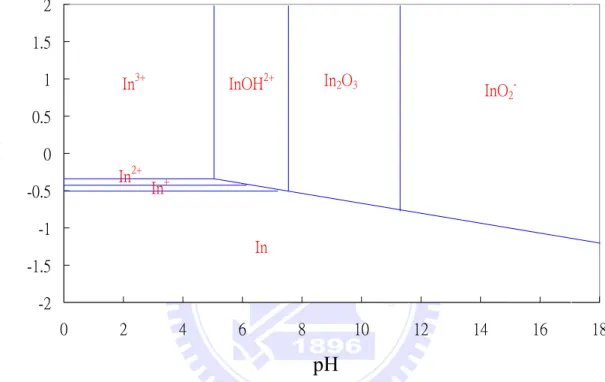
The pourbaix diagram of In was depicted in the figure 2-5. The In3+ would be the ions which existed in the ITO wasted solution. The reaction of In+3 + 3e- →In was worked by controlling the fixed electro-voltage. The ion state of In3+ should be attained by the state of acid oxidizing; it was the section of upper left side. -2 -1.5 -1 -0.5 0 0.5 1 1.5 2 0 2 4 6 8 10 12 14 16 18 In3+ In2+ In+ In In2O3 InOH2+ InO 2 -pH E (V)
Fig. 2-5 The simple pourbaix diagram for the system indium-water, at 25℃
The only solid compound of trivalent indium which appears in figure 2-5 is the anhydrous oxide In2O3, which is probably the stable form of the oxide of
trivalent indium. According to the free enthalpy values, the hydrated oxide In2O3 ﹡3H2O[or hydroxide In(OH)3] is less stable than the anhydrous oxide
In2O3.[18] Therefore, the stable form of indium oxide is In2O3 was depicted in
the figure 2-5. In addition, the baths for electro-deposition of indium might be chloride-, sulphate- or sulphamate-based. Indium could also be obtained by reducing its oxide with carbon in a stream of hot hydrogen. Metallic indium is precipitated when excess zinc was added to a solution of an indium salt. [19]
The concentration of In2+ was always below the concentration of In3+ ions or In+ ions, and the ion In+ itself was being the predominant form only at very low dissolved indium concentrations.(below 1.15 mg/l) [20] In reality, In+ and In2+ probably exist as chloride complexes. Remy reported that [21] the oxide In2O3 was insoluble in alkali metal hydroxides and ammonia.
2.3.3 The methods of hydrometallurgy and pyrometallurgy in the research There are some advantages of hydrometallurgy: [22]
(1) Its economical scales are small, and it has better economic efficiency.
(2) For the more complex sources of materials, the methods are more suitable in large usages.
(3) The cost is much cheaper than pyrometallurgy.
(4) The method could handle the sources with fewer materials. (5) This method could operate in atmosphere and room temperature. (6) It has the higher chemical selections.
(7) The method could separate the metals which have similar chemical properties.
Above lists were the reasons to use the hydrometallurgy method. Hydrometallurgy method was used to replace the metal indium from ITO wasted solution, and then the vacuum pyrometallurgy method was used to get the raw metal indium of 2N. Finally, the electrolysis method was used to get the secondary metal indium, high-purity indium of 5N.
Pyrometallurgy was a common method in refining commercial metal for several years. With the slags, the impurities were eliminated at the same time. Evidently, the slags of ITO wasted solution were MgO and NaOH, and the
was surrounded by the oxide, In2O3. The slags were suspended on the top of the
melted In and they could be removed by water. Using pyrometallurgy method to refine indium was better because it was convenient and cheap. The whole experiment period just took 2 hours, and the short period provided relative low cost for the research. Hydrometallurgy method with higher chemical selection and pyrometallurgy method with the characters of simple and cheap were the reasons to be used in the research. As a result, the information of electrochemical, thermodynamics, casting, and vacuum pyrometallorgy are used to define these experiment procedures.
Chapter 3
Experimental procedures
3.1 Recycling indium
In this article, the ITO wasted materials included the ITO wasted mud and ITO wasted solution. In order to recycle the pure indium from two kinds of wasted components, the complete experimental procedures were established. The sources of ITO wasted mud were the wasted ITO targets, and those of ITO wasted solution were wasted FPD substrates. After dissolving with saturated HCl, they could be ITO wasted solutions finally.
3.1.1 Recycling from ITO wasted mud
The increasing of the usages in ITO targets caused the appearance of ITO wasted mud. The powder of Al2O3 (fine sands) was used to collide the
sputtering chamber which deposited ITO films on the glass or aluminum substrates. Therefore, the sands was included many elements in it, such as In, Sn, and Cr…etc. The first step is dissolving the compositions of ITO by acidic solution, the 13 vol% HCl, and it also could be presented to the proportion of HCl: H2O= 1: 2. Furthermore, the sands could be precipitated underneath the
5000ml beaker, and the process of precipitation took about half or one hours. Then we took the solution out from the beaker and ensured the sands were not retained in it. Keep going on the works of replacing the In3+ to metal indium from the solution which be left over. The color change was from dark to light while the sands had few compositions of ITO.
In recycling ITO wasted mud, the slags with KOH were used to extract impurities from pure indium. From the process of pyrometallurgy, we chose the
KOH as the alkali component with slags.
3.1.2 Recycling from ITO wasted solution
In order to establish the complete experimental procedures for extracting indium from ITO wasted materials, the metal indium was dissolved by acidic solution. From the discussion of 3.1, the final forms of ITO wasted materials are the wasted solution after dissolving in the HCl. The wasted materials were dissolved in the 15 vol% HCl (hydrochloric acid) after sieving. In addition, eliminating the ions of indium (In3+) gradually and the color of solution would turn to the light yellow. While getting the solutions, the first thing is testing the compositions of the solutions. If the composition of indium could be known in each solution, the efficiency of recycling would be calculated. Then the color of ITO acidic solution would be showed in the figure 3-1.
Light purple Dark purple
Fig. 3-1 color change of ITO wasted solution
In the fig. 3-1, the left bottle has little ions of indium, and the color is light purple. The right bottle is the original color of solution, and many kinds of ions are involved in it. After the ICP test, the step of chemical reducing would be carried on.
flat panel displays (FPD). The kinds of ITO wasted materials are commonly existences because of the large amounts of FPD factories. The fragments in the wasted FPD materials have many sizes if they wouldn’t be sieved before using. Then we dissolved with 15vol% HCl and the components without the compositions of indium would be precipitated under the solution. Moreover, the slags with NaOH were used to extract impurities from pure indium. After pyrometallurgy, the alkali component like KOH was not suitable to use because the contents of indium were less than the slags with NaOH.
3.1.3 Removal of residual Sn
The element Sn would be gotten rid of before reducing because of the similar properties to indium. The oxidation potential of tin is higher than that of indium, so the element Sn was obtained by oxidizing the In to In3+ in the acidic solution. Then Sn2+ in the acidic solution was reduced onto the pure indium plate. Although the pure indium plate was slightly dissolved into the acidic solution, the semi- reactions would be introduced as follow.
In → In3+ + 3e- Anode (3-1) Sn2+ + 2e- → Sn Cathode (3-2) Then the equilibrium reaction in the system was:
2In + 3Sn2+ → 2In3+ + 3Sn (3-3)
The dynamic balance existed in the system of removal of Sn. The operation condition is at the temperature of 60℃ and the time of indium plate was soaked in is about 30 minutes. The figure 3-2 and 3-3 was depicted the Sn powder after reducing and the pure indium plate for substitution.
Fig.3-2 the drying Sn powder
Fig.3-3 the pure indium plate for substitution
In the fig.3-2, the Sn powder with a luster of bright white after replacing. Furthermore, the pure indium plate in the fig.3-3 was produced from the repeating replacing and pyrometallurgy, and it with a purity of 99%. The surface areas should be as large as possible because the soaking areas reflected the reactive regions. The bulk indium was rolled before we used it. The procedure to getting rid of the element tin would be repeated several times, it took about six times for the whole process.
3.2 Analysis
3.2.1 Composition testing by EDX & ICP
The ICP was used to test ITO wasted solution before chemical replacement. The previous concentration of ITO wasted solution was compared with that after reducing. The increase of ions was not only the phenomenon was observed, but the decrease of other element was also an important issue. The units of ICP were the ppm, and the instrument was used to test the liquid solutions.
The EDX was used to determine the accuracy of some materials, was attached to the FESEM system; the model for the instrument is JSM-6500F. The figure 3-4 shows the entire instrument. The purity of indium could be defined by EDX. The selection areas could be a wide range for each sample because the partial higher concentration of some impurities would lead to the deviation for the coherent composition of indium. From the EDX analysis, the image for the sample, the suspension, the sponge indium, the pure indium, and the impurities all could be obtained. The previous preparations for the EDX testing were dried and cut the bulk indium into a suitable mass because the samples of SEM were a ten-dollar size.
Fig. 3-4 The instrument of FE-SEM (JSM-6500F)
3.2.2 Microstructures testing by SEM & OM
The purpose for electro-polishing was used to decrease the damages caused by the mechanical polishing. The mechanical polishing was suitable for the metals which have suitable hardness. Because the metal indium was much softer, the mechanical polishing was not used in the situation. After the electro-polishing of the indium surface, the clear grain boundaries and the shapes of grains were observed. In general, the metal which would be polished was put at the anode electrode in the cell. Then the electric current was passed over, the anodic metal would be dissolved in the cell. The principle of electro-polishing would be introduced in figure 3-5 and 3-6, as follow.
1. The first step of AB:
The metal dissolved quickly at the anode electrode.
Fig. 3-5 the reaction steps of electro-polishing. [23]
(The surface of indium would be eaten away.) 2. The second step of BC:
The dissolving rate reached a steady state.
(This is the practical etching step of electro-polishing) 3. The third step of CD:
The current suddenly was arised and the oxygen was occurred at the anode electrode.
Potential of anode Current
density
(a) Rough plane (b) Ground plane (c) Smooth plane Oxygen occurred
Smooth Ground
Fig. 3-6 the relative steps of above. [23]
The figure 3-6 is the final state was expected. The slight changes for the indium surface were obtained by the electrochemical method.
The samples of electro-polishing were the same as that of fabricating AAO (anodic aluminum oxide). The fabricating instruments in our labs were already used for several years. Avoid the water and gas, the sample offered an available capacity for the metal indium. In the figure 3-7(a), the indium would be put in the left white holder. The pictures of samples were shown in figure 3-7 (a)-(b).
(a) (b)
Fig.3-7 The samples of electro-polishing. (a) The front view of holder and it had a conductive piece of Cu. (b) The holder were used to put the indium in it.
After electro-polishing, the OM (optical microscope) was used to characterize the indium microstructure. The images about grains, grain boundaries, and twins also could be found. These images offered the references for the definition of indium, and the most important definition was the information of EDX. The EDX could provide the statistics of composition, as well as the quantification data also confirmed the result of purity. Finally, the summary of the experiment would be depicted at the figure 3-8.
Wasted FPD substrates Wasted ITO targets on chamber
ITO wasted materials ITO wasted mud
Sieving
Dissolving in saturated HCl
Take the solution with no precipitates
The ICP test for ITO wasted solution Reduction & replacement The EDX
test Pyrometallurgy
Removal of slags by water
Cut metal indium into suitable size
Electro-polishing
OM images
The EDX test
Chapter 4
Results and Discussions
4.1 The thermodynamic theorems in the hydrometallurgy 4.1.1 The pourbaix diagram of Zn and Mg
The pourbaix diagram of Zn and Mg was introduced in the section. They are also two reducing agents in the hydrometallurgy, and it pointed out the proper states of Zn2+ and Mg2+ to replace the In3+ from ITO wasted solution. In section 2.3.2, pourbaix diagram consisted of the reduction potential and the pH value was mentioned. If the proper acidic states could be controlled, the In3+ ions could be replaced from the wasted solution after adding a suitable electro-voltage. First, the simple pourbaix diagram of Mg was shown in the figure 4-1.
Magnesium is a very base metal and also a powerful reducing agent. From the figure 4-1, at pH’s above about 8.5 and up to 11.5 it can cover itself with more or less protective oxide or hydroxide which checks the dissolution reaction. On account of the low value of the equilibrium potential of the reaction, it is impossible to prepare metallic magnesium by the electrolysis of its aqueous solution. It would lead to the evolution of hydrogen at the cathode without the formation of magnesium.
In the figure 4-1, it pointed out the oxidation of magnesium in alkaline solution could give rise to the formation of the oxide MgO and the hydroxide Mg(OH)2, neither of which possesses any amphoteric character. A reaction
MgO + H2O = Mg(OH)2 could present the relationship between the two kinds
of compound[24]. In the research, Mg powder was used to recycling the ITO wasted solution.
Zinc appears to be a base metal. In the figure 4-2, the ε-Zn(OH)2 is the
most stable form in aqueous solution. In agreement with the value of free enthalpy of formation, -133626 cal, ε-Zn(OH)2 was with the smallest value
compared to others.[16] The compound ε-Zn(OH)2 was stable in the alkaline
solutions of pH value between about 8.5 and 10.5, and it also should be operated at a suitable electro-voltage. If the zinc is put in contact with a metal of low hydrogen over potential liked platinum, an abundant evolution of hydrogen on the platinum then occurs simultaneously with the corrosion of the zinc. [25]
It was possible to produce metallic zinc by the reduction of aqueous solutions of zinc salts. As we knew, this reduction is brought about industrially by the electrolysis of acidic solutions (buffered with acetic acid and acetates) or alkaline solutions (zincates or cyanide complexes). On account of its electronegative character and its small “self-corrosion” [26], zinc was a metal which lends itself well to use as a sacrificial anode for the protection of iron and other metals.
From the fig. 4-1 and 4-2, it was obvious that no interphase compound was produced between Mg and Mg2+ and Zn and Zn2+. During the process of hydrometallurgy, it’s unnecessary to consider other oxidation reactions except those of Mg → Mg + 2e- and Zn → Zn2+ +2e-. No complex compounds was produced in the replacement, and it is the reason that we didn’t choose the element Ca as reducing agent.(in previous section 2.3.2) The table 4-1 shows the comparison of two reducing agents in the hydrometallurgy.
Table 4-1 The summary of two kinds of reducing agents in the hydrometallurgy
catalog of ITO conditions
ITO wasted solution ITO wasted mud
Reducing agent
Mg, ψ=325mesh Zn, ψ=325mesh Heat
No Yes
△H △H<< 0,exothermic △H<0, it could work over T = 60℃,exothermic Shapes of
indium After replacement
Sponge indium would be got, the dry powder is soft.
Sponge indium would be got, the dry powder is tough.
Get rid of reagents after pyrometallurgy
It has great oxidation ability, and would be eliminated
easily by forming MgO
It has general oxidation ability and would be eliminated by
forming ZnO
Organizations
from OM Clear grainboundries
Clear grainboundries & pitting point would be occured
Slags
NaOH+ impurities KOH+ impurities
Purity of
4.2 The ICP and EDX results of ITO wasted solution after hydrometallurgy 4.2.1 The EDX results of FPD wasted substrates
The SEM images of FPD wasted substrates were depicted in the figure 4-3 (a)-(f).
(a) (b)
Fig.4-3 The different parts of FPD wasted substrates. (a) Al substrates, 50X. (b) Al substrates, 200X. (c) The ITO films, 1000X. (d) The ITO films, 2000X. (e) The ITO films, 500X. (f) The ITO films, 3000X.
(c)
(f) (e)
(a) (weight %) O: 59.47 Al: 32.44 In: 6.36 Cl: 1.73 (weight %) (b) (c) (d) Al: 100
(e)
(h)
(g) Fig. 4-4 (a)-(h) EDX results of the ITO wasted
materials. (a) SEM images of Al fragments. (drug-formed) (b) EDX results of Al fragments. (c) SEM images of Al substrates. (d) EDX results of Al substrates. (e) SEM images of ITO films. (f) EDX results of ITO films. (g) SEM images of ITO films (needle-formed). (h) EDX results of ITO films.
Sn: 8.98 In: 64.03 Al: 1.76 O: 25.23 (weight %) Sn: 12.06 In: 55.54 Al: 4.86 (weight %) O: 22.61 (f)
Before making the ITO acidic solution, Al substrates could be separated from the ITO films. According to the figure 4-4 (a), the drug-formed and some large flat regions could be the Al substrates. These Al substrates could be sieved before dissolving the ITO wasted materials. Furthermore, the needle-formed structures could be the ITO films in the figure 4-4 (e) & (g); the proportion for In to Sn is near the composition of the ITO film, consisted of 90% In2O3 + 10% SnO2.
4.2.2 The results of removal of Sn
The chemical reduction method was used to remove element Sn in the research. The pure indium plate with a purity of 5N could be put in the ITO wasted solution before hydrometallurgy. According to the figure 2-3, the oxidation potential of In is lower than that of Sn. while we operated at the temperature 60℃, the Sn powder would be replaced onto the pure indium plate. The EDX results were shown in the figure 4-5 (a)-(f).
(a)
(c)
(f) (e)
(d)
Fig. 4-5 (a)-(f) the EDX results for removal of Sn powder. (a) SEM images of indium plate with Sn powder. (b) EDX results of indium plate, and Sn powder was retained on it. (c) SEM images of the powder onto indium plate. (d) EDX result of the powder, and it was composed of Sn. (e) SEM images of “clean” indium plate. (f) EDX results of indium plate, and it was all composed of In.
In the figure 4-5 (d), the EDX results of Sn were found. Therefore, the composition of Sn was removed completely if the step was repeated several times. No matter in the ITO wasted solution or in the ITO wasted mud, the procedure of removal of Sn was still the step before hydrometallurgy. The results confirmed the pure indium plate was successful to replace Sn from ITO wasted solution.
4.2.3 The ICP results and the analysis of suspension before hydrometallurgy Table 4-2 The results of ICP test.
concentration Ions
before reduction after reduction Comparison results
Al 2.7 wt% 2.7 wt% The same
Sn 0.8 wt% 0.0 wt% Decrease
In 4.47 wt% 5.62 wt% Increase
In Table 4-2, it was used to compare the changes of indium ions after hydrometallurgy. The quantity of indium is obviously large after the replacement from ITO wasted solution. In addition, the quantity of tin ions was decreasing after that. Some components were suspended on the top of solution if dissolving the ITO wasted materials with HCl. The kind of components we called the “suspension”, it consisted of these elements, such as aluminum and tin. It’s useful to decrease the tin concentration in original wasted solution.
the original ITO solution. From the results of EDX, The signals of Sn are larger than that of Al because the quantities of Sn are relatively high. In the figure 4-6 (a) and (b), the suspension of ITO wasted solution was shown. The signals of Al and Sn could be found, and still a signal of Cl- in it. After dissolving in the
HCl, some quantities of Al and Sn would be replaced without hydrometallurgy.
(a)
Fig.4-6 The EDX results of suspension. (a) SEM images of suspension. (b) EDX results of suspension, and the signals of Al and Sn were evident.
(b)
4.2.4 The EDX results of sponge indium after hydrometallurgy
In the figure 4-7, the EDX results were introduced that sponge indium was replaced by Zn powder. Many kinds of elements, such as Al, Zn, Cl, and In involved in the sponge indium. The purpose of hydrometallurgy was replaced “raw indium” from the ITO wasted solution. In the process of replacement, we stirred the solution and put the reducing agents at the same time. As we stirred the solution, the swirls would make the raw indium congregate. The raw metal indium would be put in the acetone after getting it out of water.
(a)
Fig.4-7 (a)-(b) The EDX results of sponge indium was replaced by Zn. (a) SEM images of sponge indium. (b) EDX results of sponge indium, and the raw indium included many kinds of elements.
(b)
In the figure 4-8 (a)-(b), the EDX results were introduced the sponge indium which was replaced by Mg powder. The composition of Mg was still retained in it, and the weight percent was about 2.88%. Many elements could be found in the sponge indium, such as Al, Cl, and In. After pyrometallurgy, the pure indium could be attained, and the results were showed in the section 4.4.
Fig.4-8 (a)-(b) the EDX results of sponge indium was replaced by Mg. (a) SEM images of sponge indium. (b) Residual Mg could be found in the raw indium.
Element Weight% Atomic% O K 44.06 67.25 Mg K 2.88 2.89 Al K 23.19 20.99 Cl K 5.28 3.64 In L 24.59 5.23 Totals 100.00 (b)
From the figure 4-8 and 4-9, some phenomena could be found. While the indium was still the sponge indium, some elements like Mg, Zn, Al, and Cl were all presented in the sponge indium without doing the pyrometallurgy. Therefore, pyrometallurgy was used to refine the sponge indium, and the impurities were eliminated during the process. During the process, the slags were produced to extract the impurities and the purity of indium was raised.
4.3 The ICP and EDX results of ITO wasted mud after hydrometallurgy 4.3.1 The EDX results of ITO wasted mud
The concept for using sands to collide the inner sputter chamber wall (the residual ITO targets fragments) was for the reason that the inefficient way to use the ITO targets. Then the sands with ITO would be dissolved in acidic solution and make the sands without ITO precipitated underneath the 5000ml beaker. The color change of sands was observed during the process. As the sands without the compositions of ITO, it changed the color of bright white. As the sands with the compositions of ITO, it was the color of dark green. In other words, the color change is from dark to light while the sands had few compositions of ITO.
![Fig. 1-1 the refinement situation of world countries (1995~2001) [1]](https://thumb-ap.123doks.com/thumbv2/9libinfo/8254902.171842/19.892.132.762.717.1094/fig-refinement-situation-world-countries.webp)
![Fig. 1-2 the indium supply and demand forecasts [4]](https://thumb-ap.123doks.com/thumbv2/9libinfo/8254902.171842/20.892.206.668.501.814/fig-indium-supply-demand-forecasts.webp)
![Table 2-1 The consumption of indium for various countries [6]](https://thumb-ap.123doks.com/thumbv2/9libinfo/8254902.171842/23.892.128.771.323.790/table-consumption-indium-various-countries.webp)
![Fig. 2-1 The forecasts for products quantities of thin film solar cell [14]](https://thumb-ap.123doks.com/thumbv2/9libinfo/8254902.171842/26.892.172.724.683.1047/fig-forecasts-products-quantities-film-solar-cell.webp)
![Fig. 2-2 The current extracting process and applications of indium [4]](https://thumb-ap.123doks.com/thumbv2/9libinfo/8254902.171842/28.892.171.715.109.452/fig-current-extracting-process-applications-indium.webp)