Solvation and microscopic properties of ionic liquid/acetonitrile mixtures probed by
high-pressure infrared spectroscopy
Yasuhiro Umebayashi, Jyh-Chiang Jiang, Kuan-Hung Lin, Yu-Lun Shan, Kenta Fujii, Shiro Seki, Shin-Ichi Ishiguro, Sheng Hsien Lin, and Hai-Chou Chang
Citation: The Journal of Chemical Physics 131, 234502 (2009); doi: 10.1063/1.3273206 View online: http://dx.doi.org/10.1063/1.3273206
View Table of Contents: http://scitation.aip.org/content/aip/journal/jcp/131/23?ver=pdfcov Published by the AIP Publishing
Articles you may be interested in
Association structures of ionic liquid/DMSO mixtures studied by high-pressure infrared spectroscopy J. Chem. Phys. 134, 044506 (2011); 10.1063/1.3526485
Structural change of ionic association in ionic liquid/water mixtures: A high-pressure infrared spectroscopic study J. Chem. Phys. 130, 124503 (2009); 10.1063/1.3100099
The methyl C–H blueshift in N , N -dimethylformamide-water mixtures probed by two-dimensional Fourier-transform infrared spectroscopy
J. Chem. Phys. 124, 244502 (2006); 10.1063/1.2206177
Erratum: “Infrared study of water–benzene mixtures at high temperatures and pressures in the two- and one-phase regions” [J. Chem. Phys. 113, 1942 (2000)]
J. Chem. Phys. 113, 8390 (2000); 10.1063/1.1316005
Infrared study of water–benzene mixtures at high temperatures and pressures in the two- and one-phase regions J. Chem. Phys. 113, 1942 (2000); 10.1063/1.481998
Solvation and microscopic properties of ionic liquid/acetonitrile mixtures
probed by high-pressure infrared spectroscopy
Yasuhiro Umebayashi,1Jyh-Chiang Jiang,2Kuan-Hung Lin,3Yu-Lun Shan,3Kenta Fujii,4 Shiro Seki,5Shin-Ichi Ishiguro,1Sheng Hsien Lin,6,7and Hai-Chou Chang3,a兲
1
Department of Chemistry, Faculty of Science, Kyushu University, Hakozaki, Higashi-ku, Fukuoko 812-8581, Japan
2Department of Chemical Engineering, National Taiwan University of Science and Technology,
Taipei 106, Taiwan
3Department of Chemistry, National Dong Hwa University, Shoufeng, Hualien 974, Taiwan
4Department of Chemistry and Applied Chemistry, Faculty of Science and Engineering, Saga University,
Honjo-machi, Saga 840-8502, Japan
5Materials Science Research Laboratory, Central Research Institute of Electric Power Industry,
Komae, Tokyo 201-8511, Japan
6
Department of Applied Chemistry, National Chiao Tung University, Hsinchu 30010, Taiwan
7
Institute of Atomic and Molecular Sciences, Academia Sinica, P.O. Box 23-166, Taipei 106, Taiwan
共Received 8 September 2009; accepted 19 November 2009; published online 17 December 2009兲 The microscopic features of binary mixtures formed by an ionic liquid共EMI+TFSA−or EMI+FSA−兲
and a molecular liquid共acetonitrile or methanol兲 have been investigated by high-pressure infrared spectroscopy. On the basis of its responses to changes in pressure and concentration, the imidazolium C–H appears to exist at least in two different forms, i.e., isolated and associated structures. The weak band at approximately 3102 cm−1should be assigned to the isolated structure.
CD3CN can be added to change the structural organization of ionic liquids. The compression of an EMI+TFSA−/CD
3CN mixture leads to the increase in the isolated C–H band intensity. Nevertheless,
the loss in intensity of the isolated structures was observed for EMI+FSA−/CD
3CN mixtures as the
pressure was elevated. In other words, the associated configuration is favored with increasing pressure by debiting the isolated form for EMI+FSA−/CD
3CN mixtures. The stronger C – H¯F
interactions in EMI+FSA− may be one of the reasons for the remarkable differences in the
pressure-dependent results of EMI+TFSA−and EMI+FSA−. © 2009 American Institute of Physics.
关doi:10.1063/1.3273206兴
I. INTRODUCTION
Ionic liquids are salts with a melting temperature below the boiling point of water with negligible vapor pressure and high polarity. In recent years, ionic liquids have attracted considerable interest owing to their characteristics as envi-ronmentally friendly solvents.1–4Due to a number of unique properties, ionic liquids have been used as media for extrac-tions, synthesis, gas storage fluids, and many other applica-tions with industrial potential.1,2The importance of ionic liq-uids has consequently stimulated considerable in their solvation properties and a special issue 共see Refs.5 and6兲
has been devoted to ionic liquids in 2007. Typically ionic liquids are built up by a bulky, asymmetric organic cation to prevent ions from packing easily. This asymmetry opposes the strong charge ordering and a wide liquid range is ob-tained. Some of the best-studied ionic liquids are those bear-ing imidazolium cations.7–11 A number of studies have re-vealed that the structure of imidazolium-based ionic liquids is characterized by short- and long-range ordering that exists in both the solid and more remarkably, liquid states.2,3 Per-haps more importantly, the thermodynamic properties and
functions of ionic liquids can be controlled by judicious se-lection of the anion and cation components. Although ionic liquids have attracted much attention because of their useful characteristics, some fundamental questions still remain to be answered regarding the nature of the liquid state. Ionic liquids are composed of a cation and an anion and have an extremely high concentration of ions. Thus, the formation of associated species such as ion pairs and more highly associ-ated ionic aggregates may be expected in neat ionic liquids.12–14The x-ray scattering paper by Triolo et al.14have demonstrated that structures having length scales ranging from 14 to 26 Å may exist in imidazolium ionic liquids having alkyl chains with 4–10 carbons. The size of structural heterogeneities is found to linearly scale with the alkyl chain length.
Studies on ionic liquid-based mixtures become more and more attractive in recent years.15–17The addition of water to ionic liquids is very common in biocatalytic work and the molecular state of water was investigated in some ionic liquids.18 Water molecules seem to be separated from each other at low content, while self-association appears at higher concentration. The role of water in ionic liquids is complex and depends on the supramolecular structures of ionic liq-uids. At high ionic liquid concentrations ionic liquids seem to form clusters as in the pure state and water molecules a兲Author to whom correspondence should be addressed. Electronic mail:
hcchang@mail.ndhu.edu.tw. FAX: 8633570. Tel.: ⫹886-3-8633585.
0021-9606/2009/131共23兲/234502/7/$25.00 131, 234502-1 © 2009 American Institute of Physics This article is copyrighted as indicated in the article. Reuse of AIP content is subject to the terms at: http://scitation.aip.org/termsconditions. Downloaded to IP:
interact with the clusters without interacting among them-selves. Compared to the intensive investigations on the ionic liquid/water mixtures, there have been a few reports on sol-vation behavior of ionic liquid in nonaqueous molecular uids and our knowledge of the interaction between ionic liq-uids and organic solvents remain somewhat empirical. In the present study, our intent is to achieve further understanding of physicochemical properties in ionic liquid/CD3CN or
methanol-d4mixtures.
To understand the physical chemistry in ionic liquids, solvation dynamics are to be known. There is a strong litera-ture existing related to dynamical properties in ionic liquids.19–28 The early solvation dynamics measurement in ionic liquids based on the fluorescence behavior of C153 have indicated that the time-resolvable part of the dynamics is biphasic in nature.24 Major questions regarding dynamic solvation by ionic liquids deal with whether the cation or anion solvates preferentially on different time scales, the role of the correlated motion of the ion pairs and their lifetime, and the importance of translational motion of the ion relative to dipolar relaxation. Several groups have used the femtosec-ond optical heterodyne-detected Raman-induced Kerr effect spectroscopy 共OHD-RIKES兲 method to characterize the dy-namics in ionic liquids.6Experimental techniques, such as IR spectroscopy, were often used to explore hydrogen-bonding structures of ionic liquid-based mixtures. Many of these re-searches are interested in the interactions between water and anions. For instance, the molecular states of water absorbed from air in ionic liquids have been studied by vibrational spectroscopy, which indicates that water molecules interact with the anions and exist in symmetric 1:2 type hydrogen-bonded complexes.29,30However, the interactions of water or organic solvent with cations have been limited studied. In this work, we demonstrate that cation-solvent interactions play a non-negligible role in ionic liquid mixtures.
A characteristic feature of hydrogen bonds is that when a hydrogen bond is formed, X–H 共X=O, N, etc.兲 covalent bond elongates and consequently X–H stretching frequency redshifts. However, there are many recent investigations which report blueshifting of C–H stretching mode when C–H hydrogen bonds are formed.31–33As suggested by Hobza et
al.,31 the blueshifting C – H¯O may be attributed to the electron density transfer from the proton acceptor to the re-mote part of the proton donor. Therefore, the blueshifting C – H¯O interactions were labeled as antihydrogen bonds. However, Scheiner et al.32and Dannenberg et al.33have con-cluded from a set of theoretical calculations that antihydro-gen bonds do not differ fundamentally from conventional hydrogen bonds. The origin of both the redshifted and blue-shifted hydrogen bonds may be the same as shown by the Schlegel et al.34and the Hermansson.35Various studies have been made to elucidate the role of weak hydrogen bonds, such as C – H¯O and C–H¯X, in the structure of ionic liquids.15,36 For example, Mele et al. deduce a cation-water interaction from ROESY spectra.36 The aromatic C–H groups, for example, are capable of forming C–H hydrogen bonds, particularly those C–H groups that are adjacent to more electronegative atoms as in imidazolium-based ionic liquids. The observation of the C–H stretching vibration is
one of the keys to characterize the presence of such a weak hydrogen bond and can serve as a useful probe to reflect the interactions between ionic liquid and organic solvents or wa-ter.
The pressure-induced changes of the vibrational charac-teristics are of particular interest.37–41 Studies have shown the potential significance that pressure has on controlling the strength of weak hydrogen bonds. They yield important in-formation on the bonding properties, especially with regard to the interplay of covalent and hydrogen bonding. This is particularly useful because little is known about the relative importance of the hydrophilic versus hydrophobic part of molecules in the collapse and aggregation processes. For the pure chemicals in general, it is well known that the hydrogen-bond network is distorted by pressure. For solu-tions, on the other hand, how the solvation shell responds to pressure variation remains to be investigated. In this study, we combine pressure and vibrational spectroscopy as a win-dow into solvation behaviors in ionic liquid mixtures.
II. EXPERIMENTAL
Samples were prepared using 1-ethyl-3-methylimidazolium bis共trifluoromethylsulfonyl兲amide 共⬎97%,FLUKA兲, acetonitrile-d3共99.96% D, Cambridge Iso-tope兲, and methanol-d4 共99.8% D, Cambridge Isotope兲.
1-Ethyl-3-methylimidazolium bis共fluorosulfonyl兲amide of spectroscopic grade共Dai-ichi Kogyo Seiyaku Co., Ltd.兲 was used without further purification.42 A diamond anvil cell 共DAC兲 of Merril–Bassett design, having a diamond culet size of 0.6 mm, was used for generating pressures up to approxi-mately 2 GPa. Two type-IIa diamonds were used for midin-frared measurements. The sample was contained in a 0.3-mm-diameter hole in a 0.25-mm-thick inconel gasket mounted on the diamond anvil cell. To reduce the absorbance of the samples, CaF2crystals共prepared from a CaF2 optical
window兲 were placed into the holes and compressed firmly prior to inserting the samples. A droplet of a sample filled the empty space of the entire hole of the gasket in the DAC, which was subsequently sealed when the opposed anvils were pushed toward one another. Infrared spectra of the samples were measured on a PerkinElmer Fourier transform spectrophotometer 共model Spectrum RXI兲 equipped with a lithium tantalite midinfrared detector. The infrared beam was condensed through a 5⫻ beam condenser onto the sample in the diamond anvil cell. Typically, we chose a resolution of 4 cm−1 共data point resolution of 2 cm−1兲. For each
spec-trum, typically 1000 scans were compiled. To remove the absorption of the diamond anvils, the absorption spectra of DAC were measured first and subtracted from those of the samples. Pressure calibration follows Wong’s method.43,44 Spectra of samples measured at ambient pressure were taken by filling the samples in a cell having two CaF2windows but
lacking the spacers.
III. RESULTS AND DISCUSSION
Figure1 displays infrared spectra of共a兲 pure 1-ethyl-3-methylimidazolium bis共trifluoromethylsulfonyl兲amide 共EMI+共CF
3SO2兲2N−, EMI+TFSA−兲, 共b兲 pure
1-ethyl-3-234502-2 Umebayashi et al. J. Chem. Phys. 131, 234502共2009兲
methylimidazolium bis共fluorosulfonyl兲amide 共EMI+共FSO
2兲2N−, EMI+FSA−兲, and 共c兲 pure
1-butyl-3-methylimidazolium bis共trifluoromethylsulfonyl兲amide 共BMI+共CF
3SO2兲2N−, BMI+TFSA−兲 obtained under ambient
pressure共see Table Ifor the molecular structures兲. The
bis-共trifluoromethylsulfonyl兲amide anion 共共CF3SO2兲2N−兲 is also
called NTf2−, Tf2N−, and TFSI−in the literature. As indicated
in Fig. 1共a兲, the infrared spectrum of pure EMI+TFSA−
ex-hibits absorption bands at 2890, 2953, 2974, 2991, 3102, 3122, and 3162 cm−1 corresponding to C–H stretching
modes.37–39The 2890, 2953, 2974, and 2991 cm−1bands can
be attributed to C–H stretching modes of the alkyl groups. The bands at 3122 and 3162 cm−1 correspond to coupled imidazolum C–H stretching vibrations. The appearance of a shoulder at approximately 3102 cm−1indicates that the
imi-dazolium C–H may exist at least in two different forms, i.e., isolated and associated structures. The nearly degenerated peaks共3102 and 3122 cm−1兲 may be attributed to the
pertur-bation of neighboring ions in the liquid state. The associated species may be ion pairs共or larger ion clusters兲 and the iso-lated species may mean the dissociation into free ion 共or smaller ion clusters兲.45–47
An indication of ion-pair formation in imidazolium-based ionic liquids was previous reported and a maximum of 30% of all ions form pairs at 273 K.45 Some researchers even considered the neat ionic liquids as an hydrogen bonded polymeric supramolecule.45 As the an-ion is replaced by FSA−in Fig.1共b兲, there are no significant
changes in the shapes of the aliphatic C–H stretching bands. Nevertheless, the relative absorption intensity of the shoulder at approximately 3102 cm−1 slightly decreases in Fig.1共b兲. We note that the spectral feature at approximately 3102 cm−1 is more pronounced for the TFSA− anion
关Figs.1共a兲and1共c兲兴 than for the FSA−anion 关Fig.1共b兲兴.
In order to learn the insight of isolated and associated structures, further concentration-dependent studies on vari-ous amount of ionic liquid/CD3CN and ionic liquid/CD3OD provide direct evidences. Figure 2 presents infrared spectra of ionic liquid/CD3CN mixtures 共curves a–c兲 and ionic
liquid/CD3OD mixtures共curves d and e兲 obtained under
am-FIG. 1. IR spectra of pure 共a兲 EMI+TFSA−, 共b兲 EMI+FSA−, and 共c兲 BMI+TFSA−obtained under ambient pressure.
TABLE I. Calculated total interaction energies共kcal/mol兲.
Speciesa–c −⌬Ed
EMI+TFSA− 72.58
a 78.13
b 79.29
c 78.49
d 79.74
aStructures illustrated in Fig.6. bTFSA−:关共CF
3SO2兲2N−兴, FSA−:关共FSO2兲2N−兴. cEMI+:
dBasis-set superposition error共BSSE兲 corrected.
FIG. 2. IR spectra of 共a兲 EMI+TFSA−/CD
3CN,共b兲 EMI+FSA−/CD3CN, 共c兲 BMI+TFSA−/CD
3CN, 共d兲 EMI+TFSA−/CD3OD, and 共e兲 BMI+TFSA−/CD
3OD. The mole fractions of ionic liquids are 共a兲 0.07, 共b兲 0.09, 共c兲 0.08, 共d兲 0.04, and 共e兲 0.06.
bient pressure. As revealed, no appreciable changes in band frequencies and shapes of the alkyl C–H stretching bands occur due to the presence of CD3CN in Fig.2共a兲.
Neverthe-less, an increase in the imidazolium C–H intensity at ap-proximately 3102 cm−1was observed in Fig. 2共a兲. This ob-servation is likely related to local structures of the imidazolium ring. Based on the concentration-dependent re-sults, this spectral feature at approximately 3102 cm−1
should be assigned to the isolated共or dissociated兲 structure. A possible explanation is that the relative contribution of the isolated and associated components is different for the EMI+TFSA−/CD3CN mixture. In other terms, CD3CN can
be added to change the structural organization of EMI+TFSA− 关Fig. 2共a兲兴 and BMI+TFSA− 关Fig. 2共c兲兴.
Al-though the local organization between the ionic species is preliminary governed by electrostatic interactions, the C – H¯N interaction between the negative N atom in CD3CN and the positive H atoms in the imidazolium C2– H
may be a compensatory mechanism to provide additional stability and enhances the dissociation as pointed out by Triolo et al.48It is instructive to note that the isolated feature at approximately 3102 cm−1 is more pronounced for the TFSA−anion 关Figs.2共a兲 and2共c兲兴 than for the FSA− anion
关Fig.2共b兲兴. Indeed, evolution of the relative band intensities at 3102 and 3119 cm−1is consistent with the signature of an
isolated-associated structural equilibrium. As revealed in Figs. 2共d兲 and 2共e兲, weaker profiles at approximately 3102 cm−1 were observed for methanol-d
4 mixtures. These
results in Figs.2共d兲and2共e兲suggest that the nature of local organization of imidazolium C–H in CD3OD mixtures is
dif-ferent from that in CD3CN mixtures.49 The imidazolium C–H spectral features observed in Figs.2共d兲and2共e兲may be related to the geometrical properties of hydrogen-bond net-work in liquid methanol. Molecules in pure methanol tend to form chains with an average chain length of five or so molecules.50 In the EMI+TFSA−/CD
3OD 关Fig. 2共d兲兴 and
BMI+TFSA−/CD3OD mixtures, CD3OD molecules may
pre-fer to aggregate with themselves by hydrogen bonding, and TFSA−interacts with the cations to form associated configu-rations.
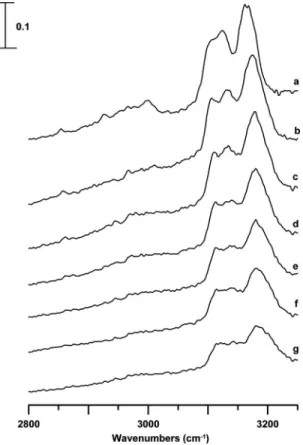
Figure 3 displays infrared spectra of an EMI+TFSA−/CD3CN mixture 共mole fraction of
EMI+TFSA−: 0.08兲 obtained under ambient pressure 共curve
a兲, 0.3 共curve b兲, 0.9 共curve c兲, 1.5 共curve d兲, 1.9 共curve e兲, 2.3共curve f兲, and 2.5 GPa 共curve g兲. Figure3共a兲reveals the imidazolium C–H absorption at 3102, 3124, and 3164 cm−1.
As the sample was compressed that is increasing the pressure from ambient关Fig.3共a兲兴 to 0.3 GPa 关Fig.3共b兲兴, the imidazo-lium C–H bands were blueshifted to 3106, 3133, and 3174 cm−1, respectively. The pressure-induced frequency shift of the imidazolium C–H band at approximately 3102 cm−1 共isolated structure兲 is relatively small, while the
bands at approximately 3124 and 3164 cm−1 are more
pressure-sensitive than the isolated feature. Changes in the relative band intensities of the imidazolium bands also oc-curred as the pressure was elevated in Fig. 3. As shown in Fig.3, the compression leads to the increase in the isolated C–H 共at approximately 3102 cm−1兲 band intensity. It is
likely that some associated species are switched to the iso-lated form共or some orderly oriented clusters兲 as high pres-sures are applied.
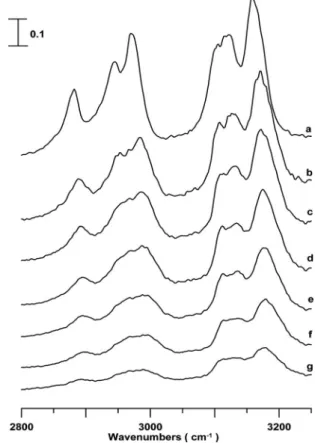
Figure 4 illustrates infrared spectra of an EMI+FSA−/CD3CN mixture 共mole fraction of
EMI+FSA−: 0.09兲 obtained under ambient pressure 共curve a兲, 0.3共curve b兲, 0.9 共curve c兲, 1.5 共curve d兲, 1.9 共curve e兲, 2.1 共curve f兲, and 2.5 GPa 共curve g兲. The C–H stretching modes underwent dramatic changes in their spectral profiles as the pressure was elevated to 0.3 GPa in curve b. As revealed, Fig.4共b兲 shows the loss in intensity of those nearly degen-erated bands attributed to the isolated structures. In other words, the associated configuration is favored with increas-ing pressure by debitincreas-ing the isolated form in Fig.4共b兲. As the pressure was further elevated, the alkyl and imidazolium C–H bands were blueshifted in Figs.4共b兲–4共g兲. The mono-tonic blueshift in frequency for the characteristic C–H bands 共P⬎0.3 GPa兲 suggests that the associated configurations seems to be thermodynamically stable up to the pressure of 2.5 GPa. It is known that cohesion in ionic liquids is strong and mostly electrostatic, while previous studies indicate that the interaction energies of EMI+TFSA−and EMI+FSA−
com-plexes are very similar. Therefore, some other factors such as weak hydrogen bonds may play the non-negligible role in the structures of EMI+TFSA− and EMI+FSA−. Average NBO
charges of F atoms in TFSA−and FSA−are equal to ⫺0.36
and ⫺0.51, respectively.37 The stronger C – H¯F interac-tions in EMI+FSA− may be one of the reasons for the
re-markable differences in the concentration- and pressure-FIG. 3. IR spectra of a EMI+TFSA−/CD
3CN mixture 共mole fraction of EMI+TFSA−: approximately 0.08兲 obtained under ambient pressure 共curve a兲 and at 0.3 共curve b兲, 0.9 共curve c兲, 1.5 共curve d兲, 1.9 共curve e兲, 2.3共curve f兲, and 2.5 GPa 共curve g兲.
234502-4 Umebayashi et al. J. Chem. Phys. 131, 234502共2009兲
dependent results of EMI+TFSA− and EMI+FSA−.37 It was known that a number of configurations are possible for EMI+TFSA−.37,45,51
The imidazolium cation can be also hydrogen-bonded via C – H¯N 共Ref. 45兲 and C–H¯O
共Ref.51兲 interactions.
To learn the alkyl chain-length dependence of the cat-ions, the pressure study of BMI+TFSA− seems to offer the direct approach. Figure 5 illustrates infrared spectra of an BMI+TFSA−/CD3CN mixture 共mole fraction of
BMI+TFSA−: 0.07兲 obtained under ambient pressure 共curve
a兲, 0.3 共curve b兲, 0.9 共curve c兲, 1.5 共curve d兲, 1.9 共curve e兲, 2.1共curve f兲, and 2.5 GPa 共curve g兲. For ionic liquids involv-ing imidazolium cations, the relative distance between the two cations slightly increases as the alkyl chain lengthens. The increase in the alkyl chain length may weaken the at-tractive anion-cation interaction energies by a few percent. The observed IR absorption profiles in Fig. 5 clearly show that the relative intensities of the isolated/associated forms are similar to those found with the reference ionic liquid 关EMI+TFSA−兴 共see Fig.3兲. This observation leads us to
sug-gest that the increase in the alkyl chain length may not sig-nificantly perturb the isolated-associated structural equilib-rium in CD3CN mixtures.
Figure 6 displays the predicted structures of EMI+TFSA−-acetonitrile 关Figs. 6共a兲 and 6共b兲兴 and
EMI+TFSA−-methanol关Figs.6共c兲and6共d兲兴 clusters. Density
functional theory calculations were performed at the
B3LYP/6-31+ Gⴱ level.52Energy results are shown in Table
I. It was known that the TFSA−anion shows similar
intensi-ties of both the trans and cis conformers as revealed in OHD-RIKES spectra.6 For the purpose of comparison with previous TFSA−calculations,45
we only show the calculation results of the trans conformer in Fig.6. As revealed in Table
I, the interaction between EMI+and TFSA− is mostly elec-trostatic, i.e., ⫺72.58 kcal/mol. By comparing FIG. 4. IR spectra of a EMI+FSA−/CD
3CN mixture having mole fraction of EMI+FSA−equal to 0.09 obtained under ambient pressure共curve a兲 and at 0.3共curve b兲, 0.9 共curve c兲, 1.5 共curve d兲, 1.9 共curve e兲, 2.3 共curve f兲, and 2.5 GPa共curve g兲.
FIG. 5. IR spectra of a BMI+TFSA−/CD
3CN mixture having mole fraction of BMI+TFSA−equal to 0.07 obtained under ambient pressure共curve a兲 and at 0.3共curve b兲, 0.9 共curve c兲, 1.5 共curve d兲, 1.9 共curve e兲, 2.3 共curve f兲, and 2.5 GPa共curve g兲.
FIG. 6. Optimized structures of EMI+TFSA−-acetonitrile关共a兲 and 共b兲兴 and EMI+TFSA−-methanol关共c兲 and 共d兲兴.
EMI+TFSA−-acetonitrile 关Figs. 6共a兲 and 6共b兲兴 and
EMI+TFSA−-methanol 关Figs. 6共c兲 and 6共d兲兴, we observe
similar total interaction energies 共78 or 79 kcal/mol兲. The differences in total interaction energies represent the energy needed to separate the trimolecular complexes into a EMI+TFSA− and a single acetonitrile共78−73=5 kcal/mol兲
or a single methanol 共79−73=6 kcal/mol兲. It appears that C – H¯N and C–H¯O interactions somehow provide complementary stabilization energies 共approximately 5 or 6 kcal/mol兲 in the structures of EMI+TFSA−-acetonitrile and
EMI+TFSA−-methanol clusters in Fig.6 and TableI.
Never-theless, our experimental measurements共Figs.2兲 reveal the
remarkable differences of the local imidazolium C–H orga-nization in acetonitirle-d3and methanol-d4mixtures,
respec-tively. Thus, the interaction between EMI+TFSA− and acetonitrile/methanol may not be the solely factor to perturb the geometrical properties in ionic liquid mixtures. These observations support our arguments that the aggregation be-haviors of the organic solvent 共methanol兲 may play non-negligible roles. In O – H¯O hydrogen bonding, methanol molecules can act as both proton donors and acceptors and aggregate with themselves. On the other hand, acetonitrile molecules weakly interact with themselves by the dipole-dipole interactions.
IV. CONCLUSION
Association structures between ionic liquids 共EMI+TFSA−, EMI+FSA−兲 and conventional solvents
共aceto-nitrile, methanol兲 have been investigated in this study. The infrared spectral features indicate that imidazolium C–H may exist in isolated and associated forms. Our results suggest that the nature of local organization of imidazolium C–H in methanol-d4 mixtures is different from that in acetonitril-d3
mixtures. In the EMI+TFSA−/CD3OD 关Fig. 2共d兲兴 and
BMI+TFSA−/CD3OD mixtures, CD3OD molecules may
pre-fer to aggregate with themselves by hydrogen bonding, and TFSA−interacts with the cations to form associated configu-rations. As an EMI+TFSA−/CD3CN mixture was
com-pressed, the increase in the isolated C–H band intensity was observed and some associated species are switched to the isolated form. However, the associated configuration is fa-vored with increasing pressure for EMI+FSA−/CD3CN
mix-tures.
ACKNOWLEDGMENTS
The authors thank the National Dong Hwa University and the National Science Council 共Contract No. NSC 98-2113-M-259-005-MY3兲 of Taiwan for financial support. This work has been financially supported by Grant-in-Aids for Scientific Research 共Contract Nos. 18850017, 19003963, 19350033, and 20350037兲 from the Ministry of Education, Culture, Sports, Science and Technology, Japan. The authors thank Mr. Kai-Chan Hung for his assistance.
1Green Industrial Applications of Ionic Liquids, NATO Science Series, edited by R. D. Rogers, K. R. Seddon, and S. Volkov共Kluwer, Dordrecht, 2002兲.
2Ionic Liquids in Synthesis, edited by P. Wasserscheid and T. Welton 共Wiley VCH, Weinheim, 2008兲.
3H. Weingärtner,Angew. Chem., Int. Ed. 47, 654共2008兲.
4L. Leclercq and A. R. Schmitzer,Supramol. Chem. 21, 245共2009兲. 5C. Hardacre, J. D. Holbrey, M. Nieuwenhuyzen, and T. G. A. Youngs,
Acc. Chem. Res. 40, 1146共2007兲.
6E. W. Castner, Jr., J. F. Wishart, and H. Shirota,Acc. Chem. Res. 40, 1217共2007兲.
7S. Scheiner, T. Kar, and J. Pattanayak,J. Am. Chem. Soc. 124, 13257 共2002兲.
8R. M. Lynden-Bell and T. G. A. Youngs,J. Phys.: Condens. Matter 21, 424120共2009兲.
9I. Dinarès, C. G. de Mignel, A. Ibanez, N. Mesquida, and E. Alcalde, Green Chem. 11, 1507共2009兲.
10H. L. Ma, W. J. Jin, L. Xi, and Z. J. Dong,Spectrochim. Acta, Part A74, 502共2009兲.
11V. B. Rogankov, V. I. Levchenko, and Y. K. Kornienko,J. Mol. Liq.148, 18共2009兲.
12U. Schröder, J. D. Wadhawan, R. G. Compton, F. Marken, P. A. Z. Suarez, C. S. Consorti, R. F. de Souza, and J. Dupont,New J. Chem.24,
1009共2000兲.
13Y. Wang and G. A. Voth,J. Phys. Chem. B 110, 18601共2006兲. 14A. Triolo, O. Russina, H. J. Bleif, and E. Di Cola,J. Phys. Chem. B 111,
4641共2007兲.
15C. Spickermann, J. Thar, S. B. C. Lehmann, S. Zahn, J. Hunger, R. Buchner, P. A. Hunt, T. Welton, and B. Kirchner,J. Chem. Phys. 129,
104505共2008兲.
16K. S. Mali, G. B. Dutt, and T. Mukherjee,J. Chem. Phys. 128, 054504 共2008兲.
17K. Behera, M. D. Pandey, M. Porel, and S. Pandey,J. Chem. Phys.127, 184501共2007兲.
18R. A. Sheldon,Green Chem. 7, 267共2005兲.
19J. H. Werner, S. N. Baker, and G. A. Baker,Analyst共Cambridge, U.K.兲
128, 786共2003兲.
20S. Arzhantsev, H. Jin, G. A. Baker, and M. Maroncelli,J. Phys. Chem. B
111, 4978共2007兲.
21S. N. Baker, G. A. Baker, and F. V. Bright,Green Chem.4, 165共2002兲. 22D. Seth, S. Sarkar, and N. Sarkar,J. Phys. Chem. B 112, 2629共2008兲. 23A. Sarkar and S. Pandey,J. Chem. Eng. Data 51, 2051共2006兲. 24R. Karmakar and A. Samanta,J. Phys. Chem. A 106, 4447共2002兲. 25A. Paul and A. Samanta,J. Phys. Chem. B 112, 947共2008兲.
26W. E. Gardinier, G. A. Baker, S. N. Baker, and F. V. Bright, Macromol-ecules 38, 8574共2005兲.
27D. Chakrabarty, A. Chakraborty, D. Seth, P. Hazra, and N. Sarkar,Chem. Phys. Lett. 397, 469共2004兲.
28H. V. R. Annapureddy, Z. Hu, J. Xia, and C. J. Margulis,J. Phys. Chem. B 112, 1770共2008兲.
29L. Cammarata, S. G. Kazarian, P. A. Salter, and T. Welton,Phys. Chem. Chem. Phys. 3, 5192共2001兲.
30Y. Danten, M. I. Cabaco, and M. Besnard,J. Phys. Chem. A 113, 2873 共2009兲.
31P. Hobza and Z. Havlas, Chem. Rev. 共Washington, D.C.兲 100, 4253 共2000兲.
32Y. L. Gu, T. Kar, and S. Scheiner,J. Am. Chem. Soc. 121, 9411共1999兲. 33A. Masunov, J. J. Dannenberg, and R. H. Contreras,J. Phys. Chem. A
105, 4737共2001兲.
34X. Li, L. Liu, and H. B. Schlegel,J. Am. Chem. Soc. 124, 9639共2002兲. 35K. Hermansson,J. Phys. Chem. A 106, 4695共2002兲.
36A. Mele, C. D. Tran, and S. H. De Paoli Lacerda,Angew. Chem., Int. Ed.
42, 4364共2003兲.
37Y. Umebayashi, J. C. Jiang, Y. L. Shan, K. H. Lin, K. Fujii, S. Seki, S. Ishiguro, S. H. Lin, and H. C. Chang, J. Chem. Phys. 130, 124503
共2009兲.
38H. C. Chang, J. C. Jiang, Y. C. Liou, C. H. Hung, T. Y. Lai, and S. H. Lin, J. Chem. Phys. 129, 044506共2008兲.
39H. C. Chang, J. C. Jiang, J. C. Su, C. Y. Chang, and S. H. Lin,J. Phys. Chem. A 111, 9201共2007兲.
40L. Su, L. Li, Y. Hu, C. Yuan, C. Shao, and S. Hong,J. Chem. Phys. 130, 184503共2009兲.
41D. Liu, W. Lei, K. Wang, G. Bao, F. Li, J. Hao, B. Liu, T. Cui, Q. Cui, and G. Zou,J. Phys. Chem. B 113, 7430共2009兲.
42K. Fujii, S. Seki, S. Fukuda, R. Kanzaki, T. Takamuku, Y. Umebayashi, and S. Ishiguro,J. Phys. Chem. B 111, 12829共2007兲.
43P. T. T. Wong, D. J. Moffatt, and F. L. Baudais,Appl. Spectrosc. 39, 733 共1985兲.
234502-6 Umebayashi et al. J. Chem. Phys. 131, 234502共2009兲
44P. T. T. Wong and D. J. Moffatt,Appl. Spectrosc. 41, 1070共1987兲. 45T. Köddermann, C. Wertz, A. Heintz, and R. Ludwig,ChemPhysChem 7,
1944共2006兲.
46R. Katoh, M. Hara, and S. Tsuzuki,J. Phys. Chem. B 112, 15426共2008兲. 47S. G. Raju and S. Balasubramanian,J. Phys. Chem. B 113, 4799共2009兲. 48F. Aliotta, R.C. Ponterio, F. Saija, G. Salvato, and A. Triolo,J. Phys.
Chem. B 111, 10202共2007兲.
49T. Takamuku, Y. Honda, K. Fujii, and S. Kittaka,Anal. Sci. 24, 1285
共2008兲.
50S. Dixit, W. C. K. Poon, and J. Crain,J. Phys.: Condens. Matter12, L323 共2000兲.
51P. Nockemann, B. Thijs, S. Pittois, J. Thoen, C. Glorieux, K. Van Hecke, L. Van Meervelt, B. Kirchner, and K. Binnemans,J. Phys. Chem. B110,
20978共2006兲.
52M. J. Frisch, G. W. Trucks, H. B. Schlegel et al.,
GAUSSIAN 03, Revision A.7, Gaussian, Inc., Pittsburg, PA, 2003.