行政院國家科學委員會專題研究計畫 成果報告
中國大陸最近的股市改革開放措施對股票價格的影響
計畫類別: 個別型計畫 計畫編號: NSC93-2416-H-009-025- 執行期間: 93 年 08 月 01 日至 94 年 07 月 31 日 執行單位: 國立交通大學財務金融研究所 計畫主持人: 陳達新 報告類型: 精簡報告 處理方式: 本計畫可公開查詢中 華 民 國 94 年 10 月 25 日
Abstract
This paper empirically examines the effect of allowing local residents to invest in the Class B share markets in China in accordance with the Chinese government’s official announcement on February 19, 2001. The objectives of this new policy are to reduce the segmentation between the Class A and B markets, to lower the price variability, and to increase the liquidity in the Class B markets. The results of our event study indicate that the policy had a very positive price impact on the Class B share price at least within four trading days after the announcement was made. Furthermore, we found no evidence of information leakage prior to the announcement. Our GARCH-type statistical model also shows that these reforms did reduce the price volatility in the Class B markets at least to some extent.
Keywords: Ownership Restriction, Chinese Markets, Market Microstructure,
Abnormal Returns, and Market Segmentation.
THE EFFECTS OF OPEN MARKET REFORMS ON THE
BEHAVIOR OF CHINA’S STOCK PRICES
1. INTRODUCTION
After nearly four decades of abandonment, China’s efforts to reactivate its stock exchanges in the early 1990s have successfully attracted a great many international investors in pursuit of the benefits of international diversification. It is for this reason that equity markets in China have experienced tremendous development over the past decade.1 In 2001, China’s stock market was the second largest in Asia, next only to that of Japan, and the thirteenth largest in the world in terms of year-end market capitalization.2 Since their inception, China’s stock markets have been characterized by the two classes of shares traded on the same exchange, even though these classes of shares are entitled to the same voting rights and dividends. Class A shares are denominated in the local currency, i.e. renminbi, and can only be owned and traded by individuals and legal persons in the People of Republic China (PRC), which do not include those who are citizens of Hong Kong and Macau. Class B shares are denominated in Hong Kong and United States dollars and until recently could only be traded and owned by foreigners, including the residents of Hong Kong, Macau, and Taiwan.3
Foreign ownership restrictions have been a common feature of several emerging and developed markets such as those in Finland, Singapore, Switzerland, Malaysia, Philippines, and Thailand. However, despite there having been speculation that China’s stock markets have the potential to rank among the top four or five in the world in the coming decade (Ma and Folkerts-Landau (2001)), these markets have received relatively little attention until recently, and researchers have found several puzzling phenomena that are not only unique to China’s stock
1
The rebirth of the stock markets in China can be traced back to the economic reforms that were launched in 1978.
2
Sources: World Development Indicators 2001, World Bank.
3
Chinese companies have also issued Class H (for the Hong Kong Stock Exchange), Class S shares (for the Singapore Stock Exchange), and Class N shares (for the New York Stock Exchange) since 1993. They convey equal rights and obligations as Class A and Class B shares, but can only be traded on the foreign stock exchanges.
markets but have also not been found in stock markets elsewhere. The most notable puzzle is the Class B share discount relative to the Class A shares (see, for example, Bailey (1994), Ma (1996), Sun and Tong (2000), He, Bergstrom, and Tang (2001), and He, Wu, and Chen (2003)). In other stock markets with partial segmentation between domestic and foreign investors through dual classes of shares, the foreign class shares are generally sold at a premium, but in China the Class B shares are generally traded at a discount, sometimes by as much as 70% (see Chen and Su (1998)).4 Moreover, some studies also find that the returns and volatilities for these two classes of stocks are different. The Class B shares generally have larger volatilities and also higher returns relative to the Class A shares (see He, Wu, and Chen (2003)).5 Chui and Kwok (1998) observe that these restrictive regulations are stricter in China, and the large discrepancy between the Class A and –B share markets implies that China’s stock markets are completely segmented, even though many Chinese residents trade Class B shares by using foreigners’ accounts or else by opening Class B share accounts using foreigners’ passports. Bailey, Chung, and Kang (1999) even explicitly argue that China’s market is a strange case and also one of the most difficult markets to describe. These distinguishing features make it difficult to automatically extend research results from other countries to China.
In order to reflect the ongoing efforts of openness and globalization, on February 19, 2001, China’s government suddenly announced that local citizens would be allowed to buy Class B shares — stocks denominated in Hong Kong and United States dollars and previously reserved exclusively for foreign investors. As a result, the Class A and Class B markets are no longer completely segmented. This event might be by far the most important government policy that has profoundly changed the microstructure of China’s stock market since the first listing of Shanghai Vacuum Electronics Class B shares on February 21, 1992 on the Shanghai Stock
4
For example, Loderer and Jacobs (1995) find that Nestle’s foreign-held voting bearer stocks were selling for about twice the price of the domestically-held registered shares when, on November 17, 1988, Nestle’s board decided to allow foreign investors to hold registered shares.
5
Some studies find that Class A shares have higher volatilities than Class B shares based on the sample period of the mid-1990s. See Su and Fleisher (1999).
Exchange and the first listing of China Southern Glass Class B shares on February 28, 1992 on the Shenzhen Stock Exchange. This regulatory change may also be regarded as a liquidity and price enhancement event in relation to the Class B shares. It also paves the way for the possibility of a merger between the Class A and Class B stock markets that has long been desired.
However, given the substantial price discount and difference in volatility between the two classes of share, it is therefore of interest both to academics and practitioners to see whether the open market reforms have achieved their objectives in terms of reducing the variance and also increasing the correlation between the two previously segmented markets. With this in mind, this paper has two main objectives. The first is to examine the information value of the open market reforms announced on February 19, 2001 in relation to the stock returns of China’s Class B share markets. The second is to explore the possible changes in the volatility relationships between China’s Class A and B share markets both before and after February 19, 2001.
The remainder of the paper is organized as follows. Section 2 discusses the history of China’s stock market and the recent market reforms. Section 3 reviews the relevant literature in regard to China’s stock markets. Section 4 summarizes the data and the sources used to examine the effects of open market reforms on China’s two stock exchanges. Section 5 utilizes an event study methodology to investigate the direct information impacts of the open market event. Section 6 reports the empirical results of the time-series behavior as well as the econometric properties of the stock returns both before and after the open market reforms. Section 7 provides the conclusion.
2. CHINA’S STOCK MARKETS AND OPEN MARKET REFORMS
China is one example of a successful policy-guided economy. Its two stock exchanges, the Shanghai Stock Exchange (SHSE) and the Shenzhen Stock Exchange (SZSE), were
established in December 1990 and July 1991, respectively.6 Firms can only choose to be listed on either of the two exchanges and may issue two types of shares: domestic-only Class A shares and foreign-only Class B shares. Cross-listing between the two exchanges is completely forbidden. The original purpose of the segmentation was made very clear: “to attract foreign investment and hard currencies while maintaining domestic control of China’s companies and
also limiting the investment influence of foreign speculators” (see Huang and Liu, 1995).7 By
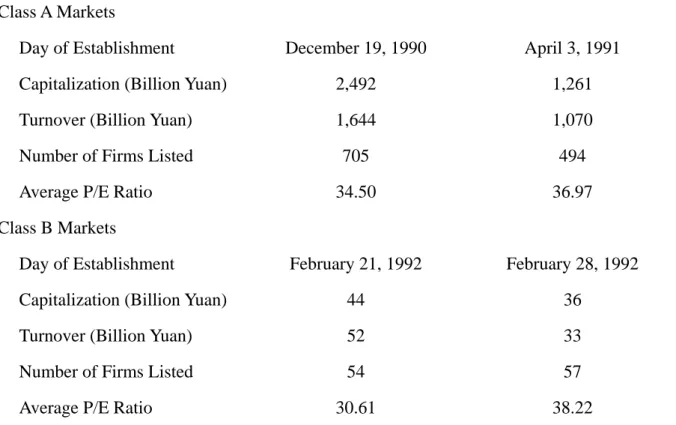
the end of December 2002, there were 715 firms listed on the SHSE with 741 Class A shares and 54 Class B shares, and 508 firms listed on the SZSE with 494 Class-A A shares and 57 Class B shares (see Table 1). The combined capitalization of the two markets reached US$500 billion, which accounted for about 50% of China’s GDP in 2002. The total number of investors in the two exchanges is now estimated to exceed 50 million people. Compared to the market capitalization and the number of listed companies in the Class A share markets, the Class B share markets are much smaller. Huang, Yang, and Hu (2000) even argue that Class B share markets have been losing their appeal to foreign investors.
Furthermore, after almost over 10 years of development since Class B shares were first traded, the importance of the Class B share markets has been superseded by the Class S, H, or N shares as more and more Chinese firms have successfully gone to the international equity markets for foreign capital. Moreover, establishing separate classes of shares for domestic Chinese residents and for foreigners creates several serious problems. Not only are the markets stagnant when contrasted with those for Class A shares, but the P/E ratios, turnover, and volatility of Class B shares are much lower than those for Class A shares, indicating that Class A have almost always been traded at a premium vis-à-vis Class B shares and are also more volatile. Apparently, although investors in these two classes of stocks share the same rights and cash flows and the shares should be equally priced by the market at least in theory, they attract distinct
6
So the Class A markets were established earlier than the Class B markets.
7
The issuance of Class B shares cannot exceed the upper limit set by the government, which is 25% of the total shares of a company.
investor bases, exhibit completely different trading behavior, and reflect different fundamental market forces. Chen, Lee, and Rui (2001) even claim that the prices of Class B shares deviate more in terms of market fundamentals than do those for Class A shares. Overall, the Class B share markets are much less liquid, have smaller trading volumes, and have large price discounts relative to the Class A share markets. In China, there used to be a so-called “Three Belows” to describe the Class B share markets: below face value, below net asset value, and below the offer price. The segmentation has also become increasingly inappropriate following China’s accession to the World Trade Organization in 2002.
The Class B share open market reforms, announced in the afternoon of February 19, 2001 and effective from February 28, 2001 (with the Class B share markets shut down between these two days), allowed domestic individual investors to buy Class B shares with foreign currency accounts opened prior to the announcement day.8 However, before June 1, 2001, in order to buy Class B shares, local investors could only use foreign currency that had already been deposited in a bank account before February 19, 2001. After June 1, 2001, local investors were then permitted to trade in Class B shares with foreign currency transferred from foreign banks.9 As a result, the Class A and B share markets were no longer completely separate and on February 28, 2001 when trading resumed the SHSE Class B index surged 9.7 % and the SZSE Class B index surged 12.4%.
However, a certain degree of segmentation still exists today and it is not possible for investors to take advantage of arbitrage opportunities. This is because China’s local currency, the renminbi, is still not freely convertible, Chinese investors cannot purchase foreign currency in order to trade Class B shares, and short selling is not allowed in either the Class A or B share markets. Mei, Scheinkman, and Xiong (2003) therefore argue that the relaxation of restrictions on purchases of Class B shares by domestic investors cannot completely eliminate the Class A
8
The domestic institutional investors were still barred from trading Class B shares at that time.
9
For a more detailed description of the Class B open market reforms, please refer to Ahlgren, Sjoo, and Zhang (2003).
share premia owing to the limited access to the necessary foreign currency.
To further open up its equity markets to international investors, China also introduced the Qualified Foreign Institutional Investor (QFII) system in November 2002. Effective from December 1, 2002, the program allows approved foreign institutional investors to access China’s domestic capital markets including China’s Class A share markets. The QFII program, which is largely modeled on Taiwan’s system, is a transitional mode in the opening-up of the stock market before the renminbi becomes freely convertible in China. There is no doubt that more effort will be made to integrate the two classes of share markets in the near future.
3. LITERATURE REVIEW
In this section we review previous studies on the sources behind the different trading patterns and the correlation structure between China’s Class A and B share markets. The microstructure structure theory developed by Kyle (1985) and Easley, Kiefer, O’Hara, and Paperman (1996) suggests that volatility may be explained by different degrees of information asymmetry as well as risk tolerance. Chui and Kwok (1998) argue that foreign investors may receive news about China faster than domestic Chinese investors due to the information barriers that exist within China. Rational Class A share investors should base their trading decisions on the previous price movements of Class A shares. As a result, the returns on Class B shares lead the returns on Class A shares. On the other hand, Chakravarty, Sarkar, and Wu (1998), following Grossman and Stiglitz (1980), develop a theoretical model to show that the degree of asymmetric information results in Class B shares being discounted in China’s segmented markets. Because foreign investors have less of an information advantage over Chinese firms, relative to local investors, due to language barriers, different accounting standards, and a lack of reliable information sources, Class B shares may be traded at a discount and Class A share returns are more likely to lead Class B share returns.
However, this information asymmetry hypothesis is not supported by Chen, Lee, and Rui (2001), whose results imply that there is no casual relationship between Class A share returns (volatilities) and Class B share returns (volatilities) during 1992-1997. In addition, they propose that, if the difference in information between domestic and foreign markets could be narrowed, declining Class B share discounts and a more integrated returns (volatilities) relationship between the two classes of stock would be observed. Therefore, open market reforms such as allowing local Chinese to buy Class B shares or establishing a QFII scheme to allow foreign institutional investors to buy Class A shares should be able to increase information transmission and further integrate the two markets. These reforms should also increase the firm’s investor base, resulting in a lower expected return and a higher market value of the firm’s shares as proposed by Merton (1987). Kwan and Reyes (1997) also provide similar evidence showing that market liberalization has reduced the volatility of stock returns in the Taiwan stock market.
The differential risk hypothesis provides another explanation for the Class B share price discount. According to this hypothesis, the highly speculative behavior of local Chinese investors results in those investing in Class A shares having a lower degree of risk aversion and may push up Class A share prices. It also leads to the prediction of a positive relationship between the amount of the discount and the risk level, but Chen, Lee, and Rui (2001), using the variance of returns as a proxy for the risk level, do not support the differential risk hypothesis. By contrast, Su (1999) finds that market risk when measured using the market beta is related to the variability and returns of the Class A and B share markets. After the betas are controlled, nonmarket risk variables, such as idiosyncratic variances and firm size, have no effect on stock prices.
The volatility disparity may also be explained by the different market-making costs for each market as found by He, Wu, and Chen (2003). They argue that the severe information asymmetry problem in the Class B share markets may result in a higher participation rate on the part of informed traders in the markets, which might in turn lead to higher trading costs. Thus,
the higher volatility in the Class B share market can be attributed to the higher market-making costs faced by Class B share traders and dealers. Amihud and Mendelson (1986) propose that relatively illiquid stocks have a higher expected return and are priced lower to compensate investors for increased trading costs. In China, the Class A share markets have been continuously and consistently more active and liquid than the Class B share markets. As Chen, Lee, and Rui (2001) point out, “Class B investors drive the price of Class B shares lower to compensate for the trading costs in illiquid thinly-traded Class B share markets.” The
illiquidity also causes the inventory-carrying costs to be higher in the Class B share markets, which in turn results in a higher trading cost and increased volatility. Based on a similar argument, Tauchen and Pitts (1983) show that an increase in the number of traders tends to mitigate stock market volatility.
4. DATA SOURCES AND INITIAL ANALYSIS
The data used in this study are the time series of daily closing prices and indices on the Shanghai Stock Exchange and the Shenzhen Stock Exchange obtained from the database of the Taiwan Economic Journal, which is a local data vendor. In the first part of our empirical test, the event study employs 46 and 47 stock returns traded in the SHSE and SZSE Class B markets, respectively, from 60 trading days before to 20 trading days after February 28, 2001 (the first trading day), in order to investigate the information and valuation impacts of the new regulation on the Class B stock markets.
The second part of the test examines the possible change in the volatility relationship, which might be influenced by the open market reforms. The data series begins on January 1, 1996 and ends on November 30, 2002. The whole data set is then divided into two unequal sub-periods to represent the periods before and after the market reforms took place. Data from January 1, 1996 to February 19, 2001 represents the former, while the latter is represented by the
data from February 28, 2001 to November 30, 2002. This paper mainly focuses on the effect on the stock prices of opening the market for Class B shares to local Chinese residents and the possible impact of a subsequent open market reform, i.e. the QFII scheme that became effective on December 1, 2002. Therefore, the prices for both exchanges after this day are not included in
the sample. Moreover, the daily stock returns, Ri,t, for stock exchange i are measured by the
log difference between the closing price indexes:
Ri,t =ln(Pi,t)−ln(Pi,t−1) (1)
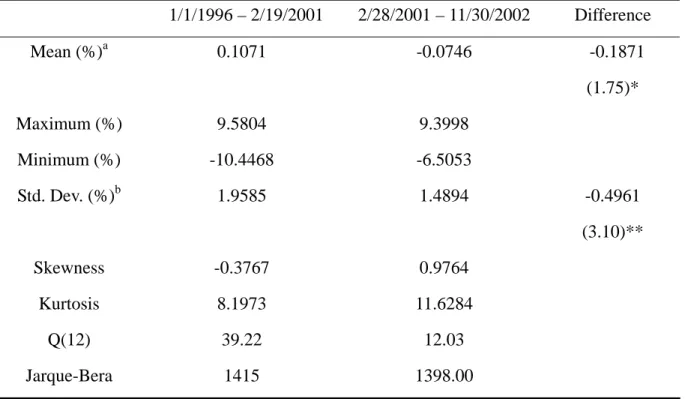
The descriptive statistics of the Class A and B share returns within the two exchanges are presented through Panel A to Panel D in Table 2. The table lists the mean, maximum, minimum, standard deviation, skewness, kurtosis, the Ljung-Box statistic for testing the hypothesis that all autocorrelations up to lag 12 are jointly equal to zero, and the Ljung-Bera normality test. As discussed in Song, Liu, and Romilly (1998) and Lee, Chen, and Rui (2001), the distribution of Chinese stock returns exhibits the following characteristics: leptokurtosis, skewness, and volatility clustering.10 Our statistical results in Table 2 report similar properties. The Ljung-Bera statistics along with skewness and kurtosis clearly show that the null hypothesis of a normal distribution is soundly rejected for all four data series. Moreover, although during the period from 2/28/2001 to 11/30/2002 the Ljung-Box Q(12) statistics decrease, during the period from 1/1/1996 to 2/19/2001 they are all greater than 21.02 (the 5% critical value for a χ2 distribution with 12 degrees of freedom), indicating that daily stock returns in the overall Chinese stock markets are autocorrelated and not independently distributed. These results also provide evidence of conditional heteroskedasticity in the daily returns and thus justify the use of a GARCH framework that we will employ later in modeling the volatility of the Chinese stock markets.
The SHSE and SZSE Class A share returns have lower standard deviations than the SHSE
10
In fact, these features, which are contradictory to a Gaussian distribution, are generally found in stock returns in many other stock markets around the world.
and SZSE Class B share returns. Furthermore, the fourth column of Table 2 compares the differences in the mean returns and standard deviations between the two periods. The difference tests reveal that the open market reforms seem to exert a greater impact on the returns and standard deviations in the case of the Class A share markets than in the case of the Class B share markets. Figure 1 also graphs the daily stock indices for SHSE and SZHE, respectively, from January 1, 1996 through November 30, 2002. Consistent with our conjecture, the figure shows that both markets exhibited sharp price rises during the first half of 2001. Further analysis will be performed in the sections that follow.
5. EVENT STUDY ON THE FINANCIAL IMPACT OF OPEN MARKET REFORMS
The event-study methodology is utilized to analyze the effects of open market reforms on stock prices, in line with Mikkelson and Partch (1986, 1988). The use of an event study to examine the reaction in terms of price to an event such as a regulatory change, as Lamdin (2001), among others, argues, is quite a standard tool in economics and finance.11 So if there is buying pressure due to the opening of the Class B markets to domestic investors and no information leakage, we believe that the stock price would immediately increase along the lines of the theoretical model developed by Merton (1987), who proposes that, all things being equal, an increase in the size of a company’s investor base will reduce investors’ expected returns and therefore raise the market price of the firm’s stocks. As Fama (1970) suggests that in an efficient market a security’s price should fully and instantly reflect all available information at any given time, then a change in government policy should only be impounded by the market in a timely manner.
To conduct an event study, the event day, estimation window, event window, and estimation model must each be decided. We measure the market’s reaction to the government’s
11
Campbell, Lo, and MacKinlay (1997) and Binder (1998) have done excellent surveys on the event study methodology.
announcement on February 19, 2001 by calculating the abnormal returns of 93 Chinese Class B shares, 47 traded on the SHSE and 46 on the SZHE, respectively, around the 41-day event window (t=-20, t=+20). To be specific, the abnormal return (AR) during the event window for stock i on day t is defined as:
) ( i i mt it
it R R
AR = − α +β (2) where R is the return on stock i on day t, and it R is the return on the SHSE and SZSE mt
composite stock market index on day t .12 The coefficients for αi and βi are estimated
based on the market model of a 120-day estimation window by regressing R for the period it from 140 trading days before, i.e. t=-140, the event day to 21 trading days before, i.e. t=-21, the event day on R . However, since the news was publicly released after trading hours on mt February 19, 2001, the event day, t =0, is defined as February 28, 2001, which was the first trading day after the markets were suspended following the government’s announcement. We also calculate the cumulative abnormal return (CAR) for each individual firm i, for the period from 20 trading days prior to the event day to 20 days after. That is, we analyze the windows extending approximately one month in either direction. The cross-sectional average abnormal returns (AARs) and the cross-sectional cumulative average abnormal returns (CAARs) are then estimated to determine their statistical significance.
The results for the event study are reported in Table 3. We do not observe any significant market response before the event day either on the SHSE or the SZSE. To conserve space, Table 3 only contains the daily cross-sectional average abnormal returns for t=-10,…, +10. For the pre-event-day period, none of the t-statistics are statistically significant and it does not appear that any information regarding the policy change was leaked out to the market before the announcement was officially made. Although it had long been expected that the Chinese
12
The SHSE composite index is a weighted index of the share prices of all listed companies (Class A shares and Class B shares) on the Shanghai Stock Exchange. The Class B share prices are converted using the RMB/US exchange rate. The index’s base value is 100 points in December 1990. The SZSE composite index has a similar structure but its base day is in April 1991. The Class B share prices are converted using the RMB/HK exchange rate.
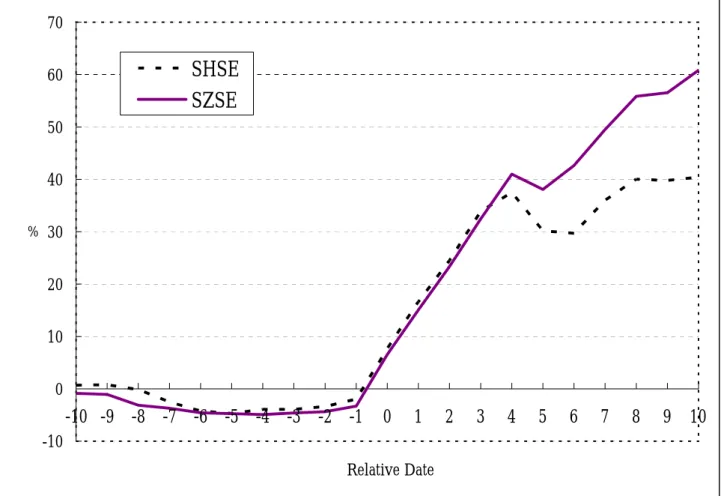
government would take some regulatory action to amend the Class B markets, the open market reform announcement did come as a surprise to the stock market and thus we find no evidence of information leakage. In Figure 2, we present a graphic plot of the cross-sectional cumulative average abnormal returns (CAARs) around the event day t =0 on both the SHSE and the SZSE. From day -10 to day -1, the CAARs appear to be quite small and even exhibit a downward trend.
However, the patterns change and the prices rise dramatically on and after t=0 as investors anticipate that there will an increased demand for the Class B shares in the immediate future. Table 3 reveals that the significantly positive AARs have continued to rise for almost four trading days (t=0, t=+3) on the SHSE and for five trading days (t=0, t=+4) on the SZSE. There is evidence of slight subsequent price reversals on t=5 in both markets as argued by Jegadeesh and Titman (1993) who find that stock prices usually experience short-term reversal, but only on the SHSE is the AAR negatively significant. Moreover, significant abnormal returns reappear on t=7 in the case of the SHSE and on t=7 and t=8 in the case of the SZSE. In general, the event
study results apparently show that, first, the markets have not anticipated the information contained in the government’s open market announcement; and, second, the event contains information of very positive value to the Class B stock markets.
6. THE IMPACT OF MARKET REFORMS ON RETURN VOLATILITY
In this section, the univariate AR(p)-GARCH(r, s)-mean (M) model developed by Engle, Lilien, and Robins (1987) is used to examine the empirical question of how these open market reforms have affected China’s stock market volatility. The autoregressive conditional heteroskedasticity (ARCH) model was first introduced by Engle (1982) and later generalized by Bollerslev (1986) as GARCH (generalized ARCH). The GARCH-type statistical models are the most powerful technique for studying stock dynamics that incorporate systematic changes of return volatility. The AR(p)-GARCH(r, s)-M specification employed is this study is expressed
below: t i t i i p t i p i t i i i t i R R h R, =φ,0 +φ,1 ,−1 +...+φ, ,− +δ , +ε , (3) t i r t i r i t i i s t i s i t i i i t i h h d D h, =α,0 +α,1ε2,−1+...+α,ε2,− +β,1 ,−1+...+β, ,− + (4)
where Ri,t is an index of daily stock returns in logarithms as defined by Equation (1),
t i t i t i h v, 5 . 0 , , =
ε and vi,t ~ N(0,1), and i = Class B share returns on the SHSE and SZSE,
respectively. The conditional variance, h , is composed of the lagged squared errors t 2
s t− ε in
the return process and the lagged conditional variance, ht−r. The open market reform dummy variable D equals 1 after February 28, 2001, the first trading day after the announcement, and 0 t
otherwise.
In the mean return equation, i.e. Equation (3), coefficient φp measures the p-th order
autocorrelation and the coefficient δ represents the effect of the conditional variance on the mean return. In the conditional variance equation, i.e. Equation (4), the αs and β r coefficients capture the impact of the lagged squared errors and the effect of the lagged conditional variance on the current period conditional variance, respectively. Most important of all, if the coefficient of the dummy variable is statistically significant, then the market liberalization has had an effect on Chinese stock market volatility.
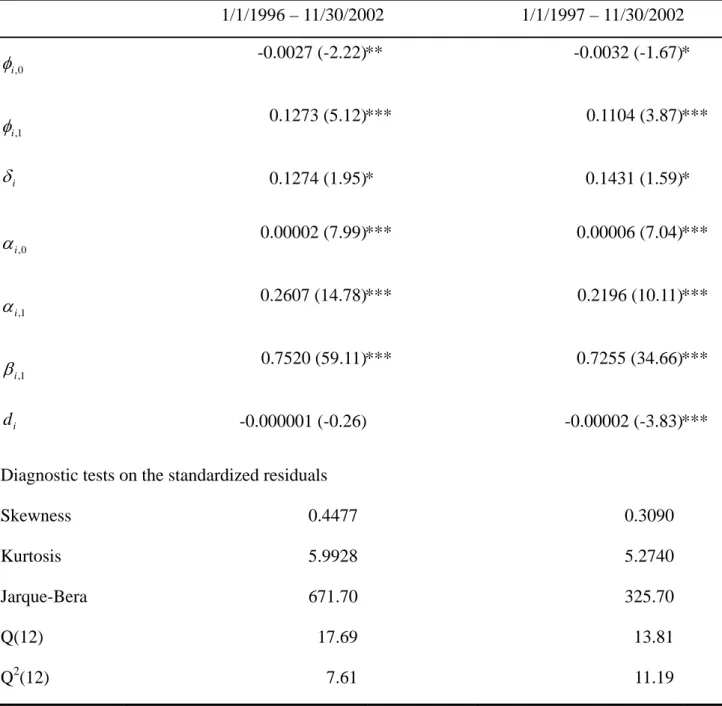
In determining the optimal length of the AR(p)-GARCH(r, s)-M process, we employ the numerical technique whereby the logarithm of the likelihood function is maximized. Our results show that AR(1)-GARCH(1, 1)-M is the parsimonious representation of the Chinese stock markets in terms of maximum likelihood and the Schwarz criterion. The second columns of Panels A and B in Table 4 report our results. During the period 1/1/1996 – 11/30/2002, all the parameters except the dummy variable in the mean and variance models are statistically significant for either exchange. The significant δi justifies the use of the GARCH-M model
and implies that the conditional variance affects the return series and a higher return is accompanied by higher conditional volatility. This evidence is consistent with a positive risk premium in relation to the stock index, i.e. higher risks are accompanied by higher returns. The
significant coefficients αi,1 and βi,1 also suggest that the conditional variance for the current period is influenced by the lagged squared errors and the lagged conditional variance. The table
also shows that the response function of volatility to shock decays slowly. The sum of αi,1 and
1 , i
β is very close to unity on both the SHSE or SZSE, suggesting a persistent volatility shock and
that current information is also relevant in predicting future volatility over a longer time span. The evidence conforms to that found by Song, Liu, and Romilly (1998) who argue that “the hypothesis of persistent mean reversion in the conditional variance may not be confidently
assumed in the Chinese markets.” Serial correlation tests based on the Ljung-Box Q(12)
statistics for standardized residuals and squared standardized residuals are not significant at the 5% level. The diagnostic tests show that the AR(1)-GARCH(1, 1)-M specification used in this study has captured most of the linear autocorrelation in the mean and variance and therefore it fits the return series well. The null hypothesis of normally-distributed standardized residuals is rejected by the Bera-Jarque normality test which justifies the use of the Bollerslev-Wooldridge robust t-statistic in explaining the empirical results.
Most interesting for our purposes is that the estimated coefficients of the liberalization dummy variables are negative on either exchange, but are not statistically significant as we expected. This finding seems to indicate that the market liberalization has no impact on the return distributions in China. To check the robustness of this finding, we select a shorter sample period by using the period 1/1/1997 – 11/30/2002 instead of 1/1/1996 – 11/30/2002 and the results are contained in the third column of Table 4. We find that the estimated coefficients of the dummy variables are now negatively significant and the other results are similar to those where a longer period is used. Though the effects of the reforms on volatility seem to be
sensitive to the comparison time period chosen, we argue that the open market reforms have still successfully reduced the volatility pattern of stock prices in China.
7. SUMMARY AND CONCLUSIONS
Over the past few years, China’s economy has experienced rapid growth and a great deal of wealth has been accumulated. Much of this increased wealth has been channeled into the stock market as the Chinese economy has grown, resulting in a huge increase in trading volume and value and making China’s stock market, in terms of trading volume and value, the largest among the emerging capital markets. However, China’s stock market has undergone major structural changes in recent years. This paper empirically examines the effect of allowing local residents to invest in the Class B share markets in China, and considers how China’s stock market has been impacted by the drastic open market reforms that were officially announced by the Chinese government on February 19, 2001. The objectives of this new policy were to reduce the segmentation between the Class A and B markets, to lower the price variability, and to increase the liquidity in the Class B markets.
By applying an event study methodology, we found that the event had a significant effect on the Class B share market both on the Shanghai Stock Exchange and the Shenzhen Stock Exchange. Over a period of at least four days since the event day, which was defined as the first trading day after the announcement, i.e. February 28, 2001, the stock price was seen to react positively to the information and the abnormal returns were statistically significant. We also observed a subsequent price reversal effect but only on the Shanghai Stock Exchange was the abnormal return negatively significant. Another interesting finding was that we found no evidence of information leakage before February 19, 2001, implying that the event took the market by surprise.
The second part of our empirical test was to investigate whether this open market reform had any effect on the microstructure of China’s stock markets. By utilizing a univariate
AR(p)-GARCH(r, s)-mean (M) model, our results indicated that the open market reform had some effect on the dynamics of China’s Class B markets. We basically support the view that the conditional variance affects the return series and that higher returns are accompanied by higher conditional volatility in China’s Class B markets. We also found evidence to show that the reforms reduced the price volatility but the results were perhaps not statistically significant, although they were still negative when different comparison periods were used.
REFERENCES
Ahlgren, Niklas, Boo Sjoo, and Jianhua Zhang, 2003, Panel cointegration of Chinese A and B shares, Swedish School of Economics and Business Administration working paper No. 500. Amihud, Yakov and Haim Mendelson, 1986, Asset pricing and the bid-ask spread, Journal of
Financial Economics 17, 223-249.
Binder, John J., 1998, The event study methodology since 1969, Review of Quantitative Finance and Accounting 11, 111-137.
Bailey, Warren, 1994, Risk and return on China’s new stock markets: Some preliminary evidence, Pacific-Basin Finance Journal 2, 243-260.
Bailey, Warren, Y. Peter Chung and Jun-Koo Kang, 1999, Foreign ownership restrictions and equity price premiums: What drives the demand for cross-border investments? Journal of Financial and Quantitative Analysis 34, 489-511.
Bollerslev, T. and J. Wooldridge, 1992, Quasi maximum likelihood estimation and inference in dynamic models with time varying covariances, Econometric Reviews 11, 143-172. Campbell, John, Andrew Lo and Craig MacKinlay, 1997, The econometrics of financial
markets, Princeton University Press.
Chakravarty, S., A. Sarkar, and L. Wu, 1998, Information asymmetry and the pricing of cross-listed stocks: Evidence from Chinese A- and B-Shares, Journal of International Financial Markets, Institutions and Money, 8, 325-355.
Chen, G. M., Bong-Soo Lee, and Oliver Rui, 2001, Foreign ownership restrictions and market segmentation in China’s stock markets, Journal of Financial Research 24, 133-155.
Chen, Yea-Mow and Yuli Su, 1998, An examination into Chinese stock market segmentation, in Advances in Pacific-basin financial markets edited by Theodore Bos and Thomas A. Fetherston, JAI Press Inc.
Chui, Andy C. and Chuck C.Y. Kwok, 1998, Cross-autocorrelation between A shares and B shares in the Chinese stock market, Journal of Financial Research 21, 333-353.
Dickey, D. A. and W. A. Fuller, 1979, Distribution of the estimators for autoregressive time series with a unit root, Journal of the American Statistical Association 74, 427-431.
Easley, D., N. Kiefer, M. O’Hara and J. Paperman, 1996, Liquidity, information, and infrequently traded stocks, Journal of Finance 51, 1405-1436.
Engle, R. F., 1982, Autoregressive conditional heteroscedasticity with estimates of variance of United Kingdom inflation, Econometrica 50, 597-622.
Engle, R. F., David M. Lilien, and Russell P. Robins, 1987, Estimating time-varying risk premia in the term structure: The GARCH-M model, Econometrica 55, 391-407.
Engle, R. F. and C. W. J. Granger, 1987, Cointegration and error correction: Representation, estimation, and testing, Econometrica 55, 251-276.
Fama, E. F., 1970, Efficient capital markets: A review of theory and empirical work, Journal of Finance 25, 383-417.
Grossman, S. J. and Stiglitz, J. E., 1980, On the impossibility of informationally efficient markets, American Economic Review 70, 393-408.
He, Yan, Chunchi Wu, and Yea-Mow Chen, 2003, An explanation of the volatility disparity between the domestic and foreign shares in the Chinese stock markets, International Review of Economics and Finance 12, 171-186.
Huang, Bwo-Nung, Chin-Wei Yang, and John Wei-Shan Hu, 2000, Causality and cointegration of stock markets among the United States, Japan, and the South China growth triangle, International Review of Financial Analysis 9, 281-297.
Jegadeesh, N. and S. Titman, 1993, Returns to buying winners and selling losers: Implications for stock market efficiency, Journal of Finance 48, 65-91.
Johansen, S., 1988, Statistical analysis of cointegration vectors, Journal of Economic Dynamics and Control 12, 231-254.
Johansen, S. and K. Juselius, 1990, Maximum likelihood estimation and inference on cointegration with application to the demand for money, Oxford Bulletin of Economics and Statistics 52, 169-210.
Kyle, A., 1985, Continuous auction and insider trading, Econometrica 53, 1315-1335.
Lamdin, Douglas, 2001, Implementing and interpreting event studies of regulatory changes, Journal of Economics and Finance 53, 171-183.
Loderer, Claudio and Andreas Jacobs, 1995, The Nestle crash, Journal of Banking and Finance 37, 315-339.
Ma, Xianghai, 1996, Capital controls, market segmentation and stock prices: Evidence from the Chinese stock market, Pacific-Basin Finance Journal 4, 219-239.
Ma, Jun and David Folkerts-Landau, 2001, China’s financial liberalization agenda, Research Report, May 2001, Global Markets Research, Deutsche Bank, Hong Kong.
Mei, Jianping, José A. Scheinkman and Wei Xiong, Speculative trading and stock prices: An analysis of Chinese A-B share premia, New York University working paper.
Merton, Robert C., 1987, Presidential address: A simple model of capital market equilibrium with incomplete information, Journal of Finance 42, 483-510.
Mikkelson, Wayne H. and M. Megan Partch, 1986, Valuation effects of security offerings and the issuance process, Journal of Financial Economics 15, 31-60.
Mikkelson, Wayne H. and M. Megan Partch, 1988, Withdrawing security offerings, Journal of Financial and Quantitative Analysis 23, 119-134.
Song, Haiyan, Xiaming Liu and Peter Romilly, 1998, Stock returns and volatility: An empirical study of Chinese stock markets, International Review of Applied Economics 12, 12-139.
Su, Dongwei, 1999, Ownership restrictions and stock prices: Evidence from Chinese markets, Financial Review 34, 37-56.
Su, Dongwei and Belton M. Fleisher, 1999, Why does return volatility differ in Chinese stock markets? Pacific-Basin Finance Journal 7, 557-586.
Sun, Qian and Wilson H. S. Tong, 2000, The effect of market segmentation on stock prices: The China syndrome, Journal of Banking and Finance 2000, 1875-1902.
Tauchen, G. and Pitts, M., 1983, The price-variability-volume relationship on speculative markets, Econometrica, 51, 485-505.
Figure 1. The Class B Stock Indices for the Shanghai Stock Exchange and Shenzhen Stock Exchange from January 1, 1996 to November 30, 2002
Panel A: Shanghai Stock Exchange
0 50 100 150 200 250 300 1996 /1 1996 /7 1997 /1 1997 /7 1998 /1 1998 /7 1999 /1 1999 /7 2000 /1 2000 /7 2001 /1 2001 /7 2002 /1 2002 /7
Panel B: Shenzhen Stock Exchange 0 50 100 150 200 250 300 350 400 450 500 1996/1 1996/7 1997/1 1997/7 1998/1 1998/7 1999/1 1999/7 2000/1 2000/7 2001/1 2001/7 2002/1 2002/7
Figure 2. Class B Share Cumulative Average Abnormal Returns Surrounding February 28, 2001 -10 0 10 20 30 40 50 60 70 -10 -9 -8 -7 -6 -5 -4 -3 -2 -1 0 1 2 3 4 5 6 7 8 9 10 Relative Date %
SHSE
SZSE
Table 1. Profile of China’s Stock Markets (as of December 2002)
Shanghai Stock Exchange Shenzhen Stock Exchange Class A Markets
Day of Establishment December 19, 1990 April 3, 1991
Capitalization (Billion Yuan) 2,492 1,261
Turnover (Billion Yuan) 1,644 1,070
Number of Firms Listed 705 494
Average P/E Ratio 34.50 36.97
Class B Markets
Day of Establishment February 21, 1992 February 28, 1992
Capitalization (Billion Yuan) 44 36
Turnover (Billion Yuan) 52 33
Number of Firms Listed 54 57
Average P/E Ratio 30.61 38.22
Sources: “2002 Fact Book” published by the Shanghai Stock Exchange and the Shenzhen Stock Exchange,
respectively.
Table 2. Descriptive Statistics for the Stock Returns Panel A. Shanghai Stock Exchange Class A Shares
1/1/1996 – 2/19/2001 2/28/2001 – 11/30/2002 Difference Mean (%)a 0.1071 -0.0746 -0.1871 (1.75)* Maximum (%) 9.5804 9.3998 Minimum (%) -10.4468 -6.5053 Std. Dev. (%)b 1.9585 1.4894 -0.4961 (3.10)** Skewness -0.3767 0.9764 Kurtosis 8.1973 11.6284 Q(12) 39.22 12.03 Jarque-Bera 1415 1398.00
Panel B. Shanghai Stock Exchange Class B Shares
1/1/1996 – 2/19/2001 2/28/2001 – 11/30/2002 Difference Mean (%)a 0.0436 0.0839 0.0403 (0.27) Maximum (%) 12.1836 9.4531 Minimum (%) -13.0846 -10.2917 Std. Dev. (%)b 2.5956 2.6357 0.0401 (1.03) Skewness 0.3143 0.3756 Kurtosis 6.5419 6.4229 Q(12) 41.31 16.50 Jarque-Bera 662.64 216.96
Panel C. Shenzhen Stock Exchange Class A Shares 1/1/1996 – 2/19/2001 2/28/2001 – 11/30/2002 Difference Mean (%)a 0.1415 -0.0885 0.23 (1.98)** Maximum (%) 13.1993 9.2403 Minimum (%) -10.5909 -6.7459 Std. Dev. (%)b 2.2121 1.5924 -0.6197 (1.93)** Skewness -0.3888 0.7220 Kurtosis 9.9746 9.9339 Q(12) 34.76 12.63 Jarque-Bera 1291.73 896.71
Panel D. Shenzhen Stock Exchange Class B Shares
1/1/1996 – 2/19/2001 2/28/2001 – 11/30/2002 Difference Mean (%)a 0.0718 0.0780 0.0062 (0.04) Maximum (%) 18.1896 9.4716 Minimum (%) -16.7045 -9.5888 Std. Dev. (%)b 2.8039 2.8622 0.0583 (1.04) Skewness 0.2864 0.2970 Kurtosis 9.1062 5.3699 Q(12) 33.68 48.78 Jarque-Bera 1886.99 105.21
Note: The Difference column represents the difference in terms of the mean return between the pre- and
the post-event periods. The t ratios for testing the hypothesis that the mean returns are the same are reported in parentheses.
*** Statistically significant at the 1% level. ** Statistically significant at the 5% level. * Statistically significant at the 10% level.
Table 3. Class B Stock Average Abnormal Returns Surrounding February 28, 2001
Panel A: Shanghai Stock Exchange Panel B: Shenzhen Stock Exchange
Day AAR(%) t(AAR) AAR(%) t(AAR
) -10 0.667 0.22 -0.873 -0.27 -9 0.112 0.04 -0.216 -0.07 -8 -0.916 -0.31 -2.034 -0.64 -7 -2.411 -0.82 -0.587 -0.19 -6 -1.679 -0.57 -0.862 -0.27 -5 -0.473 -0.16 -0.175 0.05 -4 0.781 0.27 -0.176 -0.06 -3 -0.018 -0.01 0.301 0.09 -2 0.549 0.18 0.247 0.07 -1 1.406 0.48 1.061 0.33 0 9.642 3.30 *** 9.855 3.11 *** 1 8.937 3.06 *** 8.539 2.70 *** 2 7.866 2.69 *** 8.274 2.62 *** 3 9.426 3.22 *** 9.090 2.87 *** 4 3.616 1.23 8.551 2.71 *** 5 -7.336 -2.51 ** -2.928 -0.93 6 -0.483 -0.17 4.575 1.45 7 6.274 2.15 ** 6.860 2.17 ** 8 4.066 1.39 6.363 2.01 ** 9 -0.238 -0.08 0.668 0.21 10 0.609 0.21 4.283 1.35
Note: This table presents the abnormal returns surrounding the event day, i.e. February 28, 2001. The abnormal return is computed as the difference between the observed and expected returns. The expected return is generated from the standard market model regression. The t-statistics test the null hypothesis that the average abnormal returns are equal to zero.
*** Statistically significant at the 1% level. ** Statistically significant at the 5% level. * Statistically significant at the 10% level.
Table 4. Maximum Likelihood Estimates of the AR(1)-GARCH(1, 1)-M Model: Daily Class B Stock Returns on the SHSE and SZSEa
t i t i i t i i i t i R h R, =φ,0 +φ,1 ,−1+δ , +ε , t i t i i t i i i t i h d D h = + − + ,1 ,−1+ 2 1 , 1 , 0 , , α α ε β
Panel A. Shanghai Stock Exchange Class B Shares
1/1/1996 – 11/30/2002 1/1/1997 – 11/30/2002 0 , i φ -0.0027 (-2.22)** -0.0032 (-1.67)* 1 , i φ 0.1273 (5.12)*** 0.1104 (3.87)*** i δ 0.1274 (1.95)* 0.1431 (1.59)* 0 , i α 0.00002 (7.99)*** 0.00006 (7.04)*** 1 , i α 0.2607 (14.78)*** 0.2196 (10.11)*** 1 , i β 0.7520 (59.11)*** 0.7255 (34.66)*** i d -0.000001 (-0.26) -0.00002 (-3.83)***
Diagnostic tests on the standardized residuals
Skewness 0.4477 0.3090
Kurtosis 5.9928 5.2740
Jarque-Bera 671.70 325.70
Q(12) 17.69 13.81
Panel B. Shenzhen Stock Exchange Class B Shares 1/1/1996 – 11/30/2002 1/1/1997 – 11/30/2002 0 , i φ -0.0042 (-2.62)** -0.0066 (-2.85)*** 1 , i φ 0.1487 (5.12)** 0.1312 (4.27)*** i δ 0.1798 (2.42)* 0.2599 (2.52)** 0 , i α 0.00007 (11.35)** 0.00009 (8.27)*** 1 , i α 0.3135 (11.70)** 0.2204 (8.27)*** 1 , i β 0.6255 (27.31)** 0.6737 (21.68)*** i d -0.00001 (-0.66) -0.00002 (-2.20)** Diagnostic tests on the standardized residuals
Skewness 0.2907 0.2653 Kurtosis 7.5242 6.6476 Jarque-Bera 1409.64 786.34 Q(12) 21.09 16.27 Q2(12) 7.57 8.88 a
Figures inside the parentheses are values for the Bollerslev and Wooldridge (1992) robust t-statistics.
Q(12) and Q2(12) denote the Ljung-Box Q statistic for serial correlation tests with 12 lags on the standardized
residuals and squared standardized residuals, respectively. *** Statistically significant at the 1% level.
** Statistically significant at the 5% level. * Statistically significant at the 10% level.