All rights reserved DOI: 10.1093/aje/kwh055
Self-rated Health among Young People with Type 1 Diabetes in Relation to Risk
Factors in a Longitudinal Study
Guan-Hua Huang1,2, Mari Palta1,2, Catherine Allen1, Tamara LeCaire1, and Donn D’Alessio1 for the Wisconsin Diabetes Registry
1 Department of Population Health Sciences, University of Wisconsin Medical School, Madison, WI. 2 Department of Biostatistics and Medical Informatics, University of Wisconsin Medical School, Madison, WI.
Received for publication November 5, 2002; accepted for publication August 28, 2003.
Care for type 1 diabetes mellitus should both alleviate the physical complications of the disease and improve overall quality of life. The Wisconsin Diabetes Registry, comprising a population-based cohort that is followed longitudinally from diagnosis of type 1 diabetes, provided the authors with a unique opportunity to examine quality of life in children, adolescents, and young adults with type 1 diabetes and its relation to both sociodemographic and clinical risk factors. The authors analyzed data from 1987–2002 with a mean of 10.2 years’ duration of diabetes (n = 569). They used ordinal-scaled self-rated global health as a measure of quality of life. In this paper, they propose a random-effects model for drawing inferences on individuals regarding the relation of longitudinally measured quality of life to multiple risk factors. Results showed that male gender, higher parental socioeconomic level, younger age at diabetes diagnosis, shorter diabetes duration, no hospitalization in the preceding 6 months, lower glycosylated hemoglobin level, and questionnaire responses by a person other than the subject were independently associated with better reported health. The authors found that individuals varied in their reported health even after adjustment for all identified risk factors. This could imply either that there is variability in perception even with the same health status or that there are independent unmeasured risk factors for poor health in persons with type 1 diabetes.
adolescent; child; diabetes mellitus, type I; health; longitudinal studies; quality of life; risk factors
Type 1 (insulin-dependent) diabetes mellitus is usually first diagnosed in children or young adults. Approximately one in every 400–500 US children and adolescents has type 1 diabetes (1). People with type 1 diabetes often feel chal-lenged by the demands of day-to-day management of the disease and the fear of developing serious complications; therefore, their quality of life, which includes a person’s perception of health and satisfaction with life, is substan-tially affected. It has become accepted that the goal of medical care should be not only to alleviate the physical complications of a disease but also to improve the patient’s overall quality of life (2). Studying quality of life among persons with type 1 diabetes and its relation to risk factors can help us understand and identify the best treatment regimen and target persons with a low quality of life for intervention.
People with type 1 diabetes have been shown to have a lower quality of life than the general population (3, 4). In the literature, quality of life has also been found to be better
among persons with better glycemic control (5–7), male gender (2, 8), younger age (5, 8), higher socioeconomic status (5, 9, 10), and fewer late complications (5, 9, 11). Findings have been mixed regarding the relations between quality of life in people with type 1 diabetes and duration of diabetes (either no association (5, 11) or a better quality of life with a shorter duration (2, 9)) and treatment regimen (either no association (11, 12) or a better quality of life with more intensive treatment (3, 8)). In these studies, three types of measures were implemented to conceptualize and quan-tify quality of life: generic quality of life, which measured various domains of functioning and well-being that were applicable to different diseases (2, 4, 5, 8, 9, 11); diabetes-specific quality of life, which focused on the diabetes-specific prob-lems posed by diabetes (6, 7, 11, 12); and overall quality of life, which provided a global assessment of quality of life and could be a score for multidimensional generic quality of life or a single-question measurement (10, 13).
Correspondence to Dr. Guan-Hua Huang, Institute of Statistics, National Chiao Tung University, 1001 Ta Hsueh Road, Hsinchu 300, Taiwan (e-mail: [email protected]).
at National Chiao Tung University Library on April 27, 2014
http://aje.oxfordjournals.org/
Despite the rich research on quality of life in persons with type 1 diabetes, results have been limited or inconclusive, for the following three reasons. First, although type 1 diabetes is most often diagnosed in childhood, most studies have been conducted in adults (2, 4, 5, 8, 9, 11). Less has been done in studying quality of life among young people (6, 7, 12). Second, many studies have had rather small sample sizes (approximately 69–108 (5, 7, 9, 11, 12)) and therefore may not have had enough power to address some questions. Third, there have been few longitudinal studies (4, 14), which permit assessment of change in quality of life over time and the effects of risk factors within a given person.
The Wisconsin Diabetes Registry Study is a population-based cohort study that follows participants from the diag-nosis of type 1 diabetes. We have longitudinally collected data on these persons’ self-rated global health status and risk factors. The data provided us with a unique opportunity to examine one measure of quality of life among youths and young adults with type 1 diabetes. Therefore, we aimed to use self-rated global health to evaluate quality of life in a population-based cohort of children, adolescents, and young adults followed continuously from diabetes diagnosis and to examine its association with longitudinally measured clin-ical and sociodemographic factors.
MATERIALS AND METHODS Population
Between May 1987 and April 1992, all patients aged less than 30 years with newly diagnosed type 1 diabetes in south-central Wisconsin (28 counties) were invited to participate in the study. Diabetes was defined by the classic symptoms of polyuria and polydipsia with initiation of exogenous insulin use. Subjects were identified by their physicians, by nurse educators, or by themselves or their families. Details on recruitment and case ascertainment have been published previously (15, 16). An estimated 97 percent of hospitalized children, 82 percent of hospitalized adolescents, and 23 percent of hospitalized adults were identified. Among the 733 persons identified at all ages, 569 provided self-rated health data for this analysis, giving us 8,567 measurements through April 2002. There was no difference in sex between participants and nonparticipants (48 percent of participants and 49 percent of nonparticipants were female). Participants were slightly younger than nonparticipants (the mean ages at diagnosis were 11.1 years and 13.7 years, respectively), and participants were predominantly White (94 percent of partic-ipants vs. 51 percent of nonparticpartic-ipants).
Data collection
Details on data collection and specimen handling and testing are available elsewhere (15, 16). In brief, demo-graphic information, including birth date, parental educa-tional level, parental occupation, race, and sex, was collected by telephone interview 2–3 months after diagnosis. Although parental educational level and occupation can change over time, only the baseline values were recorded. Starting 3–4 months after diagnosis, subjects were asked to
submit a blood specimen at each routine visit to their local physician or clinic, or every 4 months if no visit was sched-uled. The blood was delivered in plastic foam containers to the study’s central laboratory, where it was analyzed for total glycosylated hemoglobin. Among 569 subjects in the present analysis, 79 percent returned at least one sample per year across the duration of their study participation.
We mailed questionnaires every 6 months to obtain self-reports on diabetes management, perception of health, and diabetes-related hospitalizations, as well as information on the patient’s physician and health insurance. At least one questionnaire was returned each year by 95 percent of persons in the analysis.
Participants were examined for eye retinopathy and kidney microalbuminuria complications by means of standard protocols (15, 17) during the first year after diagnosis and at 4, 7, and 9 years’ duration. Retinopathy status was deter-mined using a severity scale developed previously (17, 18), ranging from no retinopathy in either eye to treated or prolif-erative retinopathy in both eyes. Subjects were classified as having retinopathy if they had at least one eye with retinop-athy. Urinary albumin excretion rates were quantified from 24-hour urine specimens (obtained at the initial and 4-year examinations) or from timed overnight urine specimens (obtained at the 7- and 9-year examinations). Microalbumin-uria was defined by a urinary albumin excretion rate ≥70 µg/
minute in 24-hour samples and ≥20 µg/minute in timed
over-night samples. In the present analysis, 80 percent of partici-pants had three or more valid measures of retinopathy status, and 77 percent had three or more valid measures of microal-buminuria status.
Self-rated health status and risk factors
Information on participants’ self-rated health was collected through a question on the mailed questionnaire: “Compared with other people your age, do you feel that right now your health is excellent, good, fair, or poor?”.
We hypothesized the following risk factors to be poten-tially related to self-rated health. These factors can be divided into three categories. Sociodemographic factors included participant’s age at questionnaire completion, sex, race, mother’s total number of years of education, and parental socioeconomic level, defined using the scheme of Stevens and Cho (19), which assigned a score between 14 and 90 to rank occupations from the lowest to the highest. Diabetic factors included participant’s age at diagnosis of diabetes, duration of type 1 diabetes, any hypoglycemic episodes in the previous 6 months, any hospitalization in the previous 6 months, number of insulin injections per day, insulin dose per day, glycosylated hemoglobin level, and presence of retinopathy or microalbuminuria. We also exam-ined questionnaire-management factors, including informa-tion on who completed the quesinforma-tionnaire (the participant or a proxy respondent) and the effect of noncompliance, measured by the average number of questionnaires submitted per year. Among these risk factors, sex, race, mother’s years of education, parental socioeconomic level, age at diabetes diagnosis, and the compliance measure were
at National Chiao Tung University Library on April 27, 2014
http://aje.oxfordjournals.org/
time-independent variables, and others varied across time points.
From each questionnaire submission, we obtained data on the subjects’ self-rated health and risk factors, except for glycosylated hemoglobin and complication measurements, which were assessed at different time points. The glycosy-lated hemoglobin level chosen to correspond to each time point of self-rated health was the average of all glycosylated hemoglobin measurements made between the current ques-tionnaire submission and the previous quesques-tionnaire submis-sion. For complication measurements, each self-rated health point was related to the closest complication status measured prior to the questionnaire submission.
Statistical methods
Means or percentages for identified risk factors in the four categories of self-rated health were used to describe the char-acteristics of four health perception groups. We performed significance testing to compare the four health groups using the generalized estimating equations approach with the exchangeable correlation structure (20), which took into account correlation among measurements from the same person. Generalized estimating equations analyses were performed using the GENMOD procedure in SAS (21).
To display the longitudinal pattern of self-rated health, we plotted the probability of reporting health better than or equal to “good” against duration of type 1 diabetes for different age-at-diabetes-diagnosis groups. We obtained the plot by smoothing the scatterplot of the indicator of reporting health that was better than or equal to good versus diabetes duration. This was done for each age-at-diagnosis group. We used a plot that converted the probability scale to the log odds scale to empirically check whether a more complex trend for the log odds of self-rated health and diabetes dura-tion across age-at-diagnosis groups was needed in the regres-sion model described below.
We examined the relation between self-rated health and multiple risk factors using a random-effects model for ordinal response data (22–25). This model can describe the dependence of longitudinally measured “ordinal” self-rated health responses (with alternatives: excellent, good, fair, and poor) on multiple risk factors. The random-effects model for ordinal response data uses the proportional odds model (26) to characterize the relation of ordinal-scaled self-rated health to risk factors. It assumes that the regression coefficients in the proportional odds model vary from person to person, thus reflecting the natural heterogeneity of self-rated health caused by unmeasured factors. Since self-rated health reflects people’s own perceptions, and everyone’s definition of, for example, excellent health is different even with the same true health, the heterogeneity assumption is suitable for our data. The model also assumes that the variability in regression coefficients can be represented by a probability distribution and, therefore, correlation of repeated self-ratings of health from the same person arises from their sharing a probability distribution (27).
Because participants in the Wisconsin Diabetes Registry Study had repeated measurements taken across time, we can estimate the change in self-rated health between two levels
of a risk factor within a given person, in addition to the change averaged across different persons. The within- and between-individual changes can be quite different; therefore, it is necessary to consider these two changes jointly (28). Here, we adopted a modeling technique that can distinguish between-individual changes from within-individual changes (28).
More specifically, suppose Yij is the level of health
reported by participant i at questionnaire submission j and
the possible values of Yij are 1, 2, 3, and 4 (1 = poor, 2 = fair,
3 = good, and 4 = excellent); then the random-effects model used is
(1)
where c = 1, 2, or 3 represents different health levels; zi
represents all of the time-independent risk factors identified for participant i (the boldface type denotes multiple factors);
xij represents time-dependent risk factors for participant i at
questionnaire submission j; denotes the average
time-dependent risk factor value of all questionnaire submissions
for participant i; αc, γ, βb, and βw are the fixed values (the
“fixed” effects); and ai is the intercept of participant i and is
assumed to follow a normal distribution with mean zero and
variance δ2 (the “random” effect).
For time-independent variables, exp(γ) is the odds ratio for
reporting better health in a comparison of, for example, females with males. For time-dependent variables, the model decomposes risk factors into components from the average value of all submissions and differences between each
submission and the average value. Exp(βb) is interpreted as
the odds ratio for reporting better health when comparing participants who, for example, were hospitalized in the
previous 6 months versus those who were not. Exp(βw) is
interpreted as the odds ratio for reporting better health for a participant who was hospitalized in the previous 6 months versus self-reporting by the same participant if he/she had
not been hospitalized. Exp(βb) estimates the population
average, and exp(βw) estimates the change within the same
person. Through the random effect ai, equation 1 allows each
participant to have his/her own probability of reporting
better health. The variance δ2 represents the degree of
heter-ogeneity across participants in reporting of self-rated health that is not attributable to identified risk factors (27).
The random-effects model for ordinal response data in equation 1 can be fitted using PROC NLMIXED in SAS, version 7, or later versions. An example program is shown in the Appendix. Details on the program description can be found in the paper by Agresti et al. (24).
To investigate potential effects of noncompliance, we included the return rate for the questionnaires in equation 1 as a main effect and as interactions with other important risk factors. Risk factor coefficients were then readjusted to the mean compliance of all study participants. This approach can be viewed as a “pattern-mixture” model (29). The idea is to first estimate the relation between risk factors and self-rated health under given compliance patterns and then to obtain an average effect over the mixture of compliance patterns. A difference between the mixture effect and the
log Pr Y( ij>c)
Pr Y( ij≤c)
--- = (αc+ai) γz+ i+βbxi.+βw(xij–xi.),
xi.
at National Chiao Tung University Library on April 27, 2014
http://aje.oxfordjournals.org/
effect without the compliance adjustment indicates the need to adjust for noncompliance.
RESULTS
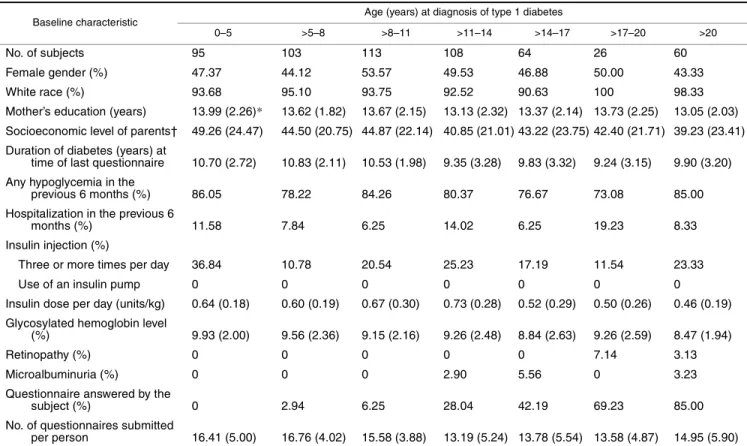
Table 1 shows baseline levels of risk factors in the study population, stratified by age at diagnosis of diabetes. The mean total glycosylated hemoglobin level of our population was 10.8 percent, which corresponds to average glycemic control according to American Diabetes Association guide-lines (30). Participants were followed for a mean of 10.2 years.
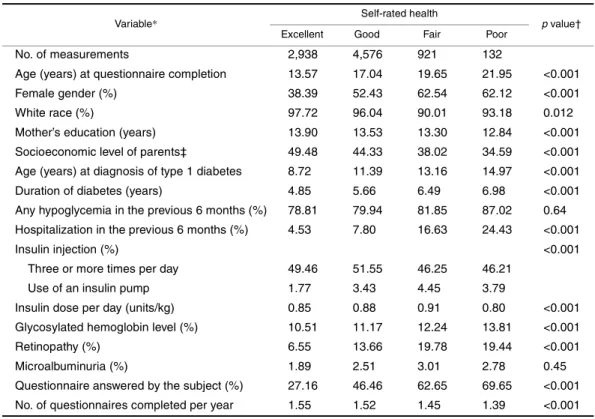
Risk factor distributions by self-reported health status As table 2 shows, 34 percent, 53 percent, 11 percent, and 2 percent of the questionnaire responses rated health as excel-lent, good, fair, and poor, respectively, indicating that the distribution was skewed toward better health. People who reported better health were younger, were more likely to be male, were more likely to be White, had a higher maternal educational level, had a higher socioeconomic level, were younger at diabetes diagnosis, had a shorter duration of diabetes, were less likely to have been hospitalized in the
previous 6 months, had a lower glycosylated hemoglobin level, and were less likely to have retinopathy. The “good” health group had the highest percentage of use of an inten-sive insulin regimen, and the “poor” health group had the lowest. Insulin dose per day differed among the four health groups, with the poor health group taking the lowest amount of insulin per day and the fair health group taking the highest amount per day. Questionnaires that were answered by the diabetic subject were less likely to identify health as excel-lent or good than questionnaires answered by others. A higher compliance rate for returning questionnaires was associated with reporting of better health. Distributions of hypoglycemic episodes and the presence of microalbumin-uria were not significantly different across self-rated health status groups.
Longitudinal pattern of self-rated health
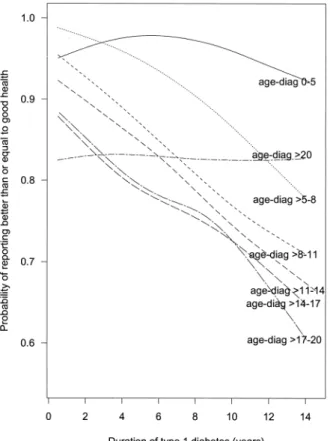
Figure 1 shows the longitudinal relation between the prob-ability of reporting better heath and duration of diabetes across age-at-diagnosis groups. Participants who had been diagnosed with diabetes before age 6 years (0–5 diagnosis group) and participants who had been diagnosed after age 20 years (>20 diagnosis group) had patterns different from
TABLE 1. Baseline levels of risk factors (mean values or percentages) by age at diagnosis of type 1 diabetes mellitus in the Wisconsin Diabetes Registry Study, 1987–2002
* Numbers in parentheses, standard deviation.
† Socioeconomic level was based on the scheme of Stevens and Cho (19), which assigned a score between 14 and 90 to rank occupations from lowest to highest.
Baseline characteristic Age (years) at diagnosis of type 1 diabetes
0–5 >5–8 >8–11 >11–14 >14–17 >17–20 >20
No. of subjects 95 103 113 108 64 26 60
Female gender (%) 47.37 44.12 53.57 49.53 46.88 50.00 43.33
White race (%) 93.68 95.10 93.75 92.52 90.63 100 98.33
Mother’s education (years) 13.99 (2.26)* 13.62 (1.82) 13.67 (2.15) 13.13 (2.32) 13.37 (2.14) 13.73 (2.25) 13.05 (2.03) Socioeconomic level of parents† 49.26 (24.47) 44.50 (20.75) 44.87 (22.14) 40.85 (21.01) 43.22 (23.75) 42.40 (21.71) 39.23 (23.41) Duration of diabetes (years) at
time of last questionnaire 10.70 (2.72) 10.83 (2.11) 10.53 (1.98) 9.35 (3.28) 9.83 (3.32) 9.24 (3.15) 9.90 (3.20) Any hypoglycemia in the
previous 6 months (%) 86.05 78.22 84.26 80.37 76.67 73.08 85.00 Hospitalization in the previous 6
months (%) 11.58 7.84 6.25 14.02 6.25 19.23 8.33
Insulin injection (%)
Three or more times per day 36.84 10.78 20.54 25.23 17.19 11.54 23.33
Use of an insulin pump 0 0 0 0 0 0 0
Insulin dose per day (units/kg) 0.64 (0.18) 0.60 (0.19) 0.67 (0.30) 0.73 (0.28) 0.52 (0.29) 0.50 (0.26) 0.46 (0.19) Glycosylated hemoglobin level
(%) 9.93 (2.00) 9.56 (2.36) 9.15 (2.16) 9.26 (2.48) 8.84 (2.63) 9.26 (2.59) 8.47 (1.94)
Retinopathy (%) 0 0 0 0 0 7.14 3.13
Microalbuminuria (%) 0 0 0 2.90 5.56 0 3.23
Questionnaire answered by the
subject (%) 0 2.94 6.25 28.04 42.19 69.23 85.00
No. of questionnaires submitted
per person 16.41 (5.00) 16.76 (4.02) 15.58 (3.88) 13.19 (5.24) 13.78 (5.54) 13.58 (4.87) 14.95 (5.90)
at National Chiao Tung University Library on April 27, 2014
http://aje.oxfordjournals.org/
those of others. In comparisons of participants from the same age-at-diagnosis group, the probability of reporting good health decreased as duration of diabetes increased, except for the 0–5 diagnosis group, in which the probability increased during the first 6 years of duration and decreased after that, and the >20 diagnosis group, in which the probability stayed fairly constant. For a specific duration of diabetes, partici-pants who were diagnosed at earlier ages were more likely to report better health than those diagnosed at later ages, excluding the diagnosis groups 0–5 and >20.
Relation between self-rated health and multiple risk factors
By converting the probability scale of figure 1 to the log odds scale (not shown), we observed several features that might affect the model choice. A linear relation between log odds and duration was apparent within all age-at-diagnosis groups except for the 0–5 group. The fact that the difference between the log odds for two consecutive diagnosis groups at a given duration decreased gradually with age suggested that there was a nonlinear relation between the log odds and age at diagnosis. The crossover between diagnosis groups 0–
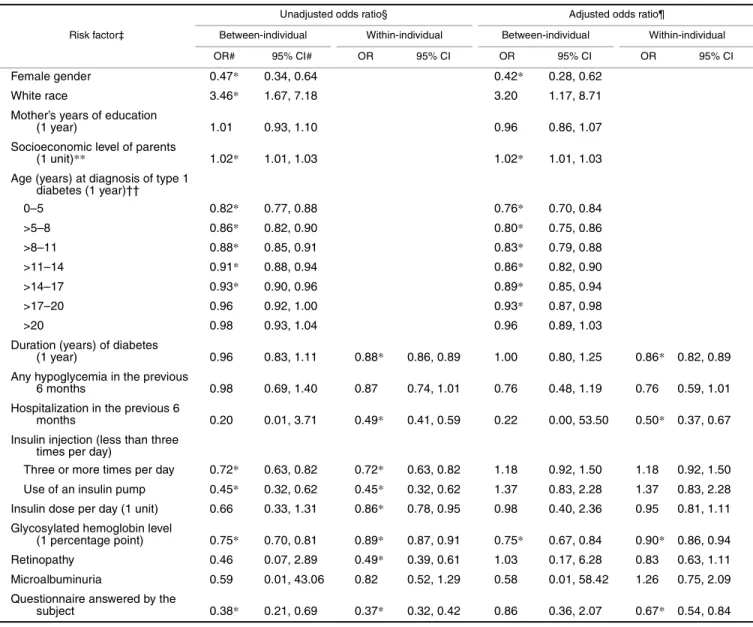
5 and >20 and other groups might indicate a possible interac-tion between age at diagnosis and durainterac-tion. Similar plots between log odds and other risk factors were also created (not shown). None indicated a nonlinear relation. Because the effects of age at diagnosis, duration, and age at question-naire completion cannot be estimated simultaneously, the model used only age at diagnosis and duration. Odds ratio estimates from the final random-effects model (equation 1) are given in table 3. The final model included linear terms for all identified risk factors and a quadratic term for age at diagnosis. The interaction between age at diagnosis and duration was not significant and was not included in the final model. The “unadjusted” odds ratio for a diabetic factor was obtained from a model that also included sociodemographic factors and an indicator variable for the person who answered the questionnaire (participant vs. other). The unad-justed odds ratios for sociodemographic factors and the questionnaire-answering indicator were from a model containing these variables only. The adjusted odds ratios were from a multivariate model that included all available risk factors.
We first examined within-individual changes for time-dependent risk factors to draw conclusions on how risk
TABLE 2. Distribution of risk factors for poor health by self-reported health status among persons with type 1 diabetes in the Wisconsin Diabetes Registry Study, 1987–2002
* All available longitudinal data were used for calculating the distribution.
† p values were based on the generalized estimating equations approach with the exchangeable correlation structure.
‡ Socioeconomic level was based on the scheme of Stevens and Cho (19), which assigned a score between 14 and 90 to rank occupations from lowest to highest.
Variable* Self-rated health p value†
Excellent Good Fair Poor
No. of measurements 2,938 4,576 921 132
Age (years) at questionnaire completion 13.57 17.04 19.65 21.95 <0.001
Female gender (%) 38.39 52.43 62.54 62.12 <0.001
White race (%) 97.72 96.04 90.01 93.18 0.012
Mother’s education (years) 13.90 13.53 13.30 12.84 <0.001 Socioeconomic level of parents‡ 49.48 44.33 38.02 34.59 <0.001 Age (years) at diagnosis of type 1 diabetes 8.72 11.39 13.16 14.97 <0.001 Duration of diabetes (years) 4.85 5.66 6.49 6.98 <0.001 Any hypoglycemia in the previous 6 months (%) 78.81 79.94 81.85 87.02 0.64 Hospitalization in the previous 6 months (%) 4.53 7.80 16.63 24.43 <0.001
Insulin injection (%) <0.001
Three or more times per day 49.46 51.55 46.25 46.21
Use of an insulin pump 1.77 3.43 4.45 3.79
Insulin dose per day (units/kg) 0.85 0.88 0.91 0.80 <0.001 Glycosylated hemoglobin level (%) 10.51 11.17 12.24 13.81 <0.001
Retinopathy (%) 6.55 13.66 19.78 19.44 <0.001
Microalbuminuria (%) 1.89 2.51 3.01 2.78 0.45
Questionnaire answered by the subject (%) 27.16 46.46 62.65 69.65 <0.001 No. of questionnaires completed per year 1.55 1.52 1.45 1.39 <0.001
at National Chiao Tung University Library on April 27, 2014
http://aje.oxfordjournals.org/
factors affect a person’s health perception over time. Race, insulin injection frequency, insulin dose, and retinopathy, which were significant in the unadjusted model, became nonsignificant in the adjusted model. Among sociodemo-graphic factors, sex and socioeconomic level had the two most significant effects. Younger age at diagnosis of diabetes had a positive effect on reporting of better health. However, as the age at diagnosis increased, this effect flat-tened. With every 1-year increase in duration of diabetes, a participant was 0.86 times as likely to report better health than he or she was the previous year, even after adjustment for all other risk factors. The odds of reporting better health for a participant decreased with hospitalization. Glycemic control was the predominant effect among diabetes-manage-ment factors (insulin injection frequency, insulin dose, and glycosylated hemoglobin). The better the glycemic control (lower glycosylated hemoglobin level) for a participant, the more likely that good health was reported. Diabetic microal-buminuria and retinopathy were not associated with a partic-ipant’s self-rated health after adjustment for other risk factors.
When comparing within- and between-individual effects for time-dependent risk factors, we found that the
within-individual effect had less variation (a narrower confidence interval) than the between-individual effect, and the signifi-cance of the effect could change. This indicates that the rela-tion of longitudinally measured self-reported health to risk factors within the same person was more reliable and consis-tent than the relation based on the cross-sectional average among different people.
Parents or other family members often answered question-naires in the early years for participants who were diagnosed with diabetes at a young age. Therefore, age at diagnosis was related to having questionnaires answered by others. Results from table 3 show that participants were less likely to report good health when they themselves answered the question-naire than when the questionquestion-naire was answered by others. After adjustment for age at diagnosis and other diabetic factors, this effect was still significant but became less apparent. Furthermore, the interaction between age at diag-nosis and the indicator variable for who answered the ques-tionnaire was not significant. The tendency for parents to report better health remained the same among children diag-nosed at different ages.
The compliance index was added to each model for the unadjusted diabetic factor effect of table 3. Results showed little change in diabetic factor coefficients, comparing the mixture effects with the unadjusted effects in table 3 (not shown).
Variability in self-rated health
The estimate of variance δ2 in the random-effects model
(equation 1) with all identified risk factors was 3.51 (95 percent confidence interval: 2.84, 4.18), which indicated that participants varied in their reported health even after adjust-ment for all identified risk factors. This variability reflected the possibility that unmeasured factors and individual differ-ences in health perception could lead to heterogeneity. DISCUSSION
To our knowledge, this is the first population-based longi-tudinal study of an incident cohort showing that demo-graphic, socioeconomic, and diabetes-related factors are related to self-rated health status among persons with type 1 diabetes. Because longitudinal data were available, we used a random-effects model (equation 1), which allowed sepa-rate between- and within-individual covariate effects, to study trends in self-rated health within the same person.
In our study, males reported better health than females, and people at higher socioeconomic levels generally reported better health than those at lower levels. This is consistent with the findings of other studies (2, 5, 8–10). We also found that questionnaires answered by the subjects themselves were less likely to show good health ratings than those answered by others. This is an important consideration for studies, such as ours, in which surrogate responses are used for children. Parents who respond on behalf of their children may have difficulty separating their own feelings from their child’s and may be affected by feelings of guilt, or may respond favorably as a method of coping with their child’s chronic illness. Since we included very young
chil-FIGURE 1. Relation of duration of type 1 diabetes mellitus to the probability of reporting health better than or equal to “good” for differ-ent age-at-diabetes-diagnosis (“age-diag”) groups in the Wisconsin Diabetes Registry Study, 1987–2002. Age-at-diagnosis groups: 0–5 years, ——; >5–8 years, · · · · ·; >8–11 years, - - - - -; >11–14 years, – – – –; >14–17 years, — — —; >17–20 years, — - — - —; >20 years, – - – - –.
at National Chiao Tung University Library on April 27, 2014
http://aje.oxfordjournals.org/
dren, we did not exclude parents’ responses, but we adjusted the results of the final models for type of respondent.
Our findings demonstrate that people who are younger at diagnosis of diabetes rate their health more highly than do people who are older at diagnosis, even after adjustment for respondent, duration, and possible risk factors. This may be
due to “unmeasured” exposures and/or to better adaptation in coping with diabetes among persons with younger ages at diagnosis. We also find that self-rated health for people with type 1 diabetes decreases gradually as duration of diabetes increases, even when diabetes management and complica-tions are taken into account. The duration effect may be
TABLE 3. Odds ratios from a random-effects model for the relation between better self-rated health and multiple risk factors in the Wisconsin Diabetes Registry Study, 1987–2002†
* p < 0.05.
† Time-independent risk factors have only between-individual odds ratios, which were calculated on the basis of exp(γ). For time-dependent risk factors, between-individual odds ratios were calculated on the basis of exp(βb) and within-individual odds ratios were calculated on the basis
of exp(βw).
‡ Parentheses identify the unit of increase or the reference group for which the odds ratio was calculated.
§ The unadjusted odds ratio for a diabetic factor was obtained from a model that also included sociodemographic factors and an indicator variable for the person who answered the questionnaire. The unadjusted odds ratios for sociodemographic factors and the indicator variable for the person who answered the questionnaire were obtained from a model containing these variables only.
¶ Adjusted odds ratios were obtained from a model that included all available risk factors. # OR, odds ratio; CI, confidence interval.
** Socioeconomic level was based on the scheme of Stevens and Cho (19), which assigned a score between 14 and 90 to rank occupations from lowest to highest.
†† A quadratic term for age at diagnosis was included in the model, and odds ratios shown are for every 1-year increase in the median age of the corresponding diagnosis group.
Risk factor‡
Unadjusted odds ratio§ Adjusted odds ratio¶
Between-individual Within-individual Between-individual Within-individual
OR# 95% CI# OR 95% CI OR 95% CI OR 95% CI
Female gender 0.47* 0.34, 0.64 0.42* 0.28, 0.62
White race 3.46* 1.67, 7.18 3.20 1.17, 8.71
Mother’s years of education
(1 year) 1.01 0.93, 1.10 0.96 0.86, 1.07
Socioeconomic level of parents
(1 unit)** 1.02* 1.01, 1.03 1.02* 1.01, 1.03
Age (years) at diagnosis of type 1 diabetes (1 year)†† 0–5 0.82* 0.77, 0.88 0.76* 0.70, 0.84 >5–8 0.86* 0.82, 0.90 0.80* 0.75, 0.86 >8–11 0.88* 0.85, 0.91 0.83* 0.79, 0.88 >11–14 0.91* 0.88, 0.94 0.86* 0.82, 0.90 >14–17 0.93* 0.90, 0.96 0.89* 0.85, 0.94 >17–20 0.96 0.92, 1.00 0.93* 0.87, 0.98 >20 0.98 0.93, 1.04 0.96 0.89, 1.03
Duration (years) of diabetes
(1 year) 0.96 0.83, 1.11 0.88* 0.86, 0.89 1.00 0.80, 1.25 0.86* 0.82, 0.89 Any hypoglycemia in the previous
6 months 0.98 0.69, 1.40 0.87 0.74, 1.01 0.76 0.48, 1.19 0.76 0.59, 1.01 Hospitalization in the previous 6
months 0.20 0.01, 3.71 0.49* 0.41, 0.59 0.22 0.00, 53.50 0.50* 0.37, 0.67 Insulin injection (less than three
times per day)
Three or more times per day 0.72* 0.63, 0.82 0.72* 0.63, 0.82 1.18 0.92, 1.50 1.18 0.92, 1.50 Use of an insulin pump 0.45* 0.32, 0.62 0.45* 0.32, 0.62 1.37 0.83, 2.28 1.37 0.83, 2.28 Insulin dose per day (1 unit) 0.66 0.33, 1.31 0.86* 0.78, 0.95 0.98 0.40, 2.36 0.95 0.81, 1.11 Glycosylated hemoglobin level
(1 percentage point) 0.75* 0.70, 0.81 0.89* 0.87, 0.91 0.75* 0.67, 0.84 0.90* 0.86, 0.94 Retinopathy 0.46 0.07, 2.89 0.49* 0.39, 0.61 1.03 0.17, 6.28 0.83 0.63, 1.11 Microalbuminuria 0.59 0.01, 43.06 0.82 0.52, 1.29 0.58 0.01, 58.42 1.26 0.75, 2.09 Questionnaire answered by the
subject 0.38* 0.21, 0.69 0.37* 0.32, 0.42 0.86 0.36, 2.07 0.67* 0.54, 0.84
at National Chiao Tung University Library on April 27, 2014
http://aje.oxfordjournals.org/
absent in the diagnosis group >20 years (figure 1). Several studies reported no significant association between quality of life and duration of diabetes (5, 11). In most of these studies, older diagnosis groups were mixed with younger diagnosis groups, which might partially explain this absence of significance, especially if there was a wide range in ages at diagnosis in the study population.
Another important finding is that better glycemic control was associated with better health perception, even after adjustment for additional risk factors. This is important to know for chil-dren and adolescents, because achieving near-normal glycemia can be especially challenging and stressful for this age group over time. We also noted a significant inverse relation between number of insulin injections and self-rated health. However, this might be explained by treatment changes made in response to poor perceived health, and the relation was attenuated after adjustment for diabetes duration, glycemic control, and hospi-talization. Maintaining good glycemic control during the first decade of diabetes may outweigh the increased burden involved, even in children and adolescents, and long-term factors or hospitalization may have a greater importance in overall perception of health than daily-care aspects. Two other studies also reported a significant correlation between glycemic control and quality of life in young people (6, 7).
The presence of retinopathy was associated with reporting worse health, but this effect was marginal after adjustment for other risk factors. Microalbuminuria was not associated with health perception. Studies of adults with diabetes have consis-tently found that complications are associated with worsened quality of life (5, 9, 11). Our findings might be due to the low complication rate in these particular children and adolescents, or the presence of microalbuminuria and early measures of retinopathy might have no immediate impact on a person’s perception of health. Unlike adults, most of our study popula-tion has not developed overt kidney disease or vision problems, so they may have little or no change in their health perceptions due to complications. An additional reason for little correspon-dence between complications and quality of life is the long intervals between assessments of complications relative to the questionnaire frequency. Children and their parents might have known about complications from their nonstudy care long before complications were measured in the study; thus, the estimated effects based on the study measurements may not be as significant as they would have been otherwise.
Self-rated health was used as a measure of quality of life in our study. This measurement reflects people’s overall perceptions of health, is easy to obtain, and has been shown to be a powerful predictor of morbidity and mortality (31, 32). However, unlike other, more complex quality-of-life measurements (e.g., the generic Medical Outcomes Study 36-Item Short Form (SF-36) (3) and the diabetes-specific Diabetes Quality of Life questionnaire (11)), it does not allow examination of the impact of risk factors on different aspects of quality of life (e.g., physical, emotional, and social well-being). Nevertheless, our results provide useful infor-mation for selecting potential risk factors, understanding longitudinal patterns, and creating appropriate statistical methods for more detailed studies of quality of life among persons with type 1 diabetes.
ACKNOWLEDGMENTS
This research was supported by National Institutes of
Healthgrant DK36904 (Principal Investigator: Dr. Donn J.
D’Alessio).
REFERENCES
1. National Institute of Diabetes and Digestive and Kidney Dis-eases. National diabetes statistics fact sheet: general informa-tion and nainforma-tional estimates on diabetes in the United States, 2000. Bethesda, MD: National Institute of Diabetes and Diges-tive and Kidney Diseases, 2002.
2. Lloyd CE, Orchard TJ. Physical and psychological well-being in adults with type 1 diabetes. Diabetes Res Clin Pract 1999;44: 9–19.
3. Rubin RR, Peyrot M. Quality of life and diabetes. Diabetes Metab Res Rev 1999;15:205–18.
4. Wändell PE, Brorsson B, Åberg H. Quality of life among dia-betic patients in Swedish primary health care and in the general population: comparison between 1992 and 1995. Qual Life Res 1998;7:751–60.
5. Wikblad K, Leksell J, Wibell L. Health-related quality of life in relation to metabolic control and late complications in patients with insulin dependent diabetes mellitus. Qual Life Res 1996;5: 123–30.
6. Hoey H, Aanstoot H-J, Chiarelli F, et al. Good metabolic con-trol is associated with better quality of life in 2,101 adolescents with type 1 diabetes. Diabetes Care 2001;24:1923–8.
7. Guttmann-Bauman I, Flaherty BP, Strugger M, et al. Metabolic control and quality-of-life self-assessment in adolescents with IDDM. Diabetes Care 1998;21:915–18.
8. Hanestad BR. Self-reported quality of life and the effect of dif-ferent clinical and demographic characteristics in people with type 1 diabetes. Diabetes Res Clin Pract 1993;19:139–49. 9. Elbagir MN, Etayeb NO, Eltom MA, et al. Health-related
qual-ity of life in insulin-treated diabetic patients in the Sudan. Diabetes Res Clin Pract 1999;46:65–73.
10. Jonsson PM, Nystrom L, Sterky G, et al. Sociodemographic predictors of self-rated health in patients with diabetes of short duration. Scand J Public Health 2001;29:263–70.
11. Parkerson GR Jr, Connis RT, Broadhead WE, et al. Disease-specific versus generic measurement of health-related quality of life in insulin-dependent diabetic patients. Med Care 1993;7: 629–39.
12. Eiser C, Flynn M, Green E, et al. Quality of life in young adults with type 1 diabetes in relation to demographic and disease variables. Diabet Med 1992;9:375–8.
13. Dasbach EJ, Klein R, Klein BE, et al. Self-rated health and mortality in people with diabetes. Am J Public Health 1994;84: 1775–9.
14. Wikby A, Stenström U, Andersson P-O, et al. Metabolic con-trol, quality of life, and negative life events: a longitudinal study of well-controlled and poorly regulated patients with type 1 diabetes after changeover to insulin pen treatment. Diabetes Educ 1998;24:61–6.
15. Allen C, Duck SC, Sufit RL, et al. Glycemic control and periph-eral nerve condition in children and young adults after 5–6 months of IDDM. Diabetes Care 1992;15:502–7.
16. Palta M, LeCaire T, Daniels K, et al. Risk factors for hospital-ization in a cohort with type 1 diabetes. Am J Epidemiol 1997; 146:627–36.
17. Klein R, Palta M, Allen C, et al. Incidence of retinopathy and associated risk factors from time of diagnosis of
at National Chiao Tung University Library on April 27, 2014
http://aje.oxfordjournals.org/
dependent diabetes. Arch Ophthalmol 1997;115:351–6. 18. Klein R, Moss SE, Klein BE. Change in glycemia in a four-year
interval in insulin-dependent diabetes. Ann Epidemiol 1992;2: 283–94.
19. Stevens G, Cho JH. Socioeconomic indexes and the new 1980 census occupational classification scheme. Soc Sci Res 1985; 14:142–68.
20. Liang KY, Zeger SL. Longitudinal data and analysis using gen-eralized linear models. Biometrika 1986;73:13–22.
21. SAS Institute, Inc. SAS/STAT user’s guide, version 8. Cary, NC: SAS Institute, Inc, 1999.
22. Liang KY, Zeger SL. Regression analysis for correlated data. Annu Rev Public Health 1993;14:43–68.
23. Zeger SL, Liang KY. An overview of methods for the analysis of longitudinal data. Stat Med 1992;11:1825–39.
24. Agresti A, Booth JG, Hobert JP, et al. Random-effects modeling of categorical response data. Sociol Methodol 2000;30:27–80. 25. Hedeker D, Gibbons RD. A random-effects ordinal regression
model for multilevel analysis. Biometrics 1994;50:933–44. 26. McCullagh P, Nelder J. Generalized linear models. 2nd ed.
New York, NY: Chapman and Hall, Inc, 1989.
27. Diggle PJ, Heagerty P, Liang KY, et al. Analysis of longitudinal data. 2nd ed. New York, NY: Oxford University Press, 2002. 28. Snijders TA, Bosker RJ. Multilevel analysis: an introduction to
basic and advanced multilevel modeling. Thousand Oaks, CA: Sage Publications, 1999:52–56.
29. Wu MC, Carroll RJ. Estimation and comparison of changes in the presence of informative right censoring by modeling the censoring process. Biometrics 1988;44:175–88.
30. Kelley DB, ed. Medical management of type 1 diabetes. 3rd ed. Alexandria, VA: American Diabetes Association, 1998:30. 31. Idler EL, Benyamini Y. Self-rated health and mortality: a
review of twenty-seven community studies. J Health Soc Behav 1997;38:21–37.
32. Moller L, Kristensen TS, Hollnagel H. Self rated health as a predictor of coronary heart disease in Copenhagen, Denmark. J Epidemiol Community Health 1996;50:423–8.
APPENDIX
SAS (PROC NLMIXED) Code for Fitting the Random-Effects Model for Ordinal Response Data
To keep the illustration simple, we have included only the time-independent risk factor sex and the time-dependent variable hospitalization.
data healthdat;
/* read the data set, where hospm is the mean value of all hospitalization statuses for each participant */
set healthinput (keep = id health sex hospm hosp); /* indicators of self-rated health */
if health = 1 then y1 = 1; else y1 = 0; if health = 2 then y2 = 1; else y2 = 0; if health = 3 then y3 = 1; else y3 = 0; if health = 4 then y4 = 1; else y4 = 0; /* within-hosp change */
hospwithin = hosp – hospm; run;
proc nlmixed data = healthdat; bounds a2del a3del > 0; /* initial values */
parms a1 = 8.01 a2del = 2.28 a3del = 3.16 r = –0.59 bb = –1.26 bw = –0.75 delta = 1;
/* logit of cumulative probabilities */
eta1 = a1 + ai + (r*sex) + (bb*hospm) + (bw*hospwithin); eta2 = (a1 – a2del) + ai + (r*sex) + (bb*hospm) +
(bw*hospwithin);
eta3 = (a1 – a2del – a3del) + ai + (r*sex) + (bb*hospm) + (bw*hospwithin);
/* probability of each health level */ p1 = 1 – (exp(eta1)/(1 + exp(eta1))); p2 = 1 – (exp(eta2)/(1 + exp(eta2))) – p1; p3 = 1 – (exp(eta3)/(1 + exp(eta3))) – p1 – p2; p4 = 1 – p1 – p2 – p3;
/* likelihood of the data */
jp = (p1**y1)*(p2**y2)*(p3**y3)*(p4**y4); ll = log(jp);
model y1 ~ general(ll);
random ai ~ normal(0, delta*delta) subject = id; run;
at National Chiao Tung University Library on April 27, 2014
http://aje.oxfordjournals.org/