行政院國家科學委員會專題研究計畫 成果報告
共同基金之從眾行為與資訊及追隨領導者行為之關係(2/2)
計畫類別: 個別型計畫 計畫編號: NSC91-2416-H-004-001- 執行期間: 91 年 08 月 01 日至 93 年 07 月 31 日 執行單位: 國立政治大學財務管理學系 計畫主持人: 周行一 計畫參與人員: 徐苑玲 報告類型: 完整報告 報告附件: 出席國際會議研究心得報告及發表論文 處理方式: 本計畫可公開查詢中 華 民 國 93 年 8 月 26 日
行政院國家科學委員會專題研究計劃成果報告
共同基金之從眾行為與資訊及追隨領導者行為之關係(2/2)
計劃類別:個別型計劃
計劃編號:NSC91-2416-H-004-001
執行期限:91 年 8 月 1 日至 93 年 7 月 31 日
計劃主持人 :周行一
計劃參與人員:徐苑玲
處理方式:可立即對外提供參考
執行單位:國立政治大學財務管理學系
中華民國九十三年七月三十一日
Abstract
Sias (2004) suggested that previous studies find little evidence of institutional herding because they use the herding measure of Lakonishok, Shleifer and Vishny (1992). Sias adopted a different methodology and concluded that institutional investors herded due to informational cascades. But mutual funds exhibited the weakest propensity to herd because institutional investors’ tendency to herd was influenced by the different environment faced by them. The environment in which Taiwan’s mutual funds operate is conducive to information based herding. We find that herding measure becomes greater as sampling interval lengthens, implying that mutual funds receive and react to private information sequentially. We suggest that Sias’ conclusion is a natural result of the limitation of his quarterly data.
Keywords:mutual fund, herding, information, cascades JEL classification: G14, G23
I. Introduction
Sias (2004) suggested that previous studies had found little evidence of
institutional herding because they used the herding measure of Lakonishok, Shleifer
and Vishny (1992). By investigating the correlation between institutional investors’
demand for a security this quarter and their demand for the security last quarter, Sias
found significant evidence that institutional investors followed each other into and out
of the same security (herding). Among the different types of institutional investors
studied by Sias mutual funds and insurance companies exhibited the weakest
propensity to herd. In addition, mutual funds did not exhibit reputational herding
behavior.
Previous studies of herding focusing on pension fund (Lakonishok, Shleifer and
Vishny (1992)) and mutual fund (Grinblatt, Titman and Wermers (1995), Falkenstein
(1996), Wermers (1999)) also had limited evidence of mutual fund herding. Sias
attributed his weak evidence of mutual fund herding to that institutional investors’
tendency to herd is influenced by the different environment faced by them. But Sias
did not elaborate further the influence of the particular environment in which mutual
funds operate on the herding behavior of mutual funds.
Sias had evidence to conclude that institutional investors’ herding was related
to information. That institutional demand is positively correlated with
contemporaneous returns and weakly positively correlated with returns over the
following year is related to the way information is incorporated into security prices,
which is consistent with informational cascades and investigative herding.
information and trading with the herd because they infer information from each
other’s trades [Banerjee (1992), Bkihchandani, Hirschleifer, and Welch (1992), Sias
(2004)]. Investigative herding occurs when institutional investors’ information is
positively cross-sectionally correlated, possibly because they follow the same signals
[Froot, Scharfstein, and Stein (1992), Hirschleifer, Subrahmanyam, and Titman
(1994)].
Sias showed that although herding occurred in securities of all capitalization
(which is consistent with information based hypothesis), herding is strongest in
small-capitalization securities, which is most consistent with models that suggest
herding results from traders inferring information from each other’s trades. His
conclusion was based on Wermer’s (1999) argument that informational cascades are
more likely to occur in small-capitalization securities (where signals are noisier) and
his own argument that investigative herding may be more likely to occur in
large-capitalization securities (where signals are less noisy).
The environment in which Taiwan’s mutual funds operate is conducive to
information based herding. Unlike the US where there is overwhelming evidence
that most mutual funds do not outperform the market in terms of risk-adjusted returns,
Chow and Chen (2002) show that in year 2000, among 83 equity funds studied, 57
funds were able to beat the market. The corresponding figures were 41 out of 44
funds for 1998 to 2000 and 21 out of 29 for 1996 to 2000. Since funds in Taiwan
tend to be able to beat the market, it seems that mutual funds in Taiwan possess an
Almost all mutual funds are geared to produce maximum returns for investors.1 Funds frequently send research analysts to listed companies to collect valuable
information on their future prospects. Taiwan, however, does not have regulations
that require listed companies to give investors equal access to information. As a
result, it is very likely that some mutual funds may have information advantage over
other investors. Mutual funds have advantage over individuals in acquiring
information from the listed firms for several reasons. Mutual funds’ sheer size
makes it capable of moving stock price significantly and thus are formidable
contenders of listed firms’ large shareholders in influencing the stock price. Hence,
listed firms may give mutual funds preferential access to information so as to
influence mutual funds’ trading decision.
In addition, according to the rating on insider trading of International Institute for
Management Development, Taiwan was ranked 42nd in 2000 among the countries rated. There was widespread impression on the part of investors that some unruly
mutual fund managers used funds’ resources to “work” with insiders in price
manipulation. During our sample period, 90% of the trading volume on the TSEC
was attributed to individual investors. Since individual investors tend to be noise
traders, the market structure of Taiwan’s stock market is convenient for mutual funds
to utilize their information advantage.
If some funds have private information that others do not possess, then we would
expect these information-privileged funds to trade shortly after acquiring the
information. Moreover, since the information is private, the number of
information-privileged funds should be small in the beginning. Thus, if we observe
1
mutual funds’ herding behavior over a short interval, the number of funds herding
would be small. As the information is gradually released to other funds, a larger
number of funds should herd over a longer time frame.
Our hypothesis is consistent with the information acquisition model developed by
Hirshleifer, Subrahmanyam, and Titman (1994). Their model was based on an
empirically reasonable assumption that information is acquired by different traders at
different points of time. Some investors receive common private information early
because of lucky or superior skill, while unlucky or less skilled investors observe the
information later. An investor can profit on his information if it is obtained early
and subsequently acted upon by other investors. This is because if one gets
information and establishes his position early, then late informed traders would cause
the price to move in the same direction. He can then reverse his trade to realize
profit and reduce his risk exposure.
In this paper the herding behavior of Taiwanese mutual funds is studied over
different sampling frequencies: intraday, daily, weekly, monthly and quarterly.
Using the herding measure of Lakonishok et. al. (1992), we show that mutual funds in
Taiwan exhibit much stronger tendency to herd than what is found in the US literature
(Lakonishok et. al. (1992), Titman and Wermers (1995), and Wermers (1999). There
is a marked increase in the daily and weekly herding measure over intraday herding
measure and the herding measure decreases with sampling frequency. In addition,
fewer funds trade the same stocks over shorter intervals and fewer stocks exhibit
herding phenomenon over shorter intervals. As sampling interval lengthens, herding
Our finding implies that herding is more likely induced by delaying sequential
reactions to common information. Had mutual funds obtained information at the
same time, they would all have traded pretty much within a fairly short period of time.
Because of the sequential nature of information arrival, private information is known
to a small number of fund managers initially and only revealed to other fund
managers with time. That is why a longer interval is needed for funds to trade the
same stock in the same direction, as we find in this paper, which is consistent with the
analysis of Hirshleifer, Subrahmanyam, and Titman (1994),
We have additional evidence to suggest that mutual fund herding in Taiwan is
related to private information. We find that herd is formed more in more volatile
stocks. Since greater price change tends to contain more information (Barclay and
Warnwher (1993) and Chakravartys’ (2001)), we infer that herding is related to
information. Lakonishok, Shleifer, and Vishny (1992) provide similar empirical
evidence that there is slightly more herding in better-performing stocks.
Grinblatt, Titman, and Wermers (1995) found that 77% of mutual funds in their
sample used positive feedback strategy, buying stocks that were winners. However,
mutual funds did not sell stocks that were losers. Mutual funds that adopted this
kind of strategy had shown better performance. Specifically, mutual funds were
momentum investors on buy side and the herd behavior between them were related to
their trading strategy.
We find that the momentum strategy adopted by mutual funds in Taiwan is based
on private information about fundamentals, rather than merely as a result of fund
managers observing past returns, supporting Wermers’ (1999) view that herding is
mutual funds herded to buy was significantly higher than that before the herd, and
stock return after mutual funds herded to sell was significantly lower than that before
the herd. But the price change after sell herd was more pronounced than that after
buy herd.
Besides, mutual funds herded more on the buy side than on the sell side, although
the gap shrank with stock size. In addition, the buy herding measure was about the
same across stocks of different sizes. We interpret our results as mutual fund buying
stocks of all different sizes so as to profit from the up trend of the market and to avoid
deviating from the broad market in terms of performance.
In contrast, on the sell side the herd measure was significantly higher in large
stocks than in small stocks. This finding is different from Wermers’ (1999) finding
and Lakonishok, Shleifer, and Vishny’s (1992) finding that small stocks showed
relatively stronger degree of herding than large stocks, but is consistent with
Falkenstein’s (1996) finding and the analysis of Hirshleifer, Subrahmanyam, and
Titman (1994) and Froot, Scharfsten, and Stein (1992). Herding to sell large stocks
could have been a result of avoiding selling illiquid stocks facing redemption by
investors, which is similar to Falkenstein’s (1996) argument that mutual funds
avoiding buying small stocks to reduce transaction cost. It could also have been that
the herding on the sell side has more information content than that on the buy side.
In Taiwan, the price of small stocks is known to be easily manipulated by insiders.
It is reasonable for mutual funds to invest less of their research resources in small
stocks than in large stocks that are more transparent and whose price is less likely
manipulated. As a result, we find that the price change after sell herd was more
Our findings largely point to the important role of private information in mutual
funds herding. To further ascertain the importance of private information in the
formation of herding, we employ panel data analysis. We hypothesize that funds
with private information would trade relatively more than other types of traders. In
addition, if the information is privy to a small number of funds in the beginning and is
later revealed to other funds with time, then herding measure would be negatively
related to the ratio of funds participating in the trade to the total number of funds in
the market to begin with and become positively related with time. Finally, a large
fund should be more resourceful than a small fund and thus should have a larger
information advantage.
Our finding is consistent with our hypotheses. We find that the trading
volume of mutual funds relative to other types of traders was larger when herding
measure was greater. Herding measure was negatively related to the ratio of mutual
funds participating in the trade to the total number of funds available in the market in
high frequency sample, but is positively related in low frequency samples. Herding
measure was positively associated with the size of funds.
We also find that herding measure was positively associated with the turnover of
stock, the size of stock, and the market rate of return. It seems that mutual funds
were concerned with liquidity, had information advantage or correlates signals in
large stocks, and would trade with the market benchmark. Our findings are largely
consistent with those of Falkenstein (1996) that mutual funds prefer to trade stocks
with certain characteristics such as high visibility, high volatility, and low transaction
costs and the information acquisition model of Hirshleifer, Subrahmanyam, and
In addition to the information based explanations of herding in the literature, there
are theories of herding that do not invoke information as a reason for herding. For
example, mutual funds have a comparative advantage in holding some kinds of stocks
and, as a result, they collectively purchase them [Falkenstein (1996), Del Guercio
(1996), Gompers and Metrick (2001), Bennett, Sias and Starks (2003)]. As
discussed earlier, our findings also show that mutual funds in Taiwan have similar
preferences in holding the stocks.
Furthermore, mutual funds may herd because of window dressing. Fund
managers are typically evaluated once a quarter and mainly at the end of the year.
Therefore, they are wary of sharp fall offs in the net asset values per share (NAVs) of
their holdings appearing in their quarterly or annual reports. Thus, they are
unwilling to sell the winners and quick to sell the losers, in an attempt to nullify
mistakes. Furthermore, fund managers mark up their NAVs largely by purchasing
the stocks they already held, during the last few minutes of the quarter and at year end.
If everyone adopts the same dressing strategy, they seem to trade together, especially
at the end of the quarter and year (Lakonishok, Shreifer, Thaler, and Vishny (1991),
Wermers(1999), and Carhart, Kaniel, Musto, and Reed (2002)).
Another explanation for mutual funds herding that does not rely on the effect of
private information on mutual funds’ trading decision is the sharing-the-blame effect
of Scharfstein and Stein (1990). Managers may follow other managers’ trades
because of concerns over their reputation in case their overall performance is poor.
The mutual fund industry evaluates the managers based on their investment
performance and whether their action is similar to other managers. Accordingly, one
viewed as bad if others also make the same decision.
In Taiwan, mutual funds have to file their month-end stockholdings with the
Securities and Futures Commission, providing an excellent source of trading
information for investors. Managers may therefore ignore their private information
and follow the behavior of the previous investors because of reputational concerns.
This type of trading behavior would show a significantly high value of herding
measure shortly after the beginning of a period.
We employ cross-sectional test and the regime-switching model to test if herding
measure switches to a higher mean in the end of a calendar period to test the window
dressing hypothesis and if herding measure switches to a higher mean in the
beginning of a calendar period to test the sharing-blame-effect. The empirical
results do not show a higher mean in the beginning or in the end of a calendar period.
Neither do we find any regular regime switching pattern near the end of beginning of
a calendar period. Thus, our evidence does not support the window dressing
hypothesis or the sharing-blame-effect.
To sum, the balance of our findings suggests that mutual funds herding primarily
results from managers receiving information at stochastically different points of time.
Our conclusion mainly comes from the observation that herding measure intensifies
with sampling interval and herding is related to information. In addition, we also
find no sign of significant increase in herding measure after the inventory of mutual
funds have been revealed to the market in the beginning of the month. Thus, mutual
fund managers seemingly follow each others’ trade as a result of the sequential nature
of information acquisition and their delaying sequential reactions, rather than
Our explanation for herding is different from that of Sias (2004). He suggested
that herding is due to institutional investors inferring information from each other’s
trades (informational cascades). Sias analyzed adjacent quarterly inventories of
institutional investors and concluded that institutional investors’ demand for securities
of this quarter is related to their own and other investors’ inventories of last quarter.
Sias’ conclusion is a natural result of the limitation of his data. Since we find
that herding measure becomes greater as sampling interval lengthens, the inventory of
mutual funds obtaining information later in this period would certainly be related to
that of other funds obtaining information earlier in the previous period. Therefore,
there is no inherent difference between Sias’ and our findings. We are able to depict
a more accurate picture of herding because our data are finer than those of previous
studies. In contrast to existing studies that only observe quarterly stockholdings of
mutual funds, we were able to reconstruct the inventories of mutual funds over very
short holding periods using intraday data. Our methodology allows us to observe
herding behavior within much shorter time intervals as well as the evolution of
herding over time.
Our data include intraday transactions of all mutual funds over five years on the
Taiwan Stock Exchange (TSEC). Each transaction record contains the exact trade
time, trading volume and trade price of all traders involved. As a result, we are able
to test the herding behavior of mutual funds over various investment horizons, which
helps to uncover the reason behind the herding behavior of mutual funds.
The remainder of the paper is organized as follows. Section II discusses our
handling of data and test methodology. Empirical results are presented in Section III.
II. Data and Methodology
II.A. Data
Our data consist of all intraday transactions on the Taiwan Stock Exchange (TSEC)
from January 1995 to December 1999. For each transaction, we can identify the
stock code, the trade date and time (to hundreds of seconds), the trade price, the
number of shares transacted, and the identity of every buyer and seller involved in the
transaction. In order to protect traders’ privacy the TSEC replaced the true names of
traders with distinct codes, which allowed us to distinguish traders by investor type.
The Security Exchange Act of Taiwan requires all orders for stocks listed on the
TSEC to be matched on the TSEC. Since there is no third market or fourth market,
our data set is complete in the sense that all transactions on stocks listed on the TSEC
are included in our data set. Typically, a money manager in the United States (U.S.)
can manage more than one fund. However, during our sample interval in Taiwan a
manager can only manage one fund. Thus, unlike Lakonishok, Shreifer, and Vishny
(1992), our analysis is done on the level of the fund rather than the fund manager.
Table I presents summary statistics of our data on mutual funds. Panel A shows
the number of funds in the database and the summary statistics of the stocks that
funds traded. From 1995 to 1999 the number of funds increased from 71 to 175 and
a marked increase was also seen in number of funds trading stock during each trading
interval. Panel B presents the summary statistics of the number of stocks traded by
mutual funds. The number of stocks increased from 347 in 1995 to 445 in 1999.
Despite the increase in the number of funds and stocks during the years, the average
The decreasing trend from 1996 we believe occurred as result of the commencement
of the Bear market in Taiwan in 1996 and perhaps is an indication of mutual funds’
increasing concentration on similar stocks.
Panel C shows the frequency table of stocks traded by funds during the first
quarter, the first month, and the first day of the year. During the first quarter and the
first month, the number of stocks traded by one or more funds increased during the
period 1995 to 1999, in line with the increasing number of mutual funds. However,
when we convert the number to the percentage of all TSEC stocks, the highest value
occurs in the year of 1997 for stocks traded by 1 or more funds up to 20 or more
funds. But for stocks traded by 30 or more funds up to 100 or more funds, the
highest value occurs in the year of 1999. For the first day of the year, there is an
unusual large number of stocks traded and a high value of percentage in the year of
1995. Mutual funds showed a strong tendency to trade different stocks during the
first trading day of 1994, but not so in the following years, indicating that with
experience fund managers tend to narrow their targets at the beginning of the year as
the number of funds and stocks grew.
Insert Table I here
II.B. Measurement of Mutual Fund Herding
Herding refers to any mass movement toward trading a particular stock
irrespective of the reason. Following Lakonishok, Shreifer, and Vishny (1992) and
Wermers (1999), we provide a measure of herding for various investment periods.
t t i t t i t i t i t i t i t i t i t i t i P P E P P P E P E P E P AF P E P HM − − − = − − − = − − = . . , . , . , , . , ) ( ) ( ) ( (1)
∑
∑
∑
= = = + = + = n i t i n i t i n i t i t t i t i t i t i S B B P S B B P 1 , 1 , 1 , , , , ,where Bi,t is the number of funds that increase their holdings in stock i during
period t (net buyers), Si,tis the number of funds that decrease their holdings in stock i
during period t (net sellers), n is the number of stocks traded by funds during period t,
and Pi,t is the proportion of net buyers of stock i to all funds trading stock i during
period t. We use the proportion of net buyers to all stocks traded by funds during
period t as a proxy for E(pi,t), the expected buy ratio of mutual funds. The
adjustment factor (AF) is the expected value of | pi,t –pt| under the null hypothesis of
no herding. Since Bi,t follows a binominal distribution, we can calculated AF as
( )
t i t i t i N j t t i j N t j t N j t t i t i S B N P N j P P C P P E AF t i t i t i , , , 0 , , , , , , 1 + = ⎥ ⎥ ⎦ ⎤ ⎢ ⎢ ⎣ ⎡ − × − = − =∑
= −Furthermore, we use an additional herding measure developed by Wermers (1999)
to distinguish between buy herding and sell herding. Buy herding measure for stock
i, BHMi,t, is conditional on the proportion of funds trading stock i on the buy side
Likewise, the sell herding measure for stock i, SHMi,t, is conditional on the proportion
of funds trading stock i on the sell side being lower than the average proportion
across stocks during the same period. Their mathematical expressions are as
follows: t t i t i t i t t i t i t i P P HM SHM P P HM BHM < = > = , , , , , ,
II.C. Regime Switching Model
Regime switching models are designed to capture changes in the economic
system from which the data are derived. We use Hamilton’s (1988, 1989) regime
switching model to describe and analyze the dynamics of mutual fund herding
behavior.
Hamilton’s regime switching models have gained increasing popularity in the past
decade with ever wider applications. These regime switching models build on the
standard AR (autoregressive) and ARCH (autoregressive conditional heteroscedastic)
models and allow some of the parameters to change in a discrete fashion over time.
For example, the mean µ of a time series yt may change across the J possible
valuesµ1,µ2,...,µJ over time. In such a case it is convenient to denote the mean parameter as
t S
µ , where st is an unobservable discrete random variable that takes the
values: 1,2,…,J, indicating one of the J possible regimes. The corresponding
density function of yt, being dependent on the regime indicator st, can be written
as f(yt |st,Yt−1), where Yt−1 ={yt−1,yt−2,yt−3,...} represents the information set containing all the past observations on yt. By assuming st to be a random variable
with conditional regime probabilitiespjt ≡P(st = j|Yt−1), for j=1,…,J, we can obtain the marginal density f(yt |Yt−1) by integrating the unobservable random variable st
with the joint density f(yt |st = j,Yt−1). It is the resulting marginal density )
| (yt Yt−1
f that is used to construct the likelihood function for the maximum likelihood estimation. As to the specification of the conditional probabilities pjt of
the regime indicator st, it has become quite common to assume that st follows a
first-order Markov chain: P(st = j|st−1 =i,st−2 =k,...,Yt−1)=P(st = j|st−1 =i) (which are referred to as transitional probabilities). Using this assumption, it is
straightforward to recursively calculate pjt, for all j = 1,…,J, and t = 1,…,T, where T
. Empiric
Ⅲ al Results
III.A. Informational cascades vs. investigative herding
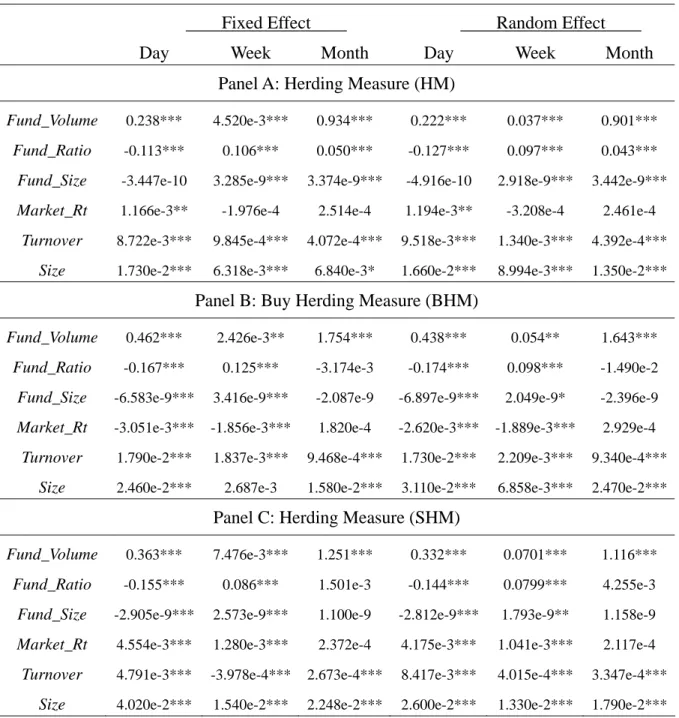
The herding measures, HM, BHM, and SHM, as shown in the following results,
are computed over all stocks in varying frequencies (15 minutes, 30 minutes, hourly,
daily, weekly, monthly, and quarterly) and for various number of funds trading the
stocks (traded by at least 3, 4, 5, 6, 10, 15, 20, 25, 30, 35, 40 funds).
Figure 1 presents herding of mutual funds exhibited by our sample. The average
herding measure for the quarterly frequency is 0.100, which is much higher than the
0.027 reported by Lakonishok et al. (1992) and the 0.034 by Wermers (1999),
suggesting that there is strong herding among mutual funds in Taiwan. Furthermore,
we looked at the herding measure over the quarterly, monthly, and weekly frequencies.
We found the average of quarterly, monthly, and weekly herding measures to be
above 0.079 and that it increased as the numbers of funds traded increased. In the
frequency of intraday, the average herding measure is above 0.030 and behaves
similar to the pattern for the longer frequencies when fewer than 15 funds trade.
Herding is more likely when a large number of funds trade the same stock, implying
that a bigger group of funds trading the same stock makes a stronger herd.
The findings above seem to suggest that informational cascades are at work. If
mutual funds herd as a consequence of investigative herding (following the same
observable signals), there should be a large number of funds herding within a short
period of time. Our result, however, shows that a small number of funds herd in the
decreases. For example, quarterly herding measure is noticeably greater than daily
herding measure. Thus, it means that herding is not a short process; it takes a long
time for a large group of funds to have behaved similarly.
In addition, in the case that the number of funds trading the same stock is below
15, herding is noticeable across all frequencies. But as the number of funds
increases over 20, the hourly herding measure drops from 0.101 to 0.025, albeit the
quarterly measure remains as high as 0.108. This finding suggests that the number
of funds herding increases as sampling frequency decreases. Therefore, our initial
evidence indicates that mutual funds herd as a result of informational cascades rather
than investigative herding.
Insert Figure 1 here
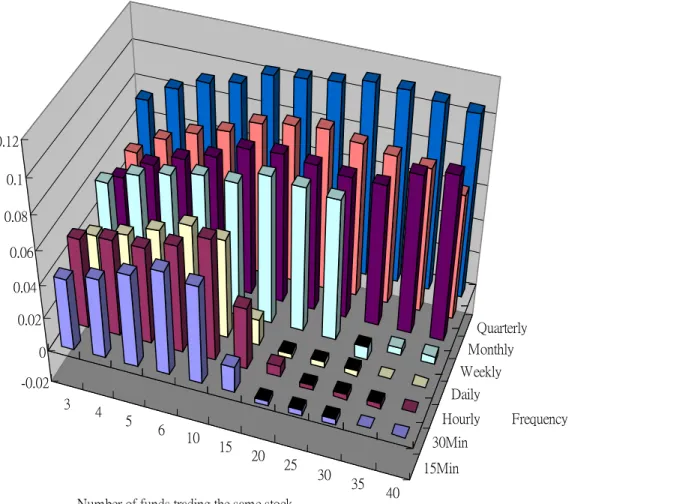
The message conveyed in Figure 2 is consistent with the evidence shown in figure
1. Figure 2 shows the percentage of observations available in various frequencies
and for different numbers of funds trading the same stock. In our sample sometimes
herding measure for a certain number of funds trading the same stock cannot be
calculated, which would result in a missing observation. The missing-observation
problem happens more frequently in higher frequency samples because there are
fewer funds trading the same stock within a shorter period of time. We find that the
higher is the sampling frequency, the fewer are the herding measure observations. If
mutual funds herd due to investigative herding, the number of herding measure
observations should be quite even across different classifications of number of funds
trading the same stock and sampling frequencies. However, Figure 2 shows that the
number of herding measure observations decreases with the number of funds trading
available observations drops from 93.8% for 3 funds trading the same stock to almost
0% for over 20 funds trading the same stock in the hourly frequency. And for the
case where 20 funds trading the same stock there are very few herding measure
observations in the frequencies less than (including) daily. It seems that unlikely
mutual funds herd for the reason of investigative herding.
Insert Figure 2 here
III.B. Mutual funds herding is contemporaneously associated with private information
Informational cascades imply that some mutual funds have information earlier
than others and it is worthwhile for mutual funds to ignore their own noisy
information as well as to infer information from each other’s trades. Thus,
informational cascades imply that herding should have information content. We
now examine whether or not herding is associated with private information on the
part of mutual funds.
Barclay and Warner (1993) and Chakravartys’ (2001) argue that traders tend to
have private information during the period that displays significant price increases.
Hence, we posit that mutual fund herding is more likely to occur in stocks with larger
price increase or larger price decrease. We begin our analysis by dividing stocks
into two groups: (1) those having price increase and (2) the others experiencing price
decrease over a period of time. Then we sort stocks into eight portfolios by the
magnitude of price increase and decrease, respectively. The first portfolio for price
decrease (D1) contains the stocks experiencing the greatest magnitude of price
decrease. We repeated the procedure with the price increase subgroup. The first
portfolio for increase (I1) contains the stocks experiencing the greatest magnitude of
price increase, and the last portfolio (I4) contains the stocks with only a little price
increase.
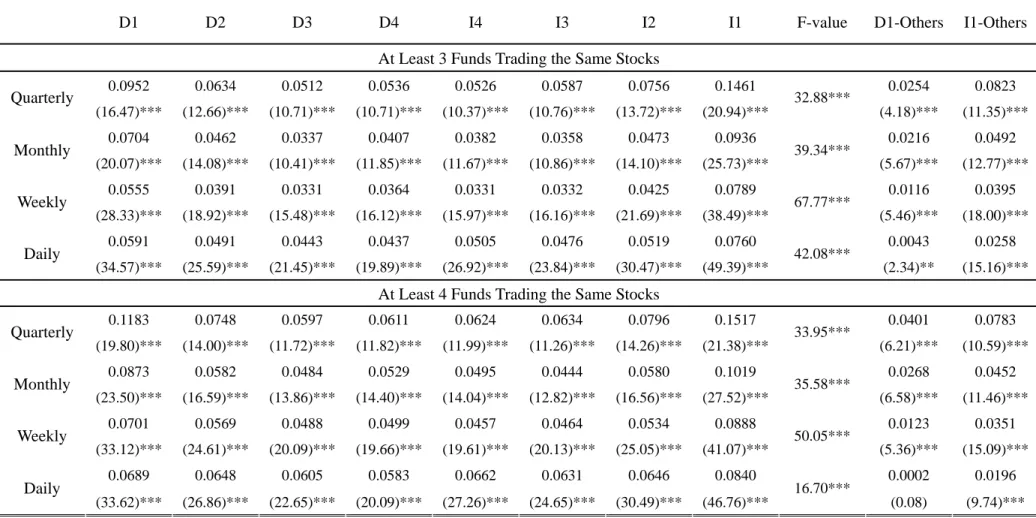
Figures 3-1 to 3-4 and Table II present the herding measures in different
frequencies (daily, weekly, monthly, and quarterly) for eight portfolios from D1 (the
largest price decrease) to I1 (the largest price increase). Figures 3-1 to 3-4 present
the cases for 3, 4, 5 and 6 mutual funds trading the same stock. All four figures
reveal a U-shaped pattern across different sampling frequency. Both most price
decreasing and most price increasing portfolios have highest herding measures. In
addition, similar to the phenomenon in Figures 1 and 2, the herding measure increases
as sampling frequency lengthens. The finding is consistent with the hypothesis that
mutual funds herding is associated with private information and informational
cascades have information contents.
Insert Figures 3-1 to 3-4 here
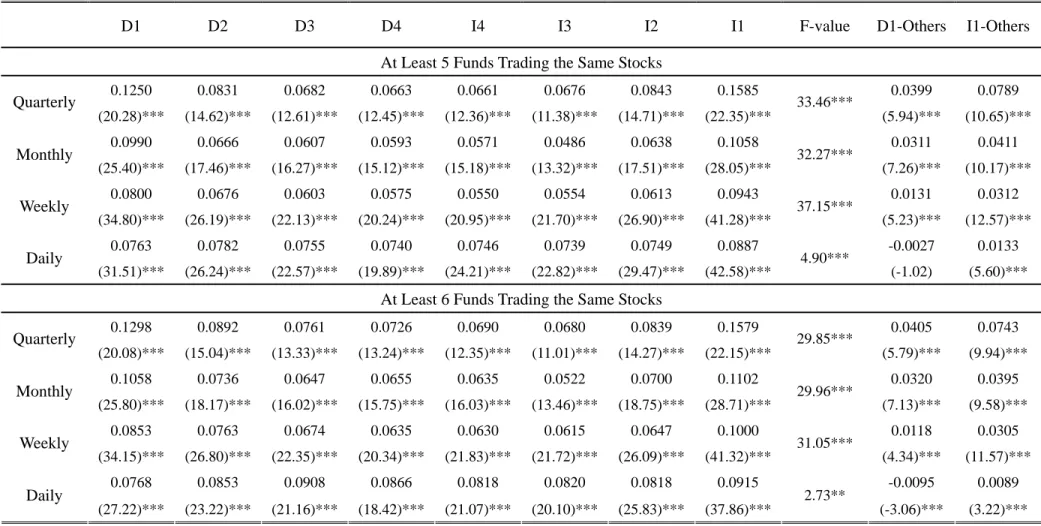
Table II shows the herding measure of the eight portfolios from D1 to I1 in
different sampling frequencies and for different numbers of mutual funds trading the
same stock. The third column to the right of Table II shows that the mean herding
measure of the eight portfolios is significantly different. All F-test statistics except
in one case are statistically significant at the 1% level. The second (first) column to
the right of Table II shows difference in mean herding measure between portfolio D1
(I1) and other seven portfolios. Thus, the herding measure of the eight portfolios is
significantly different. This is the case for different sampling frequencies and
Insert Table II here
III.C. Mutual funds herding is associated with past stock returns and has information content for future stock returns
Earlier we showed that mutual funds herding was contemporaneously positively
related to the volatility of stock price, which helped us to infer that herding is
associated with information. Here we would like to investigate if future stock return
is associated with past herding, which would enable us to further substantiate our
assertion that mutual funds herding has information content.
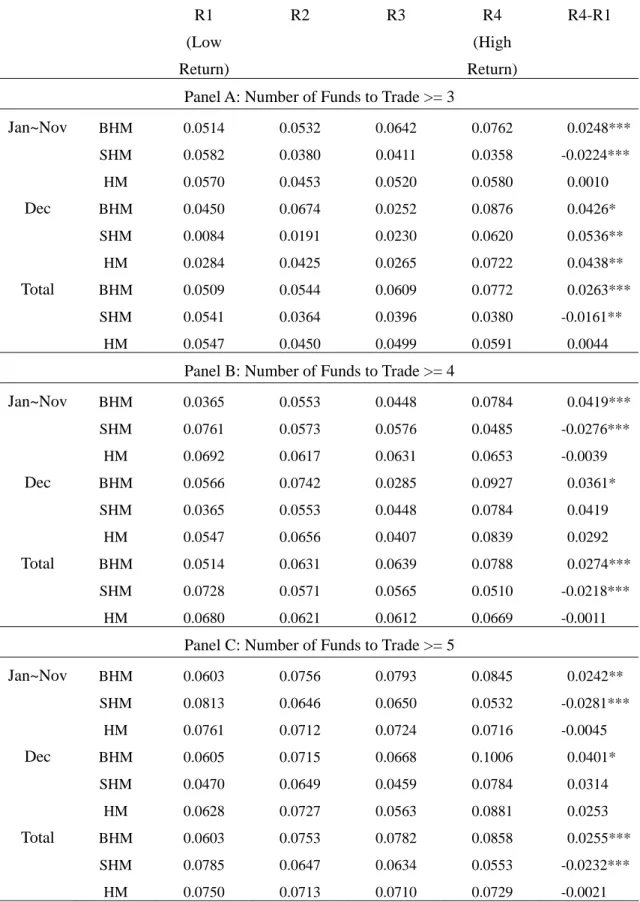
To conduct our analysis, we classify stocks into four portfolios according to the
magnitude of change in stock price of last month. We then calculate the mean of the
monthly herd measure of the stocks in one of the four portfolios. Table III reports
the mean herd measure of each portfolio. In Table III R1 is the portfolio composed
of stocks that experienced the lowest rate of return. The rate of return of the stocks
in portfolios 1 through 4 is in ascending order. Thus, portfolio R4 contains stocks
that experienced the highest rate of return.
Depending on the side of trade herd measure is the highest either in the lowest or
the highest prior-month return quintiles. On the buy side, herd measure is
significantly higher in the highest prior-month return stocks than in the lowest ones,
indicating that mutual funds herd to buy past winners. On the sell side herd measure
is significantly lower in the highest prior-month return stocks than in the lowest ones,
suggesting that mutual funds herd to sell past losers. Thus, our results suggest that
losers.
Insert Table III here
Momentum trading may be a result of information advantage rather than strategy
per se. To explore this issue, we examine the relation between herding and past,
contemporaneous, and future stock returns. If momentum trading has information
content, contemporaneous and especially future returns ought to be significantly
positively associated with buy herd measure and significantly negatively associated
with sell herd measure.
We divide the stocks traded by at least five funds during a given quarter into two
groups: (1) that having the higher proportion of funds buying the same stock than the
average proportion across stocks and (2) that having the higher proportion of funds
selling the same stock than the average proportion across stocks. We then sort
stocks by BHM and SHM, respectively, and form corresponding buy and sell
portfolios. The first buy portfolio (B1) contains the stocks that funds are strongest
to herd in purchase, and the last buy portfolio (B5) contains the stocks with only a
little greater proportion of buyers than average across stocks. We repeated the
procedure with the sell portfolios. The first portfolio (S1) contains the stocks that
funds are strongest to herd in sell, and the last one (S5) contains the stocks with only
a little greater proportion of sellers than average across stocks.
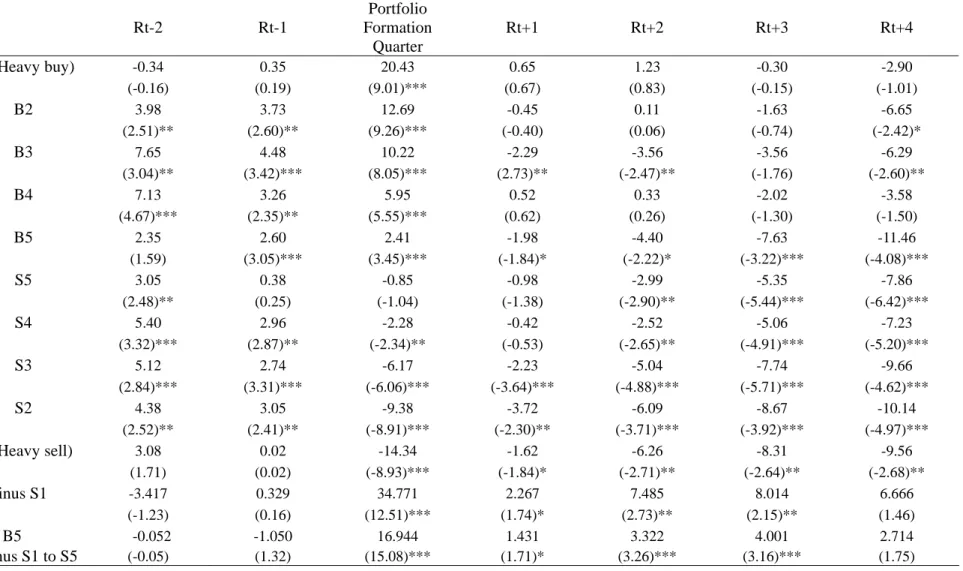
Next, we calculate each of these ten portfolios’ size-adjusted, equally-weighted,
abnormal quarterly returns during the previous two quarters, the formation quarter
(the quarter in which quarterly herd measure is calculated), and the following year.
size and form 10 size decile portfolios. We then subtract, from the quarterly return
of each stock in the portfolio, the quarterly return of the equal-weighted portfolio of
all TSEC stocks which belong to the same size decile as that stock at the beginning of
the quarter. Table IV presents the results for the ten portfolios from B1 to S1. The
average size-adjusted abnormal returns of portfolio B1 (B1 to B5) through formation
to the next 9 months are significantly higher than those of portfolio S1 (S1 to S5),
indicating that stocks with strong buy herd outperform those with strong sell herd.
Thus, momentum trading seems to contain some information content. Thus, it is
possible momentum trading is a result of private information advantage rather than
just an artifact of trading strategy.
However, Table IV also shows that momentum trading on the sell side has more
information content than that on the buy side does. On the buy side, significant
positive returns are observed only during the formation period. In contrast,
significant negative returns are pervasive both during the after the formation period
and stay significant for as long as one year thereafter. This phenomenon suggests
that mutual funds herding tend to be related to private information more on the sell
side than on the buy side.
Insert Table IV here
The results reported in Table IV are based on analysis in quarterly frequency. It
is possible that momentum trading can be observed in higher frequencies. In the
following we analyze if momentum trading has information content even in the
higher frequency samples. This analysis is meaningful because the duration of
mutual funds’ information advantage may be so short that what we observe in the low
it is also possible that the information advantage of mutual funds may last only long
enough to appear in the higher frequency data. Figure 4 shows the cumulative
size-adjusted abnormal portfolio returns for the monthly frequency for the heavy buy
portfolio (B1) and the heavy sell (S1) portfolio from one year before the formation
month until one year after it. Mutual funds that herd to buy (sell) stocks heavily
have positive (negative) cumulative size-adjusted abnormal returns in the formation
month and the following 12 months.
The figure also shows that mutual funds herd to buy the sharp appreciated stocks
and to sell the sharp depreciated stocks over the previous month. In the case of
heavy herd on the buy side, momentum trading seems to be a continuation of a long
up trend of stock price but the ensuing abnormal return is most obvious only in the
formation month. The cumulative abnormal return gains only a little in the first
month after the formation period and start to decline after the second month. This
indicates that when mutual funds herd on the buy side, they catch the tail end of a
trend and thus do not seem to possess too much information advantage.
In contrast, in the case of heavy herd on the sell side, momentum trading seems to
start soon after a sharp turn in the stock price and the ensuing abnormal return persists
throughout the year after the formation month. The cumulative abnormal return
continues to become more negative with time (meaning that mutual fund that sell in
the formation period make significant profits). This indicates that when mutual
funds herd on the sell side, they time the market very well and thus seem to possess
impressive information advantage.
The results for the daily frequency are depicted in Figure 5, which, although
cumulative size-adjusted abnormal daily returns for the heavy buy portfolio (B1) and
the heavy sell (S1) portfolio from 60 days before until 60 days after the formation day
are shown. Even in the daily frequency there is an obvious sign of momentum
trading.
The stocks mutual funds herd strong to buy persistently and significantly
outperform those mutual funds strong herd to sell over the following 60 days.
Mutual funds herd to buy the sharp appreciated stocks over the previous month and to
sell the sharp depreciated stocks over the previous few days. The return for the
strong buy herd portfolio substantially increased during the month prior to the
formation day and that for the strong sell herd portfolio sharply decreased during the
seven days prior to the formation day. In the case of heavy herd on the buy side,
momentum trading seems to be a continuation of a long up trend of stock price but
the ensuing abnormal return is most obvious only in the formation day and two days
afterwards. The cumulative abnormal return gains substantially only in the first two
days after the formation day and picks up small marginal gains thereafter throughout
the 60-day period. This indicates that mutual funds adopt short-term momentum
strategy on the buy side but they catch the tail end of a trend and thus do not seem to
possess too much information advantage.
In contrast, in the case of heavy herd on the sell side, short-term momentum
trading seems to start soon after a sharp turn in the stock price and the ensuing
abnormal return persists throughout the 60-day period after the formation day. The
cumulative abnormal return continues to become more negative with time (meaning
that mutual fund that sell in the formation day make significant profits afterwards).
well and thus seem to possess impressive information advantage.
In sum, our findings suggest that the momentum strategy adopted by mutual funds
in Taiwan is based on private information about fundamentals, rather than merely a
result of fund managers observing past returns, supporting Wermers’ (1999) view that
herding is highly related to “rational” positive feedback trading strategies.
Insert Figures 4 and 5 here
III.D. Mutual funds herding and the size of stocks
In the literature there is a pervasive view that the amount of information available
to investors has bearing on the market capitalization (size) of stock. For example,
Falkenstein (1996) and Wermers (1999) suggest that fund managers receive lower
precision earnings information from small companies. In addition, larger firms tend
to be followed by more analysts and thus it is easier for investors to acquire the
information about larger firms.
Mutual funds in Taiwan tend to have higher information advantage in the stocks
of large size than in the stocks of smaller size, and they have information advantage
in stocks of all sizes for two reasons. On one hand, mutual funds employ many
analysts to do research on listed firms. The sole purpose of the research is for
in-house investment advice for fund managers. The vast resources of a mutual fund
company make its analysts very effective in analyzing available information. On the
other hand, fund companies generally manage many funds at the same time. The
total fund size is big enough for the management of listed firms to be concerned about
approached by mutual fund managers, listed companies tend to be cooperative in
providing privileged information.
Empirical evidence regarding the relation between stock size and herding is not
conclusive. Wermers (1999) finds that herds form much more often on the sell side
than on the buy side in trades of small stocks, but that levels of buy-side and sell-side
herding are roughly equivalent among larger stocks. Falkenstein (1996) finds that
mutual funds show an aversion to small firms to avoid stocks with little information.
Sias (2004) reports that institutional herding results from institutions inferring
information from each other’s trades in small stocks.
In this section we examine if mutual funds herding is related to the size of stock.
Stocks are categorized into four portfolios based on their size. Portfolios S1 to S4
contain stocks in ascending size. We then calculate the mean herding measure of
stocks in a portfolio. Table V presents the mean monthly buy and sell herding
measure of the four size portfolios for different numbers of funds trading the same
stock. Herding measures for other sampling frequencies are qualitatively similar.
We find that herding measure is in general higher on the buy side than on the sell
side, but the gap between the herding on the buy side and the sell side shrinks with
the size of stocks. The gap is practically zero for the largest-size portfolio. That
herding on the buy side and sell side is about the same for the large portfolios is
similar to Wermers’ (1999) finding. In addition, although buy herding measure is
somewhat larger in small stocks than in large stocks, it is about the same across
different size portfolios. This is also similar to Wermers’ (1999) finding. These
two pieces of evidence combined suggest that mutual funds tend to buy a broad
market in general. That fund managers tend to herd on the buy side more than on
the sell side across different sizes of stocks is consistent with the nature of mutual
funds being in the business of profiting on the upside of the stock market.
However, there is a significantly higher level of herding in large stocks than in
small stocks in the sell measure, which is different from the finding of Wermers (1999)
but is consistent with that of Falkenstein (1996). Herding to sell large stocks could
be a result of avoiding selling illiquid stocks facing redemption by investors
(Falkenstein (1996)). It also could be that mutual funds have information advantage
on large stocks relative to small stocks (Wermers (1999)). In Taiwan, the price of
small stocks is known to be easily manipulated by insiders. It is reasonable for
mutual funds to invest less of their research resources in small stocks than in large
stocks that are more transparent and thus price manipulation is less likely. Finally,
the pattern in December is similar to that in January through November.
Insert Table V here
III.E. Herd is formed by mutual funds with information advantage
So far we have collected some evidence that mutual funds herding is due to
private information. Here we would like to investigate this issue further by testing
cross-sectionally if herd is formed by funds that have information advantage. We
employee panel data regression to analyze the relationship between herding measure
and proxies for the extent of mutual funds’ information capability: ratio of mutual
funds’ trading volume to total trading volume (Fund_Volume), ratio of the number of
Taiwan, average fund size of mutual funds trading the stock (Fund_Size).
If mutual funds herd on information during a period of time, they should trade
relatively more than other investors. That is the fraction of mutual funds’ trading
volume should be positively correlated with herding measure. Moreover, if some
funds have private information that others do not possess, then we would expect these
few information-privileged funds to trade shortly after acquiring the information, over
time, as the information is gradually released to other funds, a larger number of funds
should herd over the longer time frame. That is the coefficients associated with
Fund_Ratio should be negative in the short time and positive over the longer time
frames.
We also hypothesize that the larger the size of fund, the more information
advantages it has. That is, a bigger fund may have more resources and analysts to
pursuit corporate information. Thus it has more opportunities to exploit any private
information advantages. So we use fund size to proxy for the extent of mutual
funds’ private information advantage.
Three control variables are included in the regression. The logarithm of market
returns (Market_Rt) proxies for fund managers’ preference to trade based on a market
wide benchmark. The turnover rate of the stock that funds trade (Turnover) and the
market size of the stock (Size) proxy the preferences of funds’ holdings as suggested
by Falkenstein (1996). Regression analysis is done for herding measure, buy
herding measure and sell herding measure, respectively, as shown in the following.
1 2 3 4 5 6 ( _ ) ( ) ( _ ) ( or ) ( _ ) ( ) ( _ ) it i it it it it it t it it it
HM Fund Volume C Fund Size BHM SHM Market Rt Turnover Stock Size
α β β β
β β β ε
= + + + +
We use two models of panel data regression: (1) the fixed model takes αi to be a group-specific constant term in the regression and αi does not vary over time, (2) the random effects model specifies that αi is a group specific random element. We employ the analysis for different sampling frequencies, daily, weekly, and monthly, in
hope of gaining more insights on the relation between herding measure and
information.
In the panel data analysis for the daily frequency, there are 402 securities over
1,389 days, a total of 558,378 observations. There are 431 (441) securities over 256
weeks (60 months), a total of 110336 (26460) observations in the weekly (monthly)
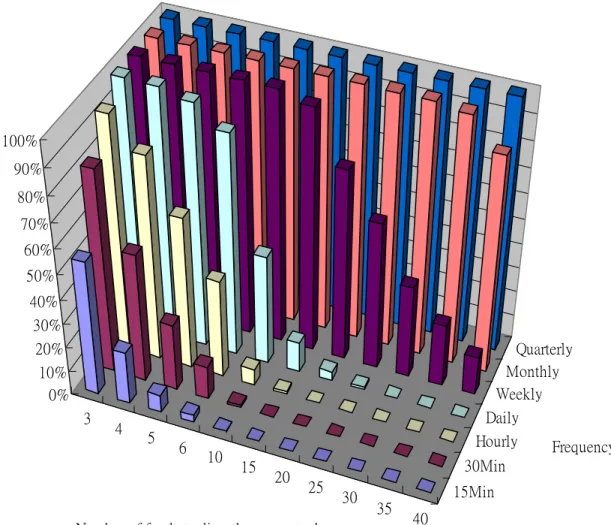
frequency. Regression results for HM, BHM, or SHM are reported in panels A-C of
Table VI.
Insert Table VI here
Consistent with what we expect, the coefficients associated with variable
Fund_Volume are all significantly positive across the fixed effects and random effects
models for the three sampling frequencies (daily, weekly, or monthly) in Panels A-C.
This means that when mutual funds herd more heavily, their trading volume is also
heavier relative to other traders.
Moreover, Table VI reveals that the coefficient of Fund_Ratio is significantly
negative for the sample of daily frequency but significantly positive for the samples
of weekly and monthly frequency. This means, in the beginning relatively few
funds participate in the trading of a stock. With time more and more funds
Consistent with our findings above, Table VI shows that fund size is positive
correlated with the herding measure for the weekly and monthly sampling frequencies,
supporting the hypothesis that herd is formed by funds with information advantage.
However, fund size is either statistically insignificant or significantly negative in the
sample of daily frequency.
The coefficients associated with the control variable Market_Rt are generally
significantly positive for the buy herding measure and significantly negative for the
sell herding measure, suggesting that fund managers would try to follow the
benchmark some what. This is consistent with the reputational hypothesis.
Consistent with the findings of Falkenstein (1996), mutual funds display
preference in trading the liquid and large stocks. The coefficients associated with
Turnover and Size are all significantly positive, implying that fund managers have a
comparative advantage in holding stocks with low transaction cost and large size.
III.F. Herding does not seem to be induced by window dressing
Table VII depicts herding measure for different sub-periods: the first, middle, and
the last number of days of the month. Panels A through E are the results for
different number of days (5, 4, 3, 2, and 1) in the first and last sub-periods of the
month. The middle period represents the remaining days of the month. F-test does
not indicate that there is significant difference in the herding measures of the three
sub-periods. Thus, Table VII does not support the window dressing hypothesis.
That is, mutual funds do not seem to dispose of losers simultaneously to patch up
Insert Table VII here
III.G. Herding does not seem to be induced by following the leader
We also examine the “follow the leader” and “window dressing” hypotheses by
adopting a Hamilton’s regime switching model to gauge whether herding behavior
changes as mutual funds follow the leader or conduct window dressing during the
beginning or the end of the month, the quarter and the year. Our empirical analysis
shows no such pattern of regime switching in the herding behavior of mutual funds.
Thus, mutual fund herding does not appear to be caused by follow the leader strategy
. Conclusion Ⅳ
This paper investigates the herding behavior of mutual funds in Taiwan. We find
much higher levels of herding among mutual funds in Taiwan than in the US (See
Lakonishok et al. (1992) and Wermers (1999)). Our empirical analysis suggests that
mutual funds herd mainly because they possess private information and they obtain
information sequentially. At the beginning of a herding event, only a few funds are
involved. Gradually other funds join as private information is revealed to them.
This type of herding behavior cannot be observed in the existing literature mainly
because that previous studies only observe funds’ stockholdings at the end of a
quarter. We provide evidence to substantiate Sias’s (2004) view that herding
behavior is specific to institutional environment.
However, Sias concluded that institutional investors herded because they ignore
their private information and infer information from each other’s trade. Although
on the face our explanation for herding is inconsistent with that of Sias, in essence our
result embraces his conclusion because he only observed quarterly data. Since we
find that herding measure becomes greater as sampling interval lengthens, the
inventory of mutual funds obtaining information later in this period would certainly
be related to that of other funds obtaining information earlier in the previous period,
which makes mutual funds look like they mimic each others’ trade. Therefore, there
is no inherent difference between Sias’ and our findings. We are able to depict a
more accurate picture of herding because we were able to reconstruct the inventories
REFERENCES
Avery, Christopher, and Peter Zemsky, 1998, Multidimensional uncertainty and herd behavior in financial markets, American Economic Review 88, 724-748.
Banerjee, Abhijit, 1992, A simple model of herd behavior, Quarterly Journal of
Economics 107, 797-817.
Barclay, Michael J. and Jerold B. Warner, 1993, Stealth trading and volatility: Which trades move prices? Journal of Financial Economics 34, 281-305.
Bennett, James A., Richard W. Sias, and Laura T. Starks, 2003, Greener pastures and the impact of dynamic institutional preferences, Review of Financial
Studies 16, 1203-1238.
Bikhchandani, Sushil, David Hirshleifer, and Ivo Welch, 1992, A theory of fads, fashion, custom, and cultural change as informational cascades, Journal of
Political Economy 100, 992-1026.
Carhart, Mark, 1997, On persistence in mutual fund performance, Journal of
Finance 52, 57-82.
Carhart, Mark M., Ron Kaniel, David K. Musto, and Adam V. Reed, Leaning for the tape: Evidence of gaming behavior in equity mutual funds, Journal of
Finance 57, 661-693.
Chakravarty, Sugato, 2001, Stealth-trading: Which traders’ trades move stock prices? Journal of Financial Economics 61, 289-307.
Chan, Louis K. C., Narasimhan Jegadeesh, and Josef Lakonishok, 1996, Momentum strategies, Journal of Finance 51, 1681-1713.
Chevalier, Judith, and Glenn Ellison, 1999, Are some mutual fund managers better than others? Cross-sectional patterns in behavior and performance, Journal of
Finance 54, 875-899.
Chow, Edward H. and Yi-Wen Chen, 2002, The Bias in the calculation of the rate of return and the benchmark error problem associated with not adjusting the Taiwan Stock Exchange market weighted index for cash dividend, Review of
Copeland, T. and D. Mayers, 1982, The value line enigma (1965-1978): A case study of performance evaluation issues, Journal of Financial Economics 10, 289-321.
Culter, D. M., J. M. Porterba, and L.H. Summers, 1990, Speculative Dynamics and the Role of Feedback Traders, AEA Papers and Proceeding 80, 63-68.
Daniel, Kent, Mark Grinblatt, Sheridan Titman, and Russ Wermers, 1997, Measuring mutual fund performance with characteristic-based benchmarks,
Journal of Finance 52, 1035-1058.
Del Guercio, Diane, 1996, The distorting effect of the prudent-man laws on institutional equity investment, Journal of Financial Economics 40, 31-62.
Falkenstein, Eric G., 1996, Preferences for stock characteristics as revealed by mutual fund portfolio holdings, Journal of Finance 51, 111-135.
Ferri, M. C. and R. L. Roenfeldt, 1984, Market timing and mutual fund portfolio composition, Journal of Financial Research, 143-150.
Froot, Kenneth A., David S. Scharfstein, and Jeremy C. Stein, 1992, Herd on the street: Informational inefficiencies in a market with short-term speculation,
Journal of Finance 47, 1461-1484.
Gompers, Paul A., and Andrew Metrick, 2001, Institutional investors and equity prices, Quarterly Journal of Economics 116, 229-260.
Grinblatt, Mark, and Sheridan Titman, 1989, Mutual fund performance: An analysis of quarterly portfolio holdings, Journal of Business 62, 394-415.
Grinblatt, Mark, Sheridan Titman, and Russ Wermers, 1995, Momentum investment strategies, portfolio performance, and herding: A study of mutual fund behavior, American Economic Review 85, 1088-1105.
Hamilton, James D., 1988, Rational expectations econometric analysis of changes in regimes: An investigation of the term structure of interest rates, Journal of
Economics Dynamics and Control 12, 385-423.
Hamilton, James D., 1989, A new approach to the economic analysis of nonstationary time series and the business cycle, Econometrica 57, 357-384.
Hirshleifer, David, Avanidhar Subrahmanyam, and Sheridan Titman, 1994, Security analysis and trading patterns when some investors receive information before others, Journal of Finance 49, 1665-1698.
Jensen, M. C., 1986, The performance of mutual funds in the period, Journal of
Finance 23, 1945-1964.
Kraus, Alan and Hans R. Atoll, 1972, Parallel trading by institutional investors,
Journal of Finance and Quantitative Analysis 7, 2107-2138.
Lakonishok, Josef, Andrei Shleifer, Richard Thaler, and Robert W. Vishny, 1991, Window dressing by pension fund managers, American Economic Review 81, 227-231.
Lakonishok, Josef, Andrei Shleifer, and Robert W. Vishny, 1992, The impact of institutional trading on stock prices, Journal of Financial Economics 32, 23-44.
Wermers, Russ, 1999, Mutual fund herding and the impact on stock price, Journal
of Finance 54, 581-622.
Wermers, Russ, 2000, Mutual fund performance: an empirical decomposition into stock-picking talent, style, transaction costs and expenses, Journal of Finance 55, 1655-1695.
Scharfstein, David S., and Jeremy C. Stein, 1990, Herd behavior and investment,
American Economic Review 80, 465-479.
Sharp, W. F., 1966, Mutual fund performance, Journal of Business 39, 119-138.
Sias, Richard W., 2004, Institutional herding, Review of Financial Studies 17, 165-206.
Sias, Richard W., and Laura T. Starks, 1997, Return autocorrelation and institutional investors, Journal of Financial Economics 46, 103-131.
Treynor, J. L., 1965, How to rate management of investment funds, Harvard
Table I
Summary Statistics of Mutual Funds’ Trading Activities
Year 1995 1996 1997 1998 1999
Panel A: Fund Counts
Number of funds 71 87 106 145 175
Average number of funds trading the same stock, average across stocks
per day 1.8 (1) 2.1 (2) 2.1 (1) 2.2 (1) 2.8 (1) per week 3.4 (2) 4.3 (3) 4.4 (3) 4.3 (2) 5.6 (2) per month 6.5 (3) 8.3 (5) 8.2 (4) 8.3 (3) 10.8 (3) per quarter 10.1 (5) 12.7 (8) 12.5 (7) 13.5 (6) 16.5 (4) per year 15.9 (9) 21.5 (14) 21.8 (14) 24.6 (12) 27.7 (8)
Panel B: Stock Counts
Number of stocks traded by funds 347 375 400 434 445
Percent of all TSE stocks 100 98.17 99.01 99.31 96.32
Average number of stocks traded per fund per day 5.8 (1.67) 7.5 (1.96) 5.9 (1.46) 4.5 (1.03) 4.4 (0.95) per week 14.8 (4.27) 19.6 (5.13) 15.7 (3.89) 11.2 (2.56) 11.2 (2.42) per month 31.8 (9.16) 40.5 (10.60) 33.7 (8.34) 26.6 (6.09) 25.6 (5.54) per quarter 51.7 (14.90) 62.4 (16.34) 52.1 (12.90) 44.6 (10.21) 43.2 (9.35) per year 82.9 (23.89) 99.5 (26.05) 89.4 (22.13) 78.5 (17.96) 76.6 (16.58)
The numbers in parentheses are the median values for Panel A and the percentages of the total number of stocks for Panels B and C.
Table I—Continued
Year 1995 1996 1997 1998 1999
Panel C: Mutual fund’s trading at the turn of a calendar period First Quarter
Number of stocks traded by >=1 Fund 314 (90.49) 362 (94.76) 403 (99.75) 418 (95.65) 422 (91.34) >= 5 Funds 168 (48.41) 228 (59.69) 280 (69.31) 252 (57.67) 213 (46.10) >=10 Funds 107 (30.84) 138 (36.13) 195 (48.27) 158 (36.16) 141 (30.52) >=20 Funds 56 (16.14) 59 (15.45) 100 (24.75) 88 (20.14) 100 (21.65) >=30 Funds 24 (6.92) 25 (6.54) 56 (13.86) 55 (12.59) 66 (16.29) >=50 Funds 5 (1.44) 4 (1.05) 17 (4.21) 25 (5.72) 43 (9.31) >=100 Funds 0 (0.00) 0 (0.00) 0 (0.00) 0 (0.00) 5 (1.08) First Month
Number of stocks traded by >= 1 Fund 275 (79.25) 351 (91.88) 391 (96.78) 393 (89.93) 395 (85.50) >= 3 Funds 149 (42.94) 264 (69.11) 299 (74.01) 262 (59.95) 189 (40.91) >= 5 Funds 114 (32.85) 175 (45.81) 232 (57.43) 170 (38.90) 137 (29.65) >=10 Funds 59 (17.00) 86 (22.51) 129 (31.93) 83 (18.99) 88 (19.05) >=20 Funds 16 (4.61) 27 (7.07) 50 (12.38) 30 (6.86) 49 (10.61) >=30 Funds 4 (1.15) 7 (1.83) 25 (6.19) 11 (2.52) 33 (7.14) >=50 Funds 0 (0.00) 0 (0.00) 0 (0.00) 0 (0.00) 13 (2.81) First Day
Number of stocks traded by >= 1 Fund 258 (74.35) 102 (26.70) 201 (49.75) 90 (20.59) 97 (21.00) >= 2 Funds 95 (27.38) 45 (11.78) 85 (21.04) 32 (7.32) 49 (10.61) >= 3 Funds 57 (16.43) 19 (4.97) 43 (10.64) 6 (1.37) 21 (4.55) >= 4 Funds 32 (9.22) 9 (2.36) 20 (4.95) 1 (0.23) 11 (2.38) >= 5 Funds 22 (6.34) 4 (1.05) 8 (1.98) 1 (0.23) 5 (1.08)
Table II
Herding Measure for Different Number of Funds Trading the Same Stock in Different Frequencies for Stock Portfolios Sorted by Their Magnitude of Price Change
D1 D2 D3 D4 I4 I3 I2 I1 F-value D1-Others I1-Others
At Least 3 Funds Trading the Same Stocks
0.0952 0.0634 0.0512 0.0536 0.0526 0.0587 0.0756 0.1461 0.0254 0.0823 Quarterly (16.47)*** (12.66)*** (10.71)*** (10.71)*** (10.37)*** (10.76)*** (13.72)*** (20.94)*** 32.88*** (4.18)*** (11.35)*** 0.0704 0.0462 0.0337 0.0407 0.0382 0.0358 0.0473 0.0936 0.0216 0.0492 Monthly (20.07)*** (14.08)*** (10.41)*** (11.85)*** (11.67)*** (10.86)*** (14.10)*** (25.73)*** 39.34*** (5.67)*** (12.77)*** 0.0555 0.0391 0.0331 0.0364 0.0331 0.0332 0.0425 0.0789 0.0116 0.0395 Weekly (28.33)*** (18.92)*** (15.48)*** (16.12)*** (15.97)*** (16.16)*** (21.69)*** (38.49)*** 67.77*** (5.46)*** (18.00)*** 0.0591 0.0491 0.0443 0.0437 0.0505 0.0476 0.0519 0.0760 0.0043 0.0258 Daily (34.57)*** (25.59)*** (21.45)*** (19.89)*** (26.92)*** (23.84)*** (30.47)*** (49.39)*** 42.08*** (2.34)** (15.16)***
At Least 4 Funds Trading the Same Stocks
0.1183 0.0748 0.0597 0.0611 0.0624 0.0634 0.0796 0.1517 0.0401 0.0783 Quarterly (19.80)*** (14.00)*** (11.72)*** (11.82)*** (11.99)*** (11.26)*** (14.26)*** (21.38)*** 33.95*** (6.21)*** (10.59)*** 0.0873 0.0582 0.0484 0.0529 0.0495 0.0444 0.0580 0.1019 0.0268 0.0452 Monthly (23.50)*** (16.59)*** (13.86)*** (14.40)*** (14.04)*** (12.82)*** (16.56)*** (27.52)*** 35.58*** (6.58)*** (11.46)*** 0.0701 0.0569 0.0488 0.0499 0.0457 0.0464 0.0534 0.0888 0.0123 0.0351 Weekly (33.12)*** (24.61)*** (20.09)*** (19.66)*** (19.61)*** (20.13)*** (25.05)*** (41.07)*** 50.05*** (5.36)*** (15.09)*** 0.0689 0.0648 0.0605 0.0583 0.0662 0.0631 0.0646 0.0840 0.0002 0.0196 Daily (33.62)*** (26.86)*** (22.65)*** (20.09)*** (27.26)*** (24.65)*** (30.49)*** (46.76)*** 16.70*** (0.08) (9.74)***