台指選擇權套利機會分析
Arbitrage Opportunity Analysis of TWSI Index Options
姜林杰祐 鐘芳玫
國立高雄應用科技大學金融資訊研究所 C. Y. ChiangLin and F. M. Chung
Institute of Finance and Information, National Kaohsiung University of Applied Science
摘要
近年來,衍生性金融商品發展相當快速,在金融市場中所扮演的角色日益重 要。台灣衍生性金融商品的交易歷史雖短,但交易量正逐漸增加,其中備受矚目 的是台灣證券交易所股價指數選擇權(TXO)。本研究根據台指選擇權市場的日內 逐筆資料,檢驗在「買(賣)權價差」、「買(賣)權蝶狀價差」及「盒狀價差」等操 作策略下,台指選擇權是否存在套利機會,以了解台指選擇權市場的效率性。實 證結果顯示,台指選擇權市場確具效率性。在考慮交易成本下,套利機會大幅下 降,顯示交易成本是影響套利機會出現的關鍵性因素。 關鍵字:市場效率性、台指選擇權、套利、價差Abstract
Since Chicago Board Options Exchange introduced the first index option contract in 1983, index options have played a significant role in financial markets. Though the trading history of Taiwan Weighted Stock Index Option (TXO) is relatively short, the option has become one of the most successful innovative instruments over the past few years, as its high trading volume indicates. Using various no arbitrage conditions, including call and put spreads, call and put butterfly spreads, and box spreads, this study examines the efficiency of Taiwan index options market. The test results indicate that the option market is rather efficient. The arbitrage opportunities significantly diminish when transaction costs are considered. Transaction cost seems a critical factor influencing the appearance of arbitrage
差關係在考慮交易成本後,可套利比例明顯下降,甚至於不存在套利機會。因此 就實證期間而言,台指選擇權市場是具有效率性的。相較於 Ackert and Tian (2001) 的研究結果,台指選擇權市場的效率性並不遜於美國選擇權市場。而由回顧歷史 發現,套利機會的出現與否容易受到特殊事件之影響。
參考文獻
[1] 郭政緯,2003,「台股指數期貨與選擇權套利性之實證研究」,東海大學企業 管理學系碩士論文。 [2] 黃亦駿,2003,「台股指數選擇權市場效率性研究」,銘傳大學財務金融研究 所碩士學位論文。 [3] 馮耀文,2003,「台指選擇權套利課題之研究」,淡江大學管理科學研究所碩 士學位論文。 [4] 楊真珠,2003,「台指選擇權市場效性分析」,國立政治大學經濟研究所碩士 論文。 [5] 謝忠良,2003,「台股選擇權市場效率性和套利之研究」,國立高雄第一科技 大學財務管理所碩士論文。[6] L. F. Ackert and Y. S. Tian, 1988, The introduction of Toronto index participation units and arbitrage opportunities in the Toronto 35 index option market, Journal of Derivatives, 5(4).
[7] L. F. Ackert and Y. S. Tian, 2000, Evidence on the efficiency of index options markets, Economic review –Federal Reserve Bank of Atlanta, 85(1).
[8] L. F. Ackert and Y. S. Tian, 2001, Efficiency in index options markets and trading in stock baskets, Journal of Banking & Finance, 25(9).
[9] A. Bharadwaj and J. B. Wiggins, 2001, Box spread and put-call parity tests for the S&P 500 Index LEAPS Market, The Journal of Derivatives, 8(4).
[10] G. Capelle-Blancard and M. Chaudhury, 2001, Efficiency tests of the French Index (CAC40) Options Market, Working Paper, University of Paris.
[11] M. L. Hemler and T. W. Miller, 1997, Box spread arbitrage profits following the 1987 market crash: Real or illusory?, The Journal of Financial and Quantitative Analysis, 32(1).
[12] A. G. Ronn and E. I. Ronn, 1989, The Box-spread arbitrage: Theory, tests and investment strategies, Review of Financial Studies, 2(1).
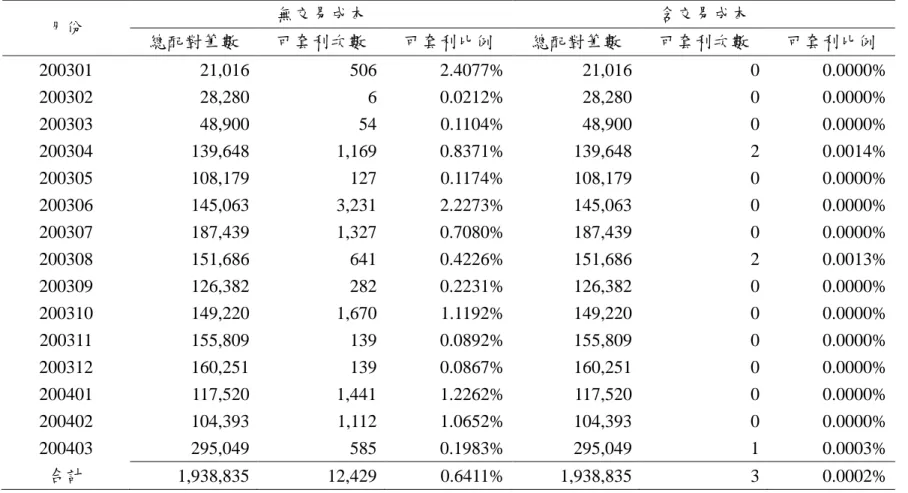
表 1 買權價差關係套利機會分析 月份 無交易成本 含交易成本 總配對筆數 可套利次數 可套利比例 總配對筆數 可套利次數 可套利比例 200301 21,016 506 2.4077% 21,016 0 0.0000% 200302 28,280 6 0.0212% 28,280 0 0.0000% 200303 48,900 54 0.1104% 48,900 0 0.0000% 200304 139,648 1,169 0.8371% 139,648 2 0.0014% 200305 108,179 127 0.1174% 108,179 0 0.0000% 200306 145,063 3,231 2.2273% 145,063 0 0.0000% 200307 187,439 1,327 0.7080% 187,439 0 0.0000% 200308 151,686 641 0.4226% 151,686 2 0.0013% 200309 126,382 282 0.2231% 126,382 0 0.0000% 200310 149,220 1,670 1.1192% 149,220 0 0.0000% 200311 155,809 139 0.0892% 155,809 0 0.0000% 200312 160,251 139 0.0867% 160,251 0 0.0000% 200401 117,520 1,441 1.2262% 117,520 0 0.0000% 200402 104,393 1,112 1.0652% 104,393 0 0.0000% 200403 295,049 585 0.1983% 295,049 1 0.0003% 合計 1,938,835 12,429 0.6411% 1,938,835 3 0.0002%
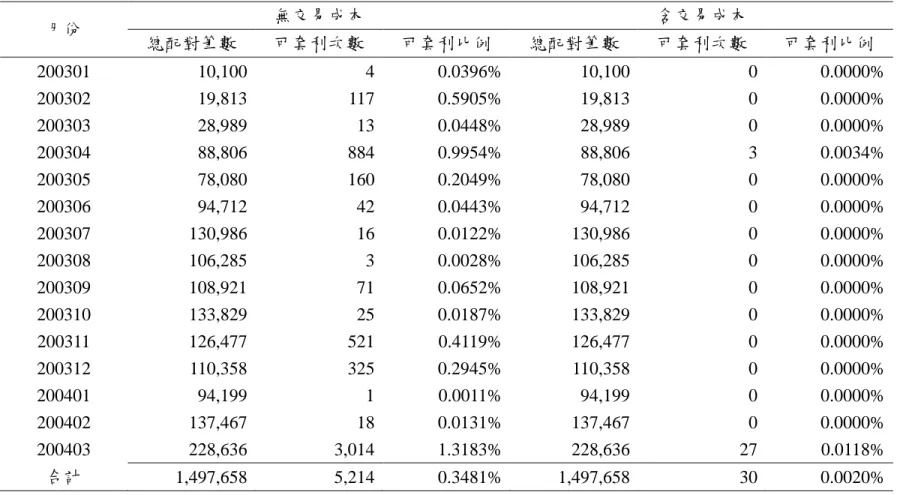
表 2 賣權價差關係套利機會分析 月份 無交易成本 含交易成本 總配對筆數 可套利次數 可套利比例 總配對筆數 可套利次數 可套利比例 200301 10,100 4 0.0396% 10,100 0 0.0000% 200302 19,813 117 0.5905% 19,813 0 0.0000% 200303 28,989 13 0.0448% 28,989 0 0.0000% 200304 88,806 884 0.9954% 88,806 3 0.0034% 200305 78,080 160 0.2049% 78,080 0 0.0000% 200306 94,712 42 0.0443% 94,712 0 0.0000% 200307 130,986 16 0.0122% 130,986 0 0.0000% 200308 106,285 3 0.0028% 106,285 0 0.0000% 200309 108,921 71 0.0652% 108,921 0 0.0000% 200310 133,829 25 0.0187% 133,829 0 0.0000% 200311 126,477 521 0.4119% 126,477 0 0.0000% 200312 110,358 325 0.2945% 110,358 0 0.0000% 200401 94,199 1 0.0011% 94,199 0 0.0000% 200402 137,467 18 0.0131% 137,467 0 0.0000% 200403 228,636 3,014 1.3183% 228,636 27 0.0118% 合計 1,497,658 5,214 0.3481% 1,497,658 30 0.0020%
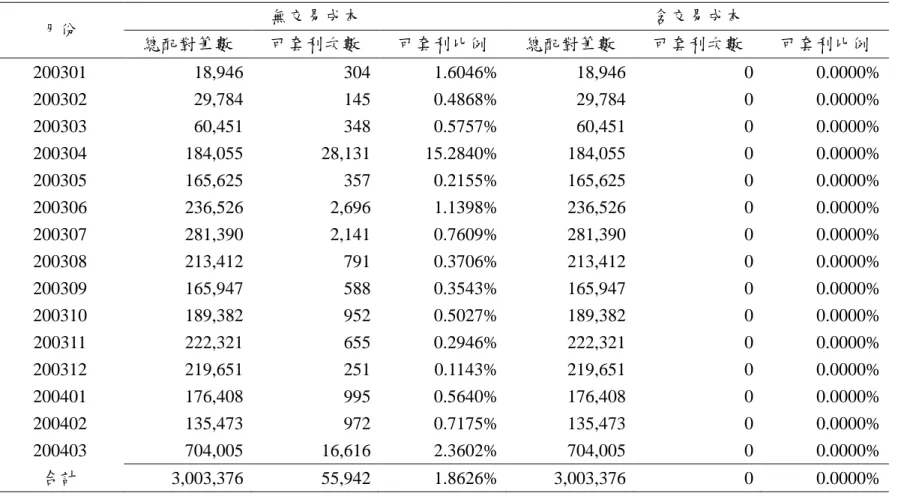
表 3 買權蝶狀價差關係套利機會分析 月份 無交易成本 含交易成本 總配對筆數 可套利次數 可套利比例 總配對筆數 可套利次數 可套利比例 200301 18,946 304 1.6046% 18,946 0 0.0000% 200302 29,784 145 0.4868% 29,784 0 0.0000% 200303 60,451 348 0.5757% 60,451 0 0.0000% 200304 184,055 28,131 15.2840% 184,055 0 0.0000% 200305 165,625 357 0.2155% 165,625 0 0.0000% 200306 236,526 2,696 1.1398% 236,526 0 0.0000% 200307 281,390 2,141 0.7609% 281,390 0 0.0000% 200308 213,412 791 0.3706% 213,412 0 0.0000% 200309 165,947 588 0.3543% 165,947 0 0.0000% 200310 189,382 952 0.5027% 189,382 0 0.0000% 200311 222,321 655 0.2946% 222,321 0 0.0000% 200312 219,651 251 0.1143% 219,651 0 0.0000% 200401 176,408 995 0.5640% 176,408 0 0.0000% 200402 135,473 972 0.7175% 135,473 0 0.0000% 200403 704,005 16,616 2.3602% 704,005 0 0.0000% 合計 3,003,376 55,942 1.8626% 3,003,376 0 0.0000%
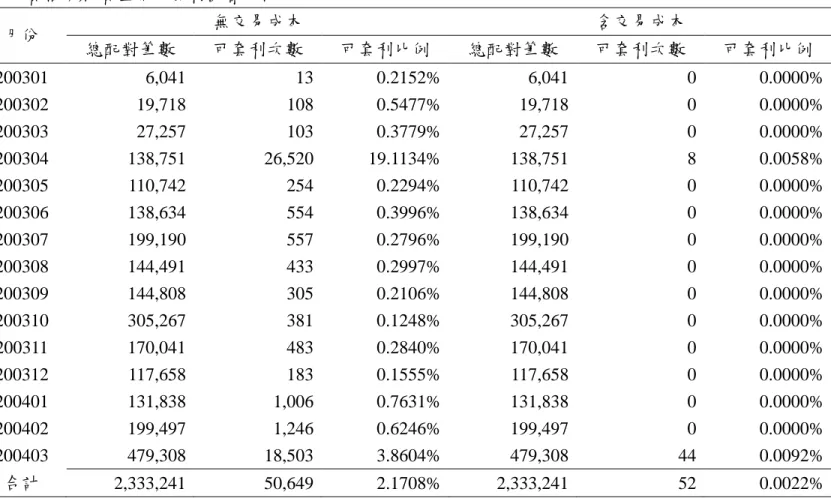
表 4 賣權蝶狀價差關係套利機會分析 月份 無交易成本 含交易成本 總配對筆數 可套利次數 可套利比例 總配對筆數 可套利次數 可套利比例 200301 6,041 13 0.2152% 6,041 0 0.0000% 200302 19,718 108 0.5477% 19,718 0 0.0000% 200303 27,257 103 0.3779% 27,257 0 0.0000% 200304 138,751 26,520 19.1134% 138,751 8 0.0058% 200305 110,742 254 0.2294% 110,742 0 0.0000% 200306 138,634 554 0.3996% 138,634 0 0.0000% 200307 199,190 557 0.2796% 199,190 0 0.0000% 200308 144,491 433 0.2997% 144,491 0 0.0000% 200309 144,808 305 0.2106% 144,808 0 0.0000% 200310 305,267 381 0.1248% 305,267 0 0.0000% 200311 170,041 483 0.2840% 170,041 0 0.0000% 200312 117,658 183 0.1555% 117,658 0 0.0000% 200401 131,838 1,006 0.7631% 131,838 0 0.0000% 200402 199,497 1,246 0.6246% 199,497 0 0.0000% 200403 479,308 18,503 3.8604% 479,308 44 0.0092% 合計 2,333,241 50,649 2.1708% 2,333,241 52 0.0022%
表 5 長部位盒狀價差關係套利機會分析 月份 無交易成本 含交易成本 總配對筆數 可套利次數 可套利比例 總配對筆數 可套利次數 可套利比例 200301 4,816 2352 48.8372% 4,816 0 0.0000% 200302 7,358 3480 47.2955% 7,358 0 0.0000% 200303 12,370 5626 45.4810% 12,370 0 0.0000% 200304 154,831 104,320 67.3767% 154,831 506 0.3268% 200305 114,941 59441 51.7144% 114,941 0 0.0000% 200306 195,307 119,992 61.4376% 195,307 0 0.0000% 200307 229,920 152,978 66.5353% 229,920 0 0.0000% 200308 159,871 93510 58.4909% 159,871 0 0.0000% 200309 204,081 118061 57.8501% 204,081 0 0.0000% 200310 243,130 151,734 62.4086% 243,130 0 0.0000% 200311 250,262 145349 58.0787% 250,262 0 0.0000% 200312 249,948 150115 60.0585% 249,948 0 0.0000% 200401 143,946 106,140 73.7360% 143,946 0 0.0000% 200402 172,470 103,962 60.2783% 172,470 0 0.0000% 200403 264,821 139,905 52.8300% 264,821 8 0.0030% 合計 2,408,072 1,456,965 60.5034% 2,408,072 514 0.0213%
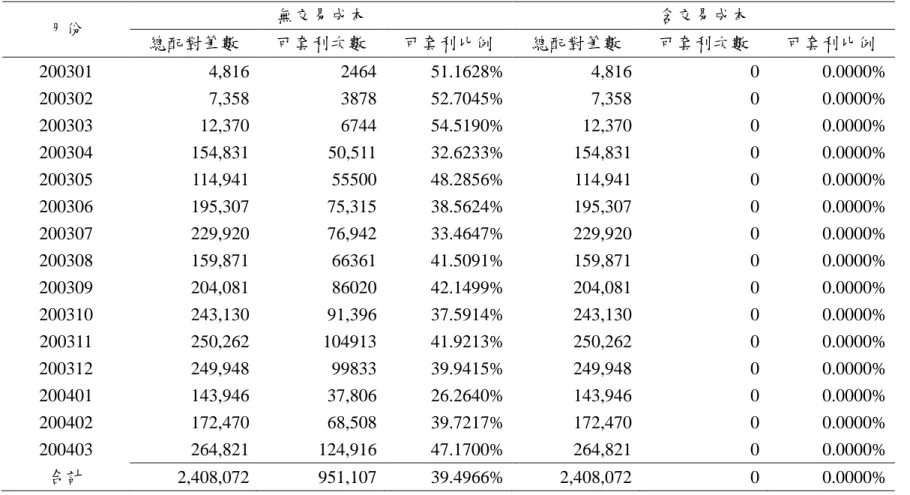
表 6 短部位盒狀價差關係套利機會分析 月份 無交易成本 含交易成本 總配對筆數 可套利次數 可套利比例 總配對筆數 可套利次數 可套利比例 200301 4,816 2464 51.1628% 4,816 0 0.0000% 200302 7,358 3878 52.7045% 7,358 0 0.0000% 200303 12,370 6744 54.5190% 12,370 0 0.0000% 200304 154,831 50,511 32.6233% 154,831 0 0.0000% 200305 114,941 55500 48.2856% 114,941 0 0.0000% 200306 195,307 75,315 38.5624% 195,307 0 0.0000% 200307 229,920 76,942 33.4647% 229,920 0 0.0000% 200308 159,871 66361 41.5091% 159,871 0 0.0000% 200309 204,081 86020 42.1499% 204,081 0 0.0000% 200310 243,130 91,396 37.5914% 243,130 0 0.0000% 200311 250,262 104913 41.9213% 250,262 0 0.0000% 200312 249,948 99833 39.9415% 249,948 0 0.0000% 200401 143,946 37,806 26.2640% 143,946 0 0.0000% 200402 172,470 68,508 39.7217% 172,470 0 0.0000% 200403 264,821 124,916 47.1700% 264,821 0 0.0000% 合計 2,408,072 951,107 39.4966% 2,408,072 0 0.0000%