行政院國家科學委員會專題研究計畫 期中進度報告
臨床磁振擴散張量影像與神經纖維追蹤之技術發展(1/2)
計畫類別: 個別型計畫 計畫編號: NSC93-2314-B-002-143- 執行期間: 93 年 08 月 01 日至 94 年 07 月 31 日 執行單位: 國立臺灣大學電機工程學系暨研究所 計畫主持人: 鍾孝文 共同主持人: 陳震宇 計畫參與人員: 周銘鐘、劉華姍、彭旭霞、黃尹宬、曾慶昭、吳珮歆 報告類型: 精簡報告 處理方式: 本計畫可公開查詢中 華 民 國 94 年 5 月 27 日
行政院國家科學委員會專題研究計畫進度報告
臨床磁振擴散張量影像與神經纖維追蹤之技術發展(1/2)
Technical developments on clinical diffusion tensor imaging and
neural tractography (1/2)
計畫編號:NSC93-2314-B-002-143
執行期限:93 年 8 月 1 日至 94 年 7 月 31 日
主持人:鍾孝文教授 台大電機系
[email protected]
一、中文摘要 本計畫第一年特定目標,係欲探討是 否 FLAIR 技術在去除腦脊髓液的部份體積 效應之後,能夠協助達成更佳的白質神經 纖維追蹤。七位健康成人受試者(23~27 歲)經由五次反覆的造影過程,取得傳統 與 FLAIR 的擴散張量影像,之後再由兩種 演算法(EZ-tracing 與 tensor deflection)進 行神經纖維追蹤,並且比較兩種成像方式 所能夠追蹤出的神經纖維總體積。結果顯 示在 FLAIR DTI 成像技術中,神經纖維追 蹤明顯較傳統 DTI 為佳,特別是在接近腦 室與腦溝附近、富含腦脊髓液之處。在相 對不受腦脊髓液干擾的區域中,或許因為 FLAIR DTI 本身具有較低信雜比,而導致 小部份的追蹤錯誤,但並不影響主要白質 神經纖維束(例如胼肢體或冠狀輻射區) 的結果。扣除追蹤錯誤部份後,FLAIR DTI 平均偵測出比傳統 DTI 多約 17%體積的神 經纖維。因此,即使 FLAIR DTI 具有較長 的掃瞄時間與略低的信雜比,該技術在神 經纖維追蹤方面仍有卓著的成效。 關鍵詞:擴散張量影像、白質神經纖維追 蹤、部份體積效應、流體抑制反轉回復、 腦脊髓液抑制。 AbstractThe specific aim for the first fiscal year of this project is to test our hypothesis that the FLAIR technique helps to improve DTI
white matter tractography by eliminating CSF partial volume effects. Seven healthy young adults aged 23-37 underwent both conventional and FLAIR DTI on a 1.5 Tesla system. Each subject was scanned five times. Tractography was performed with both sequences using two algorithms: One voxel-based method (EZ-tracing) with global seed points, and the other based on subvoxel tractography (tensor deflection) using manual encircling of local seed points. Total volume of the fibers tracked was compared for the two types of images. Fiber tracking was found to be substantially more successful in FLAIR DTI near the lateral ventricles and the sulci where CSF partial volume effects are likely to be present. Minor false tracts on FLAIR images possibly due to reduced SNR were found in regions relatively free from CSF contamination, but did not affect tracking of major peri-ventricular white matter bundles such as those related to the corpus callosum or the corona radiata. Excluding false tracts, the FLAIR technique detected an average of 17% more fibers in volume than with conventional DTI in the peri-ventricular regions (p < 0.0005). It is concluded that despite of reduced SNR and longer scan time, FLAIR is an effective means that helps to improve tractography. Keywords: Diffusion tensor imaging, white
matter tractography, partial volume effects, fluid-attenuated inversion recovery, CSF suppression
二、計畫緣由與目的
White matter tractography by diffusion tensor imaging (DTI) has raised much clinical attention. One potential problem in quantitative derivation of diffusion-related parameters from MR imaging data is the contamination from cerebrospinal fluid (CSF) (1,2). Partial volume effects in the peri-ventricular regions and the sulci could result in an over-estimation of the ADC by about 15% to 30% (1). In addition, because CSF diffusion is largely isotropic, the ADC over-estimation would lead to an under-estimation of diffusion anisotropy of brain parenchyma in regions prone to partial volume effects (3).
The inaccuracy in the derivation of diffusion-related parameters due to CSF contaminations can be eliminated with a fluid-attenuated inversion recovery (FLAIR) technique (2). However, questions remain whether similar arguments hold true for DTI white matter tractography. The purpose of our study, therefore, was to investigate the effects of FLAIR CSF suppression on white matter tractography in healthy adult brain. Specifically, we hypothesized that FLAIR DTI could derive a larger volume of neural fiber tracts than that obtained with conventional DTI methods.
Seven healthy volunteers (23-37 years of age, all males) participated in this study. MR examinations were performed on a 1.5 Tesla MR system. Axial conventional DTI were acquired with diffusion-sensitizing gradients applied along six directions: (+x)-(+y), (+x)-(–y), (+y)-(+z), (+y)-(–z), (+z)-(+x), and (+z)-(–x) with the diffusion weighting factor b = 1400 sec/mm2, plus one reference scan with b = 0. Imaging parameters were: TR = 5000 msec, TE = 120 msec, field-of-view 24 cm, slice thickness = 3~5 mm (no inter-slice gaps), matrix size = 128x128, signal averges = 4. Total scan time was 2 minutes and 20 seconds. FLAIR diffusion-tensor-weighted images were
obtained using the same sequence, with the exception that a slice selective 1800 inversion RF pulse was added before the 900 excitation pulse. TI was 2300 msec with TR 9000 msec. All other imaging parameters were kept identical. Each subject underwent five scans with both conventional and FLAIR DTI. Total number of examinations was 35 for seven subjects.
The diffusion tensor was calculated, with principal fiber direction derived as the principal eigenvector. Two methods, EZ-tracing (4) and tensor deflection (5), were used for fiber tracking. Thresholds for fiber connection were set at FA > 0.2, angle between principal eigenvectors in adjacent voxels < 180, and angle between principal eigenvector and the vector connecting neighboring voxels < 180 within a 5x5 pixel window, and were kept identical for both the conventional DTI and FLAIR DTI images. The resulting fiber tracts in color were superimposed on the original images. Fibers inconsistent with knowledge of normal anatomy were regarded as false tracts, because only healthy subjects were included in this study. Comparison of tractography results was carried out by computing the total volume of fibers found in selected regions-of-interest near the lateral ventricles, excluding the false tracts.
三、結果與討論
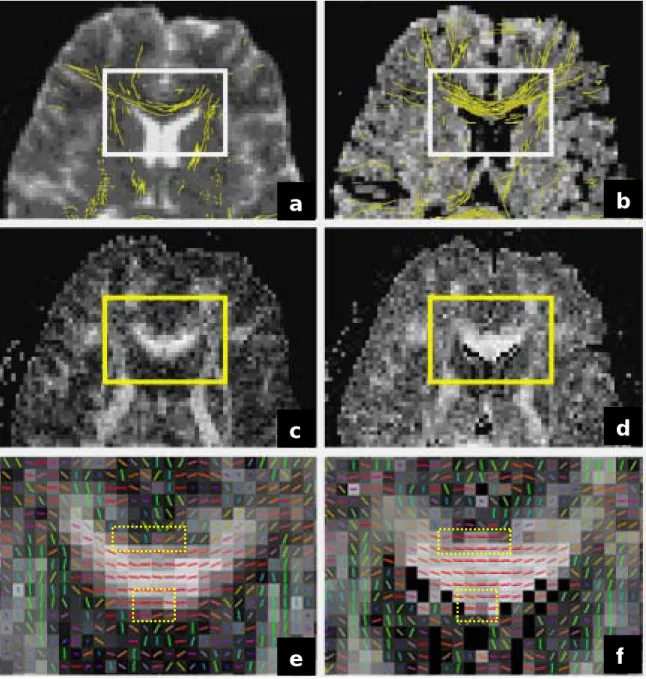
Figure 1 shows the anterior aspects of an image slice, demonstrating the difference between conventional (Figs.1a, 1c, and 1e in the left column) and FLAIR (Figs.1b, 1d, and 1f in the right column) DTI tractograms. Note that the FA maps in Figs.1c and 1d were displayed at the same window level to allow for a side-by-side comparison of the FA values (i.e., brightness). One clearly sees the larger amount of white matter tracts in the corpus callosum on the FLAIR DTI tractograms (Fig.1b as opposed to Fig.1a). In the conventional DTI tractograms, partial volume effects with adjacent CSF in the
lateral ventricles resulted in an under- estimation of fractional anisotropy at the edge of the corpus callosum compared with the FLAIR DTI tractogram (Fig.1d as opposed to Fig.1c). The under-estimation of FA in conventional DTI further led to uncertainty of the major fiber orientations in the genu of the corpus callosum (Fig.1e).
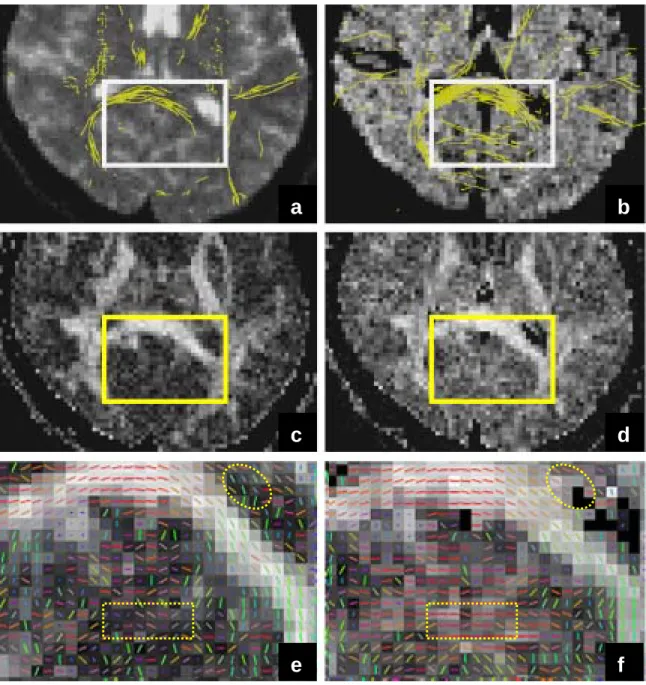
Arranged in a similar manner, Fig.2 shows the posterior aspect of the same image slice as Fig.1, demonstrating tractographic difference due both to partial volume and SNR effects. While the FLAIR DTI tractogram again showed more tracts in the splenium of the corpus callosum than the conventional DTI tractogram, some amount of false tracts was found in the occipital lobes (Fig.2b). These tracts were regarded as artificial because they traversed continuously across the cerebral midline where, anatomically in a normal brain, no crossing fibers should exist. A closer examination indicated a much more noisy appearance of the FA map obtained using FLAIR DTI (Fig.2d), possibly leading to incidentally consistent orientations of the eigenvectors (dashed rectangle in Fig.2f).
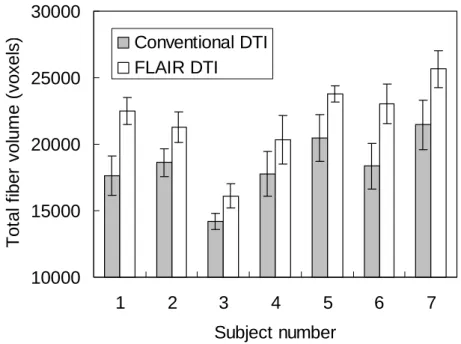
Figure 3 shows the comparison of total volumes of fibers tracked from conventional versus FLAIR DTI images. FLAIR DTI detected significantly larger volumes of fiber tracts than conventional DTI for all our subjects. On the average, about 17% of additional volume of fiber tracts were detected in FLAIR DTI compared with conventional DTI. The group difference was also statistically significant (p < 0.0005).
The results from our study suggest that an elimination of CSF partial volume effects using FLAIR was very helpful for white matter tractography in regions near the ventricles and brain surfaces. In the corpus callosum near the lateral ventricles, it can be seen that the increase in fiber tract volumes found in FLAIR was due to higher FA values than in conventional DTI. This is in good
agreement with previous studies which consistently reported higher FA found using FLAIR DTI (4-6). On the other hand, the drawback in reduced SNR in FLAIR DTI in regions relatively free from CSF contamination, although admittedly results in the estimation uncertainty for the fractional anisotropy or the direction of the major eigenvector of the diffusion tensor, does not seem to be a major obstacle for successful fiber tractography. It is hence concluded that FLAIR DTI helps to improve white matter tractography by eliminating CSF partial volume effects. Despite of reduced SNR and longer scan time, the FLAIR DTI should be used for white matter tractography when brain regions prone to CSF contamination are of clinical interest.
四、 計畫成果自評
Our efforts spent in this project have created results substantially greater than that mentioned in this brief report, which is an excerpted version of a recently published 2005 paper in the American Journal of
Neuroradiology (6), which soon received
promising and encouraging commentary from a later Editorial (7). Overall, the project has generated four conference papers, all presented in the 2005 Annual Meeting of the International Society of Magnetic Resonance in Medicine, including one which won the Poster Honor of Mention Award (8). In addition, two journal articles have been submitted for review, plus some other ones being prepared for submission. The achievements from this project have already been put into practice in Tri-Service General Hospital for daily clinical examinations. In short, we have confidence that a successful execution of the second year of this project will result in better utilization of DTI in routine diagnosis.
五、參考文獻
1. Hirsch JG, Bock M, Essig M, Schad LR. Comparison of diffusion anisotropy
measurements in combination with the flair-technique. Magn Reson Imaging 1999;17:705-716.
2. Papadakis NG, Martin KM, Mustafa MH, et al. Study of the effect of CSF suppression on white matter diffusion anisotropy mapping of healthy human brain. Magn Reson Med
2002;48:394-398.
3. Latour LL, Warach S. Cerebral spinal fluid contamination of the measurement of the apparent diffusion coefficient of water in acute stroke. Magn Reson Med 2002;48:478-486.
4. Terajima K, Nakada T. EZ-tracing: a new ready-to-use algorithm for magnetic resonance tractography. J Neurosci
Methods 2002;116:147-155.
5. Lazar M, Weinstein DM, Tsuruda JS, et al. White matter tractography using diffusion tensor deflection. Hum Brain
Mapp 2003;18:306-321.
6. Chou MC, Lin YR, Huang TY, Wang CY, Chung HW, Juan CJ, Chen CY. FLAIR diffusion-tensor MR tractography: comparison of fiber tracking with conventional imaging. American Journal
of Neuroradiology, 2005;26:591-597.
7. Lascola C. Diffusion tensor tractography: exploring the cost-benefit ratio of incorporating CSF suppression into fiber tracing algorithms. American Journal of
Neuroradiology, 2005;26:693-694.
8. Chao TC, Chung HW, Chou MC, Ko CW, Wu MT. Normalization of diffusion tensor image using parameters from normalizing anatomical image, in
International Society for Magnetic Resonance in Medicine, 13th Annual
六、圖表
Figure 1. The anterior aspects of an image slice obtained from a 23-year-old male subject. The images represent white matter tracts superimposed on the b = 0 images using the EZ-tracing algorithm (Figs.1a and 1b; top row), the FA maps in gray scale (Figs.1c and 1d; middle row; displayed in identical window level), and vector-encoded FA maps (Figs.1e and 1f; bottom row; Color coding: red for left-right, green for anterior-posterior, blue for superior-inferior) magnified from the rectangular region-of-interest shown in Figs.1a-1d, respectively. Partial volume effects near adjacent CSF lead to under-estimation of FA in the genu of the corpus callosum in conventional DTI (left column; dashed rectangles in Fig.1e; Note the less consistent fiber directions as well as the darker gray level standing for lower FA values), accounting for the smaller amount of fibers found by the tracking algorithm using conventional DTI compared with FLAIR DTI (right column; dashed rectangles in Fig.1f; Note the more consistent fiber directions as well as the brighter gray level standing for higher FA values).
a
b
c
d
Figure 2. The posterior aspects of the same image slice as in Fig.1. Images represent white matter tracts superimposed on the b = 0 images using the EZ-tracing algorithm (Figs.2a and 2b; top row), the FA maps in gray scale (Figs.2c and 2d; middle row; displayed in identical window level), and vector-encoded FA maps (Figs.2e and 2f; bottom row; Color coding: red for left-right, green for anterior-posterior, blue for superior-inferior) magnified from the rectangular region-of-interest shown in Figs.2a-2d, respectively. While the FLAIR DTI tractogram again shows more tracts in the splenium of the corpus callosum (Fig.2b and dashed oval in Fig.2f; Again note the more consistent fiber directions) than the conventional DTI tractogram (Fig.2a and dashed oval in Fig.2e; Note the less consistent fiber direction near the lateral ventricle), some amount of false tracts is found in the occipital lobes (Fig.2b). The FA map obtained using FLAIR DTI (Fig.2d) is noisier than the conventional DTI FA map (Fig.2c), suggesting uncertainty in FA values. Vector-encoded FA maps shows that the false tracts in Fig.2b are due to incidentally consistent orientations of the eigenvectors (dashed rectangle in Fig.2f), which is absent in Fig.2e (dashed rectangle in Fig.2e).
a
b
c
d
10000 15000 20000 25000 30000 1 2 3 4 5 6 7 Subject number Tot a l f iber v o lu m e ( v o x el s ) Conventional DTI FLAIR DTI
Figure 3. Comparison of total volumes of fibers tracked from conventional versus FLAIR DTI images. For all subjects, FLAIR DTI detects significantly more tracts than conventional DTI, with individual p values ranging from 0.001 to 0.02 (student’s t-test, n = 5 for each individual). On the average, about 17% of additional fiber tracts are detected in FLAIR DTI compared with conventional DTI. The group difference is also statistically significant (paired student’s t-test, n = 7, p < 0.0005).