I
ACKNOWLEDGEMENT
First of all, I would thank to my parents who helped me all the time in psychology and financial supports. As well as, I am grateful to my advisor professors Ting Lin Lee and Lanfeng Kao. Without them, I could not have completed this thesis. Specially, this thesis would not have been possible unless the professor Lanfeng Kao. She had been very kind and patient while suggesting me the outlines of this study and correcting my doubts. I thank them for their overall supports.
Then, I would like to show my gratitude to my dear classmates and teachers who being with me during this study time. Here, it is an honor for me to meet the Chief of Foreign and Overseas Student Affairs Mr. Shi Ping Lin and Mrs. Hui Zhuan Huang. It is pleasure to thank them for their help and advices for me every time.
Lastly, I would like to thank to all of those people who supported me in any respect during the completion of the study, my dear friends, my younger sister and younger brother. I have spent memorable, fabulous time in Taiwan and I will always remember what I experienced here.
II
The Influence of Firm-Specific Characteristics on the
Issuance of Employee Stock Options
Advisors: Professor and Chairwoman Lanfeng Kao Institute of Finance
National University of Kaohsiung Professor and Chairwoman Ting-Lin Lee
Institute of Asia-Pacific Industrial and Business Management National University of Kaohsiung
Student: Nyamsuren Batbold
Institute of Asia-Pacific Industrial and Business Management National University of Kaohsiung
ABSTRACT
This study based on Taiwan firms’ data that gathered from the Market Observation Post System Taiwan and the Taiwan Economic Journal (TEJ). The purpose of this study was to influence the firm-specific characteristics on issuance of ESOs and first we analysis the determinant of the firms’ characteristics and ownership structure. Then, we used binary logistic regression method to explore the firm specific-characteristics on issuance of ESOs.
The findings indicate in the firm specific-characteristics of issued employee stock options, the firm’s return on assets ratio, growth opportunity and the possibility of issue employee stock options were a significant positive relationship. Also, the firm’s free cash flow, director’s share percent, outside shareholders’ share percent in total share and the possibility of issue employee stock options were a significant negative to the relationship.
Keywords: employee stock options, firm-specific characteristics, executive compensation,
III
TABLE OF CONTENTS
ACKNOWLEDGEMENT ... I ABSTRACT ... II TABLE OF CONTENTS ... III LIST OF TABLES ... V LIST OF FIGURES ... VI
CHAPTER 1: INTRODUCTION ... 1
1.1 Background and Motivation ... 1
1.1.1 ESOs in the US and other countries ... 2
1.1.2 ESOs in Taiwan ... 4
1.2 Objective and Proposed question of the study ... 5
1.3 Structure of the study ... 5
CHAPTER 2: LITERATURE REVIEW AND HYPOTHESISES ... 6
2.1 Studies around ESOs ... 6
2.2 Hypothesizes statement ... 7
2.2.1 Firm efficiency- the Return on assets ... 7
2.2.2 The Free cash flow ... 8
2.2.3 The firm’s growth opportunity – Tobin’s Q ratio... 8
2.2.4 Firm productivity - Sales per employee ... 9
2.2.5 Firm’s ownership structure ... 9
CHAPTER 3: RESEARCH DESIGN AND METHODOLOGY ... 11
3.1 Selection and definition of variables ... 11
The issuance of ESOs ... 11
Free cash flow ... 11
ROA ... 12
IV
Sales per employee ... 12
Ownership structure ... 13
3.2 Sample collection and methodology ... 13
3.3 Study framework ... 17
CHAPTER 4: DATA ANALYSIS AND RESULT ... 17
4.1 Sample data analysis ... 17
4.2 Descriptive statistics and correlations ... 21
4.3 Testing hypothesizes ... 22
CHAPTER 5: CONCLUSIONS ... 24
5.1 Findings and implications ... 24
5.2 Limitation and future research ... 25
REFERENCES ... 26
V
LIST OF TABLES
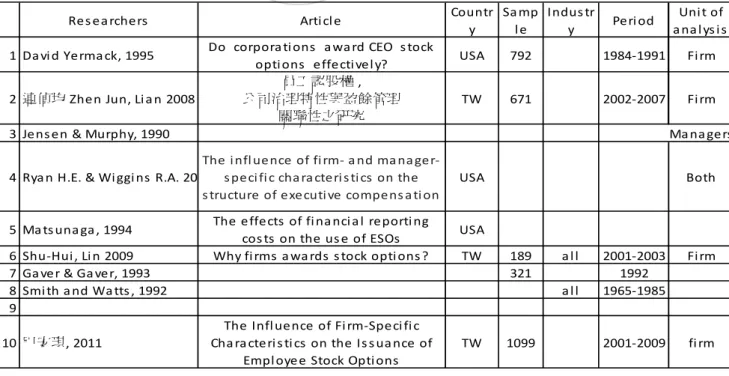
Table 2- 2: List of previous studies that have explored association between ESOs and different explanatory
variables ... 10
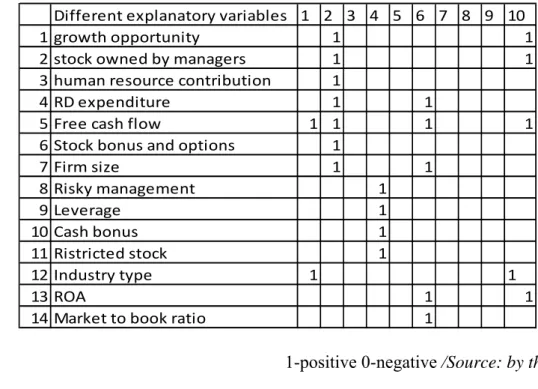
Table 2- 3: Examined firm characteristics in prior studies listed above ... 11
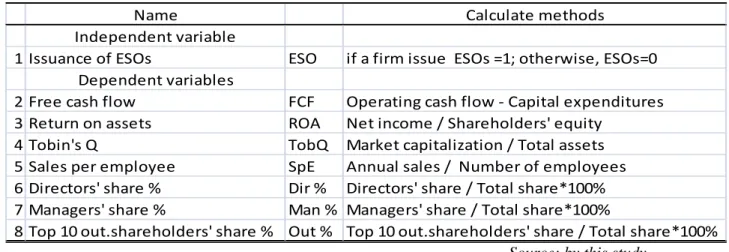
Table 3- 1: The definition and calculating method of each variable ... 13
Table 3- 2: List of ESO firms /2001-2010/ ... 14
Table 4- 1: Classification of ESO issued firms by industry type ... 20
Table 4- 2: Descriptive analysis of each variable ... 21
Table 4- 3: Correlations between variables ... 22
Table 4- 4: Logistic regression coefficients ... 23
Table 5- 1: Hypothesizes results ... 24
VI
LIST OF FIGURES
Figure 1- 1: Study procedure ... 6
Figure 4- 1: The chart-pie of firm insustry classification on issuance of ESOs ... 17 Figure 4- 2: Time trend for number of TSE and OTC firms issued ESOs ... 18
1
CHAPTER 1: INTRODUCTION
1.1 Background and Motivation
In the last few decades, it’s been fast grown executive compensation methods in Taiwan and all over the world, also it could be an important part of corporate governance. Especially stock-based compensation is the fastest-growing and traditionally has been used to align managerial interests with those of shareholders when separation of ownership and control causes agency problems1.
Employee stock ownership is the most common way for companies to motivate employees, to rally employees, and to maximize firm’s value and performance (Kruse, 1993; Jones & Kato, 1995; Park & Song, 1995; Blasi, Conte & Kruse, 1996; Ichiniowski, Shaw & Prennushi, 1997; Cui & Mark, 2002). Generally, there are two type of stock-based compensation used, Employee stock bonus and Employee stock options. From the perspective of corporate finance, the main difference between stock bonus and the employee stock options is the fact that the issue of stock bonus takes the post year performance as a standard, whereas the exercise of the ESOs depends on the future performance of the underlying shares. Furthermore, the issue of the ESOs implies the potential change in company ownership and capital structure, which has a large impact on the firm2. As say by Eberhard (2005), the ESOs are also important part of firm’s stage financing. Studies from initiation to until on the ESOs are not much as any other issues in finance because of gap of time, thus this topic attracted our attention for this study.
Employee Stock Options is a right to buy the underlying shares at a certain price over a specified period. It is issued by the firm for the salary compensation, remuneration and incentive scheme to the employees.
1 C.Jensen, H.Meckling 1976 2 Ling-Chu, Lee, Ming-Chun, Yang
2
From previous studies, we can make main points of why do firms grant the Employee stock options? There are several reasons for that:
1. It aligns the interest of the employee with the interests of the shareholders.
2. Options are a form of compensation that is not taxable to the grantee and not deductable by the employer at the time the options are granted. It becomes taxable when the options are exercised.
3. Options don’t require a cash outlay by the company at the time of grant.
4. Stock options were not expensed against earnings before 2004 in the USA and before 2008 in Taiwan. It is now required for all grants of options to be valued at the time of grant and expensed when the options vest if the companies want to report GAAP earnings.
1.1.1 ESOs in the US and other countries
The first inception happened around 1990s’ in USA. Now, the granting of stock options by companies in the United States has become an increasingly more significant form of employee compensation. According to estimates by the National Center for Employee Ownership, over the last decade the number of employees eligible for stock options has grown from about one million to somewhere between seven and ten million. Even more striking is the trend toward offering stock options to all employees in a firm, not just the top managers. Core and Guay (2001) and Eberhart (2005) find that options are 6.9 percent and 12 percent of shares outstanding, respectively. The tendency to grant ESOs is not limited to solely to the US. Kato et al. (2005) and Ding and Sun (2001) present evidence of the widespread use of ESOs from Japan and Singapore, respectively. Japanese government statistics from 2004 indicate that nearly 1300 firms in Japan issued options; with 16 percent of firms with over 1000 number of employees has stock options plans.
In Australia, data collected from the Australian Stock Exchange (ASX) show share issued under employee plans as $1.4 ($2) billion Australian dollar for 1999 (2000). The
3
exercise options on equities were $0.7 billion Australian dollar for 1999, representing up to 1 percent of the total compensation of employees in Australia. In China, the stock options are a fairy new practice. China allowed domestic companies to issue ESO in the beginning of 2006 and to foreign companies from 2008.
Until relatively recently, accounting for ESOs in the US and elsewhere was based on the 1972 Opinion No.25 of the Accounting Principles Board (APB 25). This standard required firms issuing fixed ESOs to record an expense equal to the difference between the market value of the shares on the grant date the option was granted to the employee (the grant date) and the exercise, or strike price of the option. This difference is called the intrinsic value of the option. Most firms granting ESOs set the exercise price equal to the grant data market value, so that intrinsic value is zero. As a result, no expense for ESOs compensation was recorded. For example, if the underlying share has a market value of 10USD on the grant date, setting the exercise price at 10USD triggers no expense recognition, whereas setting the exercise price at 8USD triggers an expense of 2USD per ESO granted.
On December 16, 2004, after much deliberation, consideration, public meetings and draft publications and pronouncements, the Financial Accounting Standards Board (FASB) published Statement of Financial Accounting Standards 123 (revised 2004), Share-Based Payment (FAS 123(R)). One of the reasons why the APB had not required fair value accounting for issue ESOs was the difficulty of establishing this value. This situation changed somewhat with the advent of the Black/Scholes option pricing formula. However several aspects of ESOs are not captured by Black Scholes. For example: the model assumes that options can be freely traded, where is ESOs cannot be exercised until the vesting date, which is typically one or more years after they are granted. Also, if the employee leaves the firm prior to vesting the options forfeited or, if exercised, there may be restrictions on the employee ability to sell the acquired shares. In addition, the Black/Scholes formula assumes that the options cannot be exercised prior to expiry (European option), whereas ESOs are (an
4
American option) can be exercised prior to expiry. Nevertheless, it was felt by many that Black/Scholes provided a reasonable basis for estimation of ESO fair value. 2
Among the prior literatures related the performance of ESOs, Hall and Liebman (1998) finds that the compensation on CEOs can enhance the company’s performance; that is, change in the value of stocks and options owned by CEO help with the company’s performance. Core and Guay (2001) believes that the compensation plans of ESOs not only motivate employees but also improve corporate value. Sesil, Kroumova, Blasi, and Kruse (2002) suggest that the new economy firms (i.e. pharmaceuticals, software, semi-conductor and high-technology manufacturing fields) that issued ESOs always perform better. Ittner, Lambert and Larcker (2003) prove that new economy firms (i.e. computer, software, internet, telecommunications or networking fields) rely on ESOs compensation plans much more than do the companies of traditional sector, while performing better after ESO issuance. Frye (2004) indicates that a company that issued more ESOs delivers greater performance.
1.1.2 ESOs in Taiwan
Employee profit sharing has been practiced in Taiwan by United Microelectronics Corp (UMC) since 1983. Most of Taiwan’s listed firms used employee stock bonus as compensation package. As the stock bonus is gratuities and the actual value of the stock bonus is higher than the company’s earnings of the year, so shareholders’ interests could be conflict and share price could changeable due to increased numbers of outstanding shares. Thus, in 2001 Taiwan’s Financial Supervisory Committee initiated the SFAS No39, Share based payment standard. It has imposed a cap on the employee stock bonus offered by companies raise pay to keep employees on and offer stock options (ESOs) for employees to subscribe so as to boost their performance. In Taiwan, ESOs are often dealt with by means of
5
the issuance of new stocks, which is different from the method of share repurchases adopted by foreign countries to offer stock options for employees to subscribe.
Taiwan Semiconductor Manufacturing Co., the fabrication vice president said that: “Salaries are low here, but the financial impact of the Chinese New Year bonus, yearly earnings stock bonuses and employee stock option plans can make the total package much higher than in the US”.
1.2 Objective and Proposed question of the study
This study examines the influence of firms’ specific characteristics, using such as financial indicators and ownership structure of public listed companies of Taiwan, on the decision of issuing ESOs. This research collects related data with ESO issuing companies of Taiwan from 2001 to 2009 obtains 14114 firm-years used for analyzes.
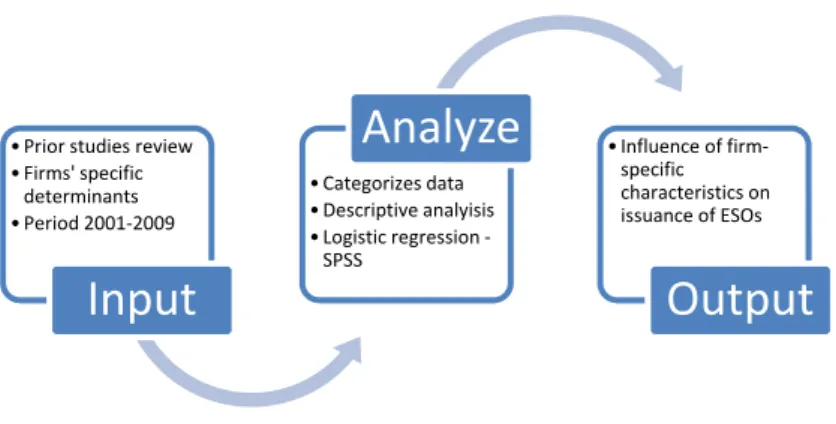
1.3 Structure of the study
The remainder of this study is organized as follows. Chapter two presents our proxies for the determinants of the firm-specific characteristics and the predicted relations between these variables and the issuance of ESOs. Our sample selection and the sources of our data are described in Chapter three. Chapter four presents the analysis and results, in the last Chapter five concludes the study.
6
Figure 1- 1: Study procedure
Source: by this study
CHAPTER 2: LITERATURE REVIEW AND HYPOTHESISES
2.1 Studies around ESOs
The main conclusions on executive stock options come from two large studies (Jensen and Murphy, 1990; Hall and Liebman, 1998). Briefly, the results show that the sensitivity of firm performance to CEO stock options has dramatically increased in the last decade. They conclude that the dramatic rise in CEO compensation has been driven by increases in annual stock option grants which have produced a large buildup in total CEO holdings of stock options. The authors of these studies conclude that no matter which measure is used, there has been a dramatic increase in responsiveness of CEO pay to firm performance during last 15 years, largely as a result of stock options.
Executive stock option studies have also reached a number of secondary conclusions that may be relevant to our study. Miller and Scholes (1981) have reported that stock option plans may be an attractive part of compensation package because of tax benefits. Because of the very favorable accounting treatment of stock option plans, this suggests that the role these incentives play merit closer security.
• Prior studies review • Firms' specific determinants • Period 2001‐2009
Input
• Categorizes data • Descriptive analyisis • Logistic regression ‐ SPSSAnalyze
• Influence of firm‐ specific characteristics on issuance of ESOsOutput
7
Agency theory predicts that incentive conflicts arise because the interests of managers are not aligned with the interests of shareholders. In order to bring the interests of two parties into closer alignment owners incur cost in the form of incentive contracts (Jensen and Meckling). The notion that stock options might increase firm performance is based on extending the rationale of incentive contact theory to employee beyond the executive suite.
Other theoretical considerations include the lowering of information costs because managers’ and employees’ are more closely aligned. This recognizes that employee have access to information that may be valuable to management. The presence of a group incentive scheme may result in employees having the necessary incentive to communicate, or act on their superior information. The majority of the research associated with information sharing has been evaluating top-down information sharing (Kleiner and Bouillon, 1988; Morishima, 1988). While Kleiner and Bouillon did not find a positive effect of information sharing on performance measures, Morishima found that there was s positive association with information sharing and profitability and productivity.
Profit sharing theory suggests a more positive prediction. Several studies have found that profit-sharing companies are more productive than firms without sharing although researchers have noted that it is hard to distinguish the effects of profit sharing from those of other human resource practices (Weitzman and Kruse 1990; Kruse 1993).
2.2 Hypothesizes statement
Hereafter, we review related researches and develop expected relations between the issuance of ESOs and firm’s financial indicators such as ROA, FCF, growth opportunity /Tobin’s Q/, Sales per employee and ownership structures.
2.2.1 Firm efficiency- the Return on assets
We referred the important measures of the firm’s profitability are return on asset (ROA). ROA measures how effectively the firm’s assets are used to generate profits net of expense. Core Holthausen and Larcker (1999) find for 205 US firms during 1982-1984 that the
8
average ROA negatively related to the “predicted excess compensation”, which are controlled by stock ownership and board of directors’ variables. Ke,Petroni and Safieddine (1999) find that ROA and level of compensation is positively related only for the publicly-held insurance companies.
H1: The ROA has positive relationship with possibility of decision to make issue ESOs.
2.2.2 The Free cash flow
Prior studies suggest that cash-strapped firms tend to use equity grants in place of cash compensation (Yermark 1995). In addition, firms may grant stock options in place of cash pay to reduce the impact of compensation on earnings when profitability is lower. This is because cash compensation appears on the financial statement as an expense whereas the value of stock option grants appears only in its footnotes (Core & Guay, 2001). We follow previous studies by taking the free cash flow (FCF) as a possible factor for making a decision to issue ESOs. Thereby developed the first hypothesis:
H2: The free cash flow has the negative relationship with possibility of decision to issue ESOs.
2.2.3 The firm’s growth opportunity – Tobin’s Q ratio
The investors’ chance to make investments in perceived profitable projects are generally called growth opportunity. Firms with abundant investment opportunities pay higher level of total compensation for their executives, long term incentive contracts motivating managers to take action to seek out and exploit new investment opportunities (Gaver, J.J and K.M. Gaver 1995). When managers have special information or specific knowledge about investment options, it would be efficient to let them choose which options are pursue (Jensen and Meckling 1995). Employee participation mostly effect on organizational outcomes.
According to incentive contract theory, firms with high- growth opportunities and large research activities are more likely to grant employee stock options because stock-based
9
measures provide a more accurate assessment of managerial effectiveness (Lambert & Larcker, 1987).
H3: The Tobin’s Q has positive relationship with possibility of decision to make issue ESOs.
2.2.4 Firm productivity - Sales per employee
This ratio does give investors some sense of a firm’s productivity and financial health and it gets a reliable idea of performance during over several years. In prior studies, Black and Lynch (2000) show that stock options are associated with increased productivity by using a unique nationality representative sample of U.S. establishments surveyved in 1993 and 1996. However, they do not indicate which explanation justifies the positive correlation. Sesil et.al (2002) documents that the issuance of stock options program results in higher levels of velue added per employee. Shu-Hui, Lin (2009) examined the difference between granted ESOs firms and didn’t grant firms, confirmed that had higher market-to-book ratio, R&D expenditures, volatility, employee growth, larger and profitability firms more likely to issue ESOs. Yu Peng Lin, James C.Sesil have examined that stock options program indeed improves firm productivity. They used the sales per employee ratio and suggested further work needed to clarify this issue. In other words, if stock options could motivate employees (Lazear, 2000) the productivity should be higher soon after such program being issued, thus we have stated next hypothesis:
H4: The ratio of sales per employee has positive relationship with possibility of decision to make issue ESOs.
2.2.5 Firm’s ownership structure
In a study of firm performance using 1979-1980 compensation data for 153 randomly selected manufacturing firms, Mehran (1995) finds that firm performance, measured by Tobin’s Q and ROA, is positively related to the proportion of equity-based compensation, management ownership of stock and options, and research and development expense over
10
sales. This study confirms that, if when ratio of managers shares in total shares high, the firm’s value would increase while if when ratio of director board’s share high, the percent of equity based compensation in total compensation would increase. Also, the firm with directors and outside big shareholders’ ownership high, they would reduce the equity based compensation. Following prior studies, we use the ownership structure’s measures, such as managers’ shares, board of directors’ share and outside big shareholders shares, stated the next hypothesis.
H5-1: The percent of board of directors’ shares negative influence to make a decision to issue ESOs.
H5-2: The percent of managers’ shares positive influence to make a decision to issue ESOs.
H5-3: The percent of outside big shareholders’ shares negative influence to make a decision to issue ESOs.
Table 2- 1: List of previous studies that have explored association between ESOs and different explanatory variables
Res ea rchers Arti cl e Countr
y Sa mp l e Indus tr y Peri od Uni t of a na l ys i s 1 Da vi d Yerma ck, 1995 Do corpora ti ons a wa rd CEO s tock
opti ons effecti vel y? USA 792 1984‐1991 Fi rm
2 連偵均 Zhen Jun, Li a n 2008
員工認股權 , 公司治理特性與盈餘管理
關聯性之研究
TW 671 2002‐2007 Fi rm
3 Jens en & Murphy, 1990 Ma na gers
4 Rya n H.E. & Wi ggi ns R.A. 20
The i nfl uence of fi rm‐ a nd ma na ger‐ s peci fi c cha ra cteri s ti cs on the s tructure of executi ve compens a ti on
USA Both
5 Ma ts una ga , 1994 The effects of fi na nci a l reporti ng
cos ts on the us e of ESOs USA
6 Shu‐Hui , Li n 2009 Why fi rms a wa rds s tock opti ons ? TW 189 a l l 2001‐2003 Fi rm
7 Ga ver & Ga ver, 1993 321 1992
8 Smi th a nd Wa tts , 1992 a l l 1965‐1985
9
10 巴安琪, 2011
The Infl uence of Fi rm‐Speci fi c Cha ra cteri s ti cs on the Is s ua nce of
Empl oye e Stock Opti ons
TW 1099 2001‐2009 fi rm
11
Table 2- 2: Examined firm characteristics in prior studies listed above
Different explanatory variables 1 2 3 4 5 6 7 8 9 10 1 growth opportunity 1 1 2 stock owned by managers 1 1 3 human resource contribution 1 4 RD expenditure 1 1 5 Free cash flow 1 1 1 1 6 Stock bonus and options 1 7 Firm size 1 1 8 Risky management 1 9 Leverage 1 10 Cash bonus 1 11 Ristricted stock 1 12 Industry type 1 1 13 ROA 1 1 14 Market to book ratio 1
1-positive 0-negative /Source: by the study/
CHAPTER 3: RESEARCH DESIGN AND METHODOLOGY
3.1 Selection and definition of variables
This study uses the firm’s growth opportunity (Tobin’s Q), free cash flow, ROA, sales per employee and ownership structures to try to measure the firm-specific characteristics on the issuance of ESOs in Taiwan.
The issuance of ESOs
The dependent variable in the logistic regression is whether a Taiwanese listed firm grants stock options to its employees. (i.e., if a firm grants ESOs =1; otherwise, ESOs=0).
Free cash flow
FCF is cash flow available for distribution among all the securities holders of an organization and it calculated as operating cash flow minus capital expenditures. Free cash flow is important than other measures of financial health because it measures how much cash a company has and can make, it allows a company to pursue opportunities that enhance shareholder value. Without cash, it is tough to develop new products, make acquisitions, pay dividends and reduce dept. In other side, it is important to note that negative FCF is not necessarily a bad thing. If free cash flow is negative, it could be a sign that a company is
12
making large investment. If those investment earn a high return, the strategy has the potential to pay off in the long run.
FCF = Operating Cash Flow – Capital expenditures
ROA
Return on assets calculated with earnings before interests, depreciation and amortization to total asset by percentage. It’s an indicator of how profitable a company is relative to its total assets. The ROA figure gives investors an idea of how effectively the company is converting the money it has to invest into net income. The higher the ROA number, the better, because the company is earning more money on less investment. The formula for ROA is:
ROA = Net Income / Total assets
Firm’s growth opportunity - Tobin’s Q
One frequently used proxy for growth opportunities is Tobin’s Q, named after the late Nobel Prize-winning economist James Tobin. This ratio is frequently regarded as the growth opportunities of the firm under current management. Previous studies find differential announcement effect for well-managed (high q) and poorly managed (low q) bidders, it may means good managers make better decisions than poor managers. Therefore, differential stock price reaction to announcements should exist between well-managed and poorly-managed firms. However, Tobin’s Q is not strictly confined to be measure of firm’s growth opportunity, it can also be a proxy of management quality.
The formula is following: Q= Market capitalization / Total assets
Sales per employee
The sales-per-employee ratio provides a broad indication of how expensive a company is to run. The name indicates how the sales/employee ratio is calculated: a company’s annual sales divided by its total employees. Annual sales and employee numbers are easily located in published statement and annual reports. Interpreting the ratio is fairly straightforward: companies with higher sales-per-employee figures are generally considered more efficient than those with lower figures. A higher sales-per-employee ratio indicates that the company can operate on low overhead costs, and therefore do more with less employees, which often translates into healthy profits.
13
Ownership structure
We use the term “ownership structure” rather than “capital structure” to highlights the fraction of the shares held by inside /director & manager/ and outside /top 10 shareholder/. We used the three kinds of numbers in ownership structure, that managers’ share, board of directors’ share and top 10 outside shareholders’ share, all in percentile in total share.
Managers’ share % = Managers’ share / Total share *100% Directors’ share % = Directors’ share / Total share *100% Top 10 out.share % = Top 10 out.share / Total share *100%
3.2 Sample collection and methodology
Taiwan’s ESOs related regulations were instituted and announced in August 2000 but not adopted by local companies until 2001. Therefore, this study is targeted on Taiwan’s ESO-issuing listed companies during the period from 2001 to 2009. The related data of ESOs
are collected from Taiwan’s Market Observation Post System /http://emops.twse.com.tw// and other related financial information are selected from the Taiwan Economic Journal (TEJ).
Table 3.1 The list of ESO issued firms’ number /please see page 35/
Financial information which contains the following: Free cash flow (FCF), total asset, ROA, Tobin’s Q, sales per employee, directors’ share percent, managers’ share percent and top 10 outside shareholders’ share percent in total shares. If some value of any variables lost on some firms, this firm-year was deleted. As a result, overall 1 dependent variable, 7 independent variables and 14114 firm-years were obtained for analysis. Variables are listed in Table 3.1 and sample selection listed in Table 3.2.
Table 3- 1: The definition and calculating method of each variable
Name Calculate methods
Independent variable
1 Issuance of ESOs ESO if a firm issue ESOs =1; otherwise, ESOs=0 Dependent variables
2 Free cash flow FCF Operating cash flow ‐ Capital expenditures 3 Return on assets ROA Net income / Shareholders' equity
4 Tobin's Q TobQ Market capitalization / Total assets 5 Sales per employee SpE Annual sales / Number of employees 6 Directors' share % Dir % Directors' share / Total share*100% 7 Managers' share % Man % Managers' share / Total share*100%
8 Top 10 out.shareholders' share % Out % Top 10 out.shareholders' share / Total share*100%
14
Using the following logistic regression model, we investigate if the coefficient estimates for each independent variables.
Logit(p) = β + β1*ROA + β2*FCF + β3*Tobin’s Q + β4*SalesEmpl + β5*Dir.share% +
β6* Manag.share% + β7*Top.out 10share%
This equation will tell us the relationship between the independent variables and the dependent variable (issuance of ESO), where the dependent variable is on the logit scale.
Table 3- 2: List of ESO firms /2001-2010/
17
3.3 Study framework
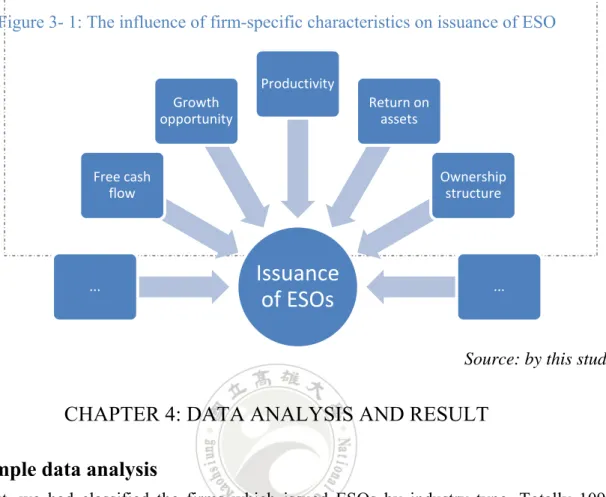
Figure 3- 1: The influence of firm-specific characteristics on issuance of ESO
Source: by this study
CHAPTER 4: DATA ANALYSIS AND RESULT
4.1 Sample data analysis
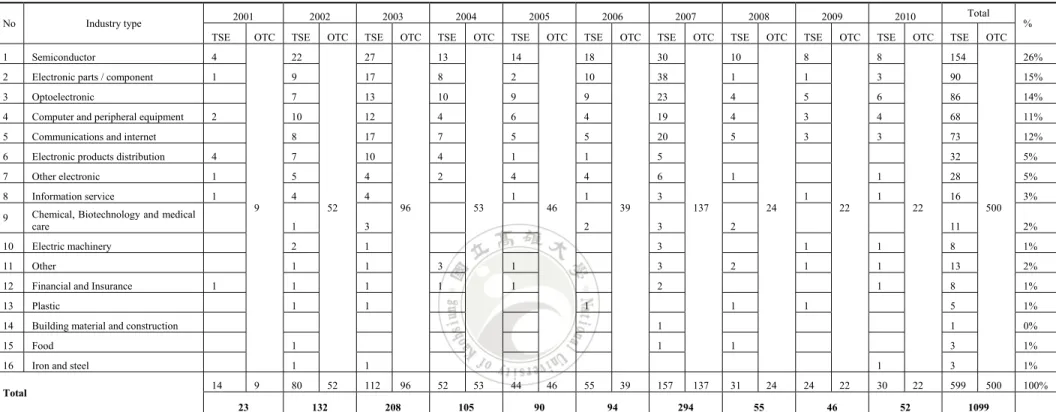
First, we had classified the firms which issued ESOs by industry type. Totally 1099 firms selected and it’s including TSE and OTC market, sample period refers from 2001 to 2010.
Figure 4- 1: The chart-pie of firm insustry classification on issuance of ESOs
Issuance
of ESOs
... Free cash flow Growth opportunity Productivity Return on assets Ownership structure ...Issued ESOs firm classified by industry
Semiconductor Electronic parts / component Optoelectronic Computer and peripheral equipment18
Above figure presents that the high-tech industries which the leading sectors of Taiwan are more likely to issue ESOs for their compensation, including semiconductor, electronics and computer industry firms. In many cases in Taiwan, stock compensation represent a very substantial portion of an employee’s total annual compensation in high-tech industry, unlike in the US where stock ownership may be only a small in the total compensation of an employee. The explanation for this is that the salary level in Taiwan’s high-tech sector is relatively lower than that in subsidiaries of large US multinational corporations, like IBM and HP. Hence, many high-tech firms in Taiwan adopt this sharing scheme to make their total compensation package more competitive in the market, thereby putting them on equal footing in order to attract and retain better personnel.
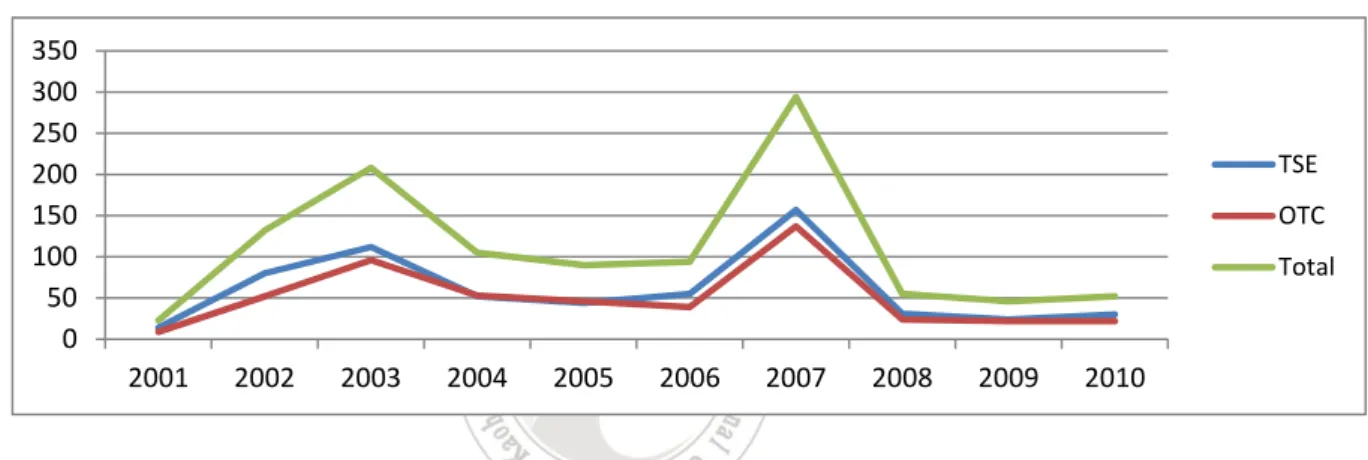
Figure 4- 2: Time trend for number of TSE and OTC firms issued ESOs
In 2001, the Financial Supervisory Commission (FSC) of Taiwan amended the Securities and Exchange Act and since then allowed public firms to grant stock options to their top executives and employees.
From 2001 to 2003 the issuance increased, but from 2003 to 2005 it’s declined because of might be the bad performance of securities market, it affects the stock options’ price performance, and it could cause of why the warrants cannot be the enough motivation. Another reason was the financial accounting standards’ changing that the Accounting Research and Development Foundation (ARDF) of Taiwan issued Interpretations No.70, 71, 72 and 205, requiring firms to use the fair value method or the intrinsic value method to account for their ESOs. Beginning 2004, if choosing to use the fair value method, firms should first measure the fair value of options expense over the vesting period. Alternatively, if firms choose to use the intrinsic value method, they need to disclose the ESO-related expense information in the footnotes to the financial statements as if firms had employed the
0 50 100 150 200 250 300 350 2001 2002 2003 2004 2005 2006 2007 2008 2009 2010 TSE OTC Total
19
fair value method to price their ESOs. In fact, almost all firms choose to use the intrinsic value method; and thus typically recognize nothing in their income statements.
In 2007 August, the ARDF of Taiwan issued Statement No.39, Accounting for Stock-Based Compensation, which requires firms to use the fair value method to account for options granted on or after January 1, 2008. Under No.39 firms do not have to apply retrospective application for options granted prior to 2008; however, they still need to disclose the option-related pro forma information in the footnote for options granted prior to 2008; and meanwhile, recognize ESO-related compensation expense for options granted in 2008. As a result, the shares and warrants that were widely issued by local corporations as forms of employee profit sharing are now required to be market-to-market, with differences recognized through the income statement. For this reason, many companies have applied to the FSC for the issuance of employee stock options prior to the effective date of SFAS No39 (You Quan, Lin 2009). Please see the figure 4.2, the number of ESO-issuing firms spurted in 2007 and went down in 2008.
20
Table 4- 1: Classification of ESO issued firms by industry type
No Industry type 2001 2002 2003 2004 2005 2006 2007 2008 2009 2010 Total %
TSE OTC TSE OTC TSE OTC TSE OTC TSE OTC TSE OTC TSE OTC TSE OTC TSE OTC TSE OTC TSE OTC
1 Semiconductor 4 9 22 52 27 96 13 53 14 46 18 39 30 137 10 24 8 22 8 22 154 500 26%
2 Electronic parts / component 1 9 17 8 2 10 38 1 1 3 90 15%
3 Optoelectronic 7 13 10 9 9 23 4 5 6 86 14%
4 Computer and peripheral equipment 2 10 12 4 6 4 19 4 3 4 68 11%
5 Communications and internet 8 17 7 5 5 20 5 3 3 73 12%
6 Electronic products distribution 4 7 10 4 1 1 5 32 5%
7 Other electronic 1 5 4 2 4 4 6 1 1 28 5%
8 Information service 1 4 4 1 1 3 1 1 16 3%
9 Chemical, Biotechnology and medical
care 1 3 2 3 2 11 2%
10 Electric machinery 2 1 3 1 1 8 1%
11 Other 1 1 3 1 3 2 1 1 13 2%
12 Financial and Insurance 1 1 1 1 1 2 1 8 1%
13 Plastic 1 1 1 1 1 5 1%
14 Building material and construction 1 1 0%
15 Food 1 1 1 3 1%
16 Iron and steel 1 1 1 3 1%
Total 14 9 80 52 112 96 52 53 44 46 55 39 157 137 31 24 24 22 30 22 599 500 100%
23 132 208 105 90 94 294 55 46 52 1099
Note: 547 high-tech industry firms with 93% of total sample data which including semiconductor, electronic components, optoelectronic, computer and peripheral equipment,
communication and internet, electronics product distribution, electronic machinery, information service and other electronic industry had issue the ESOs in last ten years.
21
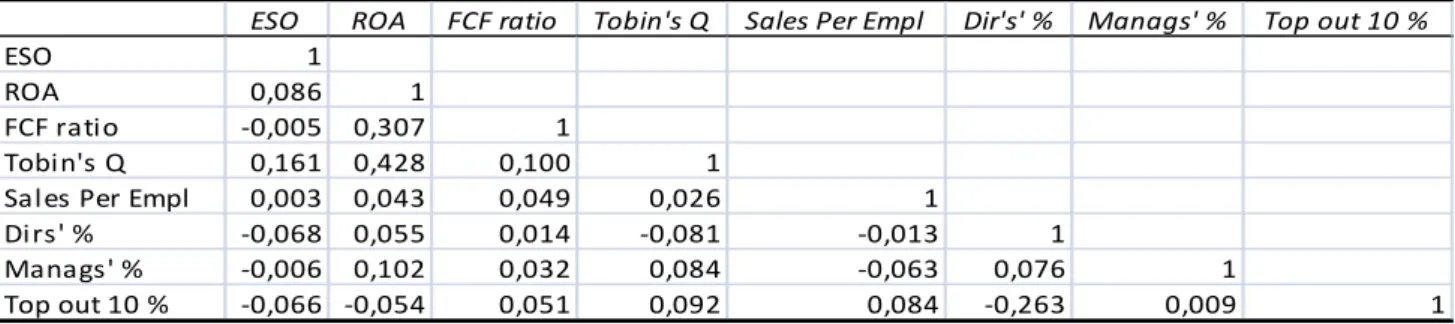
4.2 Descriptive statistics and correlations
After excluding firms with incomplete data, 14114 firm-years remained, composing 964 firm-years with options granted and 13150 firm-years without option grants. Follow Table 4.2 present descriptive statistics on the variables that provides the means, median, standard deviations, minimum, maximum, first and third quartiles. Table 4.3 shows the correlations between variables.
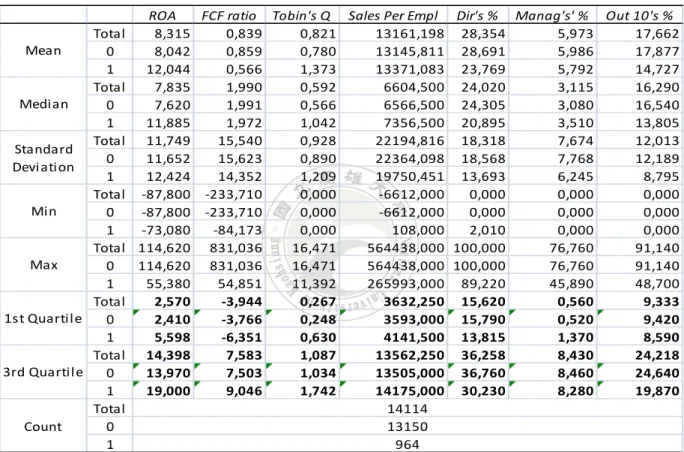
Table 4- 2: Descriptive analysis of each variable
ROA FCF ratio Tobin's Q Sales Per Empl Dir's % Manag's' % Out 10's %
Total 8,315 0,839 0,821 13161,198 28,354 5,973 17,662 0 8,042 0,859 0,780 13145,811 28,691 5,986 17,877 1 12,044 0,566 1,373 13371,083 23,769 5,792 14,727 Total 7,835 1,990 0,592 6604,500 24,020 3,115 16,290 0 7,620 1,991 0,566 6566,500 24,305 3,080 16,540 1 11,885 1,972 1,042 7356,500 20,895 3,510 13,805 Total 11,749 15,540 0,928 22194,816 18,318 7,674 12,013 0 11,652 15,623 0,890 22364,098 18,568 7,768 12,189 1 12,424 14,352 1,209 19750,451 13,693 6,245 8,795 Total ‐87,800 ‐233,710 0,000 ‐6612,000 0,000 0,000 0,000 0 ‐87,800 ‐233,710 0,000 ‐6612,000 0,000 0,000 0,000 1 ‐73,080 ‐84,173 0,000 108,000 2,010 0,000 0,000 Total 114,620 831,036 16,471 564438,000 100,000 76,760 91,140 0 114,620 831,036 16,471 564438,000 100,000 76,760 91,140 1 55,380 54,851 11,392 265993,000 89,220 45,890 48,700 Total 2,570 ‐3,944 0,267 3632,250 15,620 0,560 9,333 0 2,410 ‐3,766 0,248 3593,000 15,790 0,520 9,420 1 5,598 ‐6,351 0,630 4141,500 13,815 1,370 8,590 Total 14,398 7,583 1,087 13562,250 36,258 8,430 24,218 0 13,970 7,503 1,034 13505,000 36,760 8,460 24,640 1 19,000 9,046 1,742 14175,000 30,230 8,280 19,870 Total 0 1 Count 14114 13150 964 Mean Median Standard Deviation Min Max 1st Quartile 3rd Quartile
Note: “Total” rows show the total number of sample, “0” rows present didn’t issue ESOs’ firm-year and “1” rows present issued ESOs’ firm-year which about 7,33% of total firms had issuance.
In the Table 4.2, the mean of ROA between ESO issued firms was 12,044, it’s higher than 8,315 in the total samples. The mean of FCF ratio in the ESO issued firms was 0,566 while it was 0,839 in the total samples. The mean of Tobin’s Q in the ESO issued firms was 1,373, it’s much higher than 0,78 in the did not issue ESO firms while it was 0,821 in the total sample. From here, we can make a simple analyze on firm-specific characteristics that the firms with higher ROA and Tobin’s Q, lower FCF ratio are more likely to issue ESOs to their compensation.
22
From the mean of Sales per employee and Managers’ share percent we could not see any specific, but on the mean of Board of directors’ share and Top outside 10 shareholders’ share percent, we can see that these two variables have negatively relationship with Issuance of ESOs. The failure of hypothesis 4 may arises the various type of industry in this study sample.
Table 4- 3: Correlations between variables
ESO ROA FCF ratio Tobin's Q Sales Per Empl Dir's' % Manags' % Top out 10 %
ESO 1 ROA 0,086 1 FCF ratio ‐0,005 0,307 1 Tobin's Q 0,161 0,428 0,100 1 Sales Per Empl 0,003 0,043 0,049 0,026 1 Dirs' % ‐0,068 0,055 0,014 ‐0,081 ‐0,013 1 Manags' % ‐0,006 0,102 0,032 0,084 ‐0,063 0,076 1 Top out 10 % ‐0,066 ‐0,054 0,051 0,092 0,084 ‐0,263 0,009 1 Note:
4.3 Testing hypothesizes
Table 4.5 present the logistic regression on each variables. Asterisks ***, ** and * denote statistical significant at 0.5%, 5% and 10% levels, respectively.
Variables in the Equation
B S.E. Wald df Sig. Exp(B)
Step 1a ROACEBIDA .012 .003 12.379 1 .000 1.012 FCFTotalasset -.006 .003 6.412 1 .011 .994 TobinsQ .397 .031 160.443 1 .000 1.488 SalesPerEmployee .000 .000 .349 1 .555 1.000 Directorsshare -.023 .002 91.132 1 .000 .978 Managersshare -.007 .005 1.738 1 .187 .993 Topout10 -.036 .003 108.595 1 .000 .965 Constant -1.926 .096 402.046 1 .000 .146
23
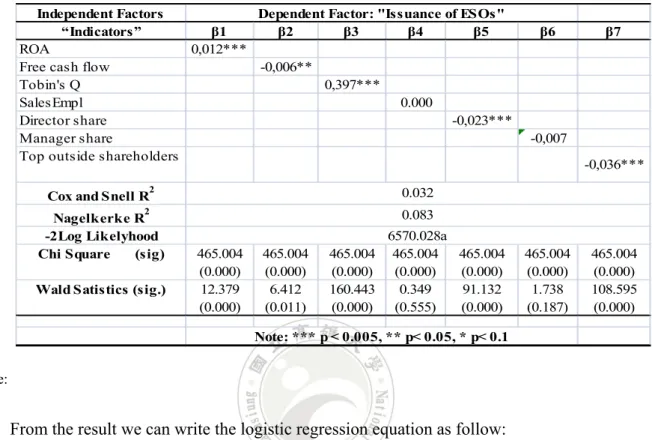
Table 4- 4: Logistic regression coefficients
Independent Factors
“Indicators” β1 β2 β3 β4 β5 β6 β7
ROA 0,012***
Free cash flow -0,006**
Tobin's Q 0,397***
SalesEmpl 0.000
Director share -0,023***
Manager share -0,007
Top outside shareholders -0,036***
Cox and Snell R2 Nagelkerke R2 -2Log Likelyhood
Chi Square (sig) 465.004 (0.000) 465.004 (0.000) 465.004 (0.000) 465.004 (0.000) 465.004 (0.000) 465.004 (0.000) 465.004 (0.000)
Wald Satistics (sig.) 12.379 (0.000) 6.412 (0.011) 160.443 (0.000) 0.349 (0.555) 91.132 (0.000) 1.738 (0.187) 108.595 (0.000)
Dependent Factor: "Issuance of ESOs"
0.032 0.083 6570.028a
Note: *** p < 0.005, ** p< 0.05, * p< 0.1 Note:
From the result we can write the logistic regression equation as follow:
Logit(p)= -1.926 + 0.012*ROA - 0.006*FCF + 0.397*Tobin’s Q - 0.023Dir.% - 0.036Top.10%
The Table 4.5 provides, Return on Asset (ROA, β1=0,012, p value<0.005) and Growth Opportunity (Tobin’s Q, β3=0,397, p value<0.005) are have positive relationship with Issuance of ESOs, thus hypothesizes 1 and 3 are supported.
Free cash flow (FCF, β2=-0.006, p value<0.05); Board of Directors’ share percent in total share (Directors’ share, β5=-0.023; p value<0.005) and Top outside 10 shareholders’ share percent on total share (Top out 10, β7=-0.036, p value<0.005) are have negative relationship with Issuance of ESOs, thus hypothesizes 2, 5 and 7 are supported.
Unfortunately, in our regression result the Sales per Employee (β4=0.000, p value>0.1) and Managers’ share percent on total shares (β6=-0.007, p value>0.1) doesn’t have any relationship with Issuance of ESOs and thus hypothesizes 4 and 6 are did not supported.
24
CHAPTER 5: CONCLUSIONS
5.1 Findings and implications
This study examined how firm-specific characteristics affect a firm’s decision to issue Employee Stock Options for their compensation and it based on a sample of Taiwanese firms listed in TSE and OTC over the period of 2001-2009. We find and confirm that the firms’ growth opportunity and return on assets are significant positive impact on issuance of ESOs, whereas free cash flow, the percent of board of directors’ share and outside shareholders’ share are negatively affect to issuance of ESOs. In other words, firms with highly growth opportunity which means investors have more profitable investment opportunity firms more likely to issue ESOs. Also, if the firm’s return on assets higher which means has efficient management at firm’s assets to generate earnings, they more likely to issue stock options to their employee.
Also, lower rate of free cash flow affects a decision to issue ESOs. The, firm characteristics on the ownership structure, if firm’s board of directors’ share level higher, the probability to issue ESO is lower/ In the finally, if the outside shareholders’ share percent ranking in higher level, this firm may not issue stock options for compensation.
Table 5- 1: Hypothesizes results
Independent Variables - Hypothesizes Related with Issuance of
ESOs Empirical results
H1: ROA Positive Supported
H2: Free Cash Flow Negative Supported
H3: Growth Opportunity - Tobin's Q Positive Supported
H4: Sales per Employee Positive Rejected
H5-1: Directors’ share Negative Supported
H5-2: Managers’ share Positive Rejected
H5-3: Outside top 10 shareholders’ share Negative Supported
Our empirical result differs from previous studies in the ways that: (1) use more large scale data with regard to Taiwan firms that period of 9 years on issuance of ESOs. (2) analyzed the industry type on issuance of ESOs.
25
5.2 Limitation and future research
The biggest limitation of this study might the number of ESO firm-years much lower than non ESO years, that 964 and 13150 relatively. However, we use the total number of firm-years in the logistic regression, it may effects to result of analysis.
26
REFERENCES
連偵均、2009、 員工認股權、公司治理特性與盈餘管理關聯性之研究、國立政治大學會
計學系研究所碩士論文
Alexander.D., Archer.S., International Accounting / Financial Reporting Standards Guide, 2009. APB Opinion 25 Accounting for Stock Issued to Employee
Bartov,E., and P.Mohanram. 2004. Private information, earnings manipulations, and executive stock-options exercise. The Accounting Review Vol.79, No.4, 889-920
Chilin Li, Grace M.Lia, Y.W. Che, 2010. Stock Price Reaction around Announcements of Share-based Payment
Core & Guay, 2001
Do corporations awards CEO stock options effectively?
Gaver,J.J, and K.M.Gaver. 1995. Compensation policy and the investment opportunity set. Financial Management 24 (1): 19-32.
Harley, E.,J.Ryan., R.A.Wiggins. 2001. The influence of firm-and manager-specific
characteristics on the structure of executive compensation. Journal of Corporate finance 7(2): 101-123.
Hsiang-Lan Chen, Yen-Sheng Huang, 2006. Employee Stock Ownership and Corporate R&D expenditures: evidence from Taiwan’s information technology industry
Market Observation Post System Taiwan - http://emops.twse.com.tw/
Jensen and Meckling, 1976. Theory of the Firm: Managerial Behavior, Agency Costs and Ownership Structure
Jonathan C.Mun., 2004. Valuing Employee stock options
27
Rebecca Chyi Woan Tan., 2008. Accounting for Financial Instruments – An investigation of prepaper and User Preference for Fair Value Accounting
SFAS 123R Share Based Payment – USA SFAS No.39 – Share Based Payment /Taiwan/
Shu-Hui, Lin. Why firms awards stock options: Examining the design of Employee Stock Options. Asian Social Science Vol.5, No7, July 2009.
Taiwan Electronic Journal - TEJ
Tzu-Shian Han, Chung-Hua Shen. 2006. The effects of bonus systems on firm performance in Taiwan’s high-tech sector. Journal of Comparative Economics 35 (2007) 235-249.
William Scott, Financial Accounting Theory, 5th edition, Pearson Prentice Hall, New Jersey, USA
Yermark 1995
You Quan, Lin, 2009. Study on the motivation of granting early ESOs in Anticipation of SFAS No.39 in Taiwan, National Chung Cheng University of Taiwan
Ling-Chu lee, Ming-Chun Wang, Chia-Ying Chan. A study of Employee Stock Options pricing in Taiwan
Wen-Yi Lin, Pei-Shan Tsai, 2010. Long-term Performance of the Issuance of Employee Stock Options for firms in Taiwan. Evidence from the Free Cash Flow Theory. International Review of Accounting, Banking and Finance. Vol 2, No.2, Summer 2010 Page 1-22.
James C.Sesil., Maya K.Kroumova, et.al. 2005. Broad-Based Employee Stock Options in the US: Company Performance and Characteristics. The State University of New Jersey.
Tristan Boyd. What determined Early Exercise of Employee Stock Options? University of Western Australia.
Michael Kirschenheiter, Rohit Mathur, Jacob.K.Thomas. June 2004. Accounting for Employee Stock Options. Accounting Horizons Vol. 18, No.2 pp. 135-156