Interactions, Identify Protein Complexes and Proteins
with Multiple Peptide Mass Fingerprints
TZONG-YI LEE,1 JORNG-TZONG HORNG,2,3 HSUEH-FEN JUAN,4 HSIEN-DA HUANG,1 LI-CHENG WU,2 MENG-FONG TSAI,2 HSUAN-CHENG HUANG5 1
Department of Biological Science and Technology & Institute of Bioinformatics, National Chiao-Tung University, Taiwan, Republic of China
2
Department of Computer Science and Information Engineering, National Central University, No. 320, Jung-do Road, Jungli 320, Taiwan, Republic of China
3
Department of Life Science, National Central University, Taiwan, Republic of China 4
Department of Life Science & Institute of Molecular and Cellular Biology, National Taiwan University, Taiwan, Republic of China
5
Institute of Bioinformatics, National Yang-Ming University, Taiwan, Republic of China Received 14 February 2005; Accepted 24 August 2005
DOI 10.1002/jcc.20417
Published online 25 April 2006 in Wiley InterScience (www.interscience.wiley.com).
Abstract:
Proteins “work together” by actually binding to form multicomponent complexes that carry out specific functions. Proteomic analyses based on the mass spectrum are now key methods to determine the components in protein complexes. The protein–protein interaction or functional association may be known to exist among the extracted protein spots while analyzing the proteins on the 2D gel. In this study, we develop an agent-based system, namely AgentMul-tiProtIdent, which integrated two protein identification tools and a variety of databases storing relations among proteins and used to discover protein–protein interactions and protein functional associations, and identify protein complexes and proteins with multiple peptide mass fingerprints as input. The system takes Multiple Peptide Mass Fingerprints (PMFs) as a whole in the protein complex or protein identification. With the relations among proteins, it may greatly improve the accuracy of identification of protein complexes. Also, possible relationship of the multiple peptide mass fingerprints, such as ontology relation, can be discovered by our system, especially in the identification of protein complexes. The agent-based system is now available on the Web at http://dbms104.csie.ncu.edu.tw/⬃protein/NEW2/.©2006 Wiley Periodicals, Inc. J Comput Chem 27: 1020 –1032, 2006
Key words: agent-based system; bioinformatics; proteomics; peptide mass fingerprints; MS
Introduction
Proteomics is the study of all expressed proteins in an organism.1
Proteins are the ultimate performers of important biological func-tions in every type of living organism.2Proteins “work together”
by actually binding, to form multicomponent complexes that carry out specific functions.3Therefore, protein identification is
funda-mentally important to the study of proteomics. The principle of protein identification, using peptide mass fingerprints,4is based on
comparing the list of experimental masses, with a database con-taining the theoretical peptide masses of known proteins.2
Protein Identification
Several proteomic experimental steps are involved in the identifi-cation of a protein. Unidentified proteins are separated by one- or
two-dimensional (1D or 2D) gel electrophoresis, and some protein-specific attributes, such as molecular weight (MW) or isotopic points,5are measured. The separated proteins are digested with an
enzyme and the proteolytic peptides are measured by mass spec-trometry (MS), to obtain peptide mass fingerprints.4
A protein sequence database is then searched to identify the protein matching the PMF, MW and pI. Mass spectrometry, such as matrix-assisted laser desorption and ionization,6and
electros-pray ionization (ESI), as well as the newer spectrometers that are available, have made it possible to analyze proteins, in small concentrations, in a short time.7
Peptide Mass Fingerprinting is a protein identification tech-nique, in which mass spectrometry is used to measure the masses of proteolytic peptide fragments. The protein is identified by
matching the measured peptide masses, with the corresponding peptide masses, from protein or nucleotide sequence databases. The simplest and most obvious scoring method for peptide mass fingerprinting is to count the number of measured peptide masses that have a corresponding entry in a list of calculated peptide masses, within the theoretical mass spectrum of each protein, in the database. Several protein identification tools, available on the Internet, use this method of ranking the proteins in a database, according to the number of matching peptides. For example, PeptIdent (http://us.expasy.org/tools/peptident.html),1 PepSea
(http://pepsea.protana.com/Pa_PepSeaForm.html),8 and PepFrag
(http://www.proteometrics.com/prow/PepFragch.html)9 calculate
a score for the proteins in the database, according to the number of matching peptides.7
Several of the available peptide mass fingerprinting programs have introduced more sophisticated scoring algorithms. These algorithms correct for scoring bias due to protein size, in which larger proteins give rise to a greater numbers of peptides, such as Mowse and MS-Fit (http://prospector.ucsf.edu/ucsfhtmle.2/msfit. htm).6 They also correct for the tendency of smaller peptides in
databases to have a greater number of matches with searched m/z values. Finally, some of these algorithms also apply probability-based statistics to better define the significance of protein identi-fication, such as ProFound and Mascot.
In contrast to the mass spectra of peptide maps, which contain a protein’s global information, peptide fragmentation mass spectra contain rich information on a small section of a protein.2 The
information on the sequence of each peptide enables identification of a protein from a single peptide. Tandem mass spectrometry (MS/MS) can further discover the actual peptide sequence and improve the success rate of protein identification. There are several approaches to using peptide fragment information for protein identification. For instance, SEQUEST (http://thompson.mbt. washington.edu/sequest/) uses data from uninterpreted peptide fragment mass spectra (i.e., information from the whole mass spectrum is used). A crosscorrelation function is calculated, be-tween the measured fragment mass spectrum and the protein sequences in the database, and used to score the proteins in the database. PepFrag9 uses peptide fragment mass information in
combination with other mass spectrometric information, such as amino acid composition, to identify proteins. Mascot10uses the
same probability-based scoring algorithm for fragment informa-tion as for peptide maps. It also supports the use of informainforma-tion from several fragment mass spectra in the database search.
Identifying the Components of Protein Complex
It is known that proteins “work together” by actually binding to form multicomponent complexes that carry out specific functions.3
The association of proteins with each other in cellular systems has come primarily from two types of experiments. The first involves the immunoprecipitation of a protein interest, together with any associated proteins. The second major approach is the yeast two-hybrid system.3
Application of the MS-based proteomic analysis offers a new way to identify the components of multiprotein complexes.11,12
There are two general approaches for MS analysis of protein–
protein interactions and complexes. One is to resolve proteins on a 1D SDS-PAGE gel stain, and to select the protein bands, digest them, and analyze them via MALDI-TOF. Another approach is to digest them directly (without first separating them from each other) and then to analyze the peptide– digest mixture by MALDI-TOF MS or LC-MS-MS.3Other techniques in large-scale protein
anal-ysis identifying mixtures and multiple protein complex can also found in refs. 13–16. Our prototype system MultiProtIdent17tries
to identified multiple protein simultaneously, but drawbacks in-clude: single protein identification may not as well as other iden-tification tool, performance issues, and lock of interaction due to few interaction databases. To further assist the identification of multiple proteins (ex: protein complex), we have developed a new tool namely AgentMultiProtIdent that can identify multiple pro-teins simultaneously with assistance of the protein–protein inter-action information from DIP (http://dip.doe-mbi.ucla.edu),18
STRING (http://www.bork.embl-heidelberg.de/STRING/),19
BIND (http://www.blueprint.org/bind/bind.php),20 and MINT
(http://160.80.34.4/mint/)21databases.
System and Methods
Data Warehousing
AgentMultiProtIdent integrated four databases, comprising pro-tein relationships: DIP (http://dip.doe-mbi.ucla.edu),1 8
STRING (http://www.bork.embl-heidelberg.de/STRING/),19
BIND (http://www.blueprint.org/bind/bind.php),20 and MINT
(http://160.80.34.4/mint/).21The information contained in
pro-tein–protein interaction databases was used by AgentMultiPro-tIdent to analyze relationships among unknown proteins.
The DIP18database documents experimentally determined
pro-tein–protein interactions; up to June 2004, 44,349 interactions had been documented, among 17,048 proteins. STRING19is a database
of known and predicted protein–protein interactions. STRING currently contains 444,238 genes in 110 species. BIND20contains
archived information about interactions, molecular complexes, and pathways occurring among proteins, RNA, DNA, and genes; up to June 2004, 77,732 interactions had been documented, among 32,551 proteins. MINT21is a relational database, designed to store
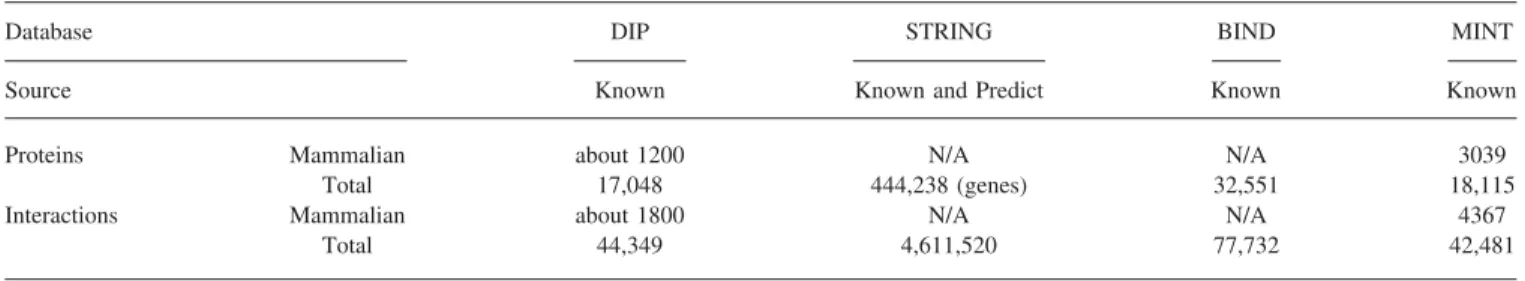
interactions between biological molecules. Presently, MINT con-tains 18,115 interactions among 42,481 proteins. Table 1 shows statistics relating to these four databases. Entries describing inter-actions among proteins from mammalian proteomes are fewer than those from yeast and fruit flies.
AgentMultiProtIdent also integrates gene and protein function databases that offer more relationships among these unknown proteins. The GO (http://www.geneontology.org/) database is used by AgentMultiProtIdent, and is briefly described as follows. The GO (Gene Ontology) database provides structured, controlled vo-cabularies and classifications that cover several domains of mo-lecular and cellular biology, which are freely available for com-munity use in the annotation of genes, gene products, and sequences. GOA (http://www.ebi.ac.uk/GOA) (Gene Ontology Annotation) is an integrated resource of GO annotations to the UniProt Knowledgebase. The GOA database uses the GO vocab-ulary to provide high-quality electronic and manual annotations for
gene products contained in UniProt (Swiss-Prot, TrEMBL, PIR-PSD).5
Agent-Based System
Because each protein identification tool had a different user inter-face, a program interface was created by integrating the summation of the query options of several protein identification tools, acces-sible on the Web, such as Mascot or PeptIdent. In this section, two major technique issues are discussed. One is how to create an agent to determine which parameters to search, in Mascot or PeptIdent; another is how to obtain the result and save it.
First, we must determine how an agent sets the parameters to be searched in Mascot or PeptIdent. An HTTP technique is used in solving the method. The search script in Mascot and PeptIdent Web server will only accept data in “HTTP MultipartPostMethod.” Although most Internet packages such as the java.net package provides basic functionality for accessing resources via HTTP, it does not provide the full flexibility or functionality needed by our agent application of multipart POST applications. Thus, we adapted the freeware software package “Jakarta (http://jakarta. apache.org/commons/httpclient/) Commons HttpClient compo-nent” which provided an efficient, up-to-date, and feature-rich package to implement the client aspect of the most recent HTTP standards and recommendations. The MultipartPostMethod pack-age in the HttpClient component accepted data in HTTP
Multi-partPostMethod, which solved this problem.
The second issue was how to obtain the result data from the protein identification tools. Mascot saves the search results in a “.dat” file; thus, a URL link could be created to link to the search result or retrieve the results at stage 2 of AgentMultiProtIdent. However, PeptIdent does not save search results. Thus, a direct URL link was not available. To overcome this problem, Agent-MultiProtIdent parsed the search results in PeptIdent and created a URL link in AgentMultiProtIdent.
System Flow
We developed AgentMultiProtIdent, a proteomic tool, which iden-tifies multiple proteins through the use of peptide mass fingerprints and possible relationships among proteins. Processing the Agent-MultiProtIdent data consists of two stages: stage 1 is an agent-based system, which identifies PMFs into candidate proteins though Internet; stage 2 is a mining system, which is capable of mining relationships among candidate proteins, by using a data warehouse of protein–protein interaction databases, and gene
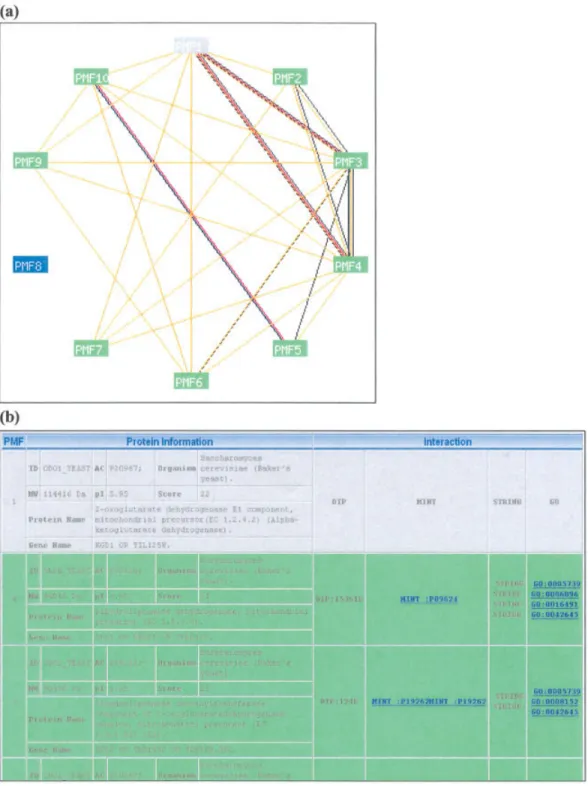
func-tion databases. We discuss each secfunc-tion in detail, as follows. The system flow, showing the two stages of AgentMultiProtIdent, can be seen in Figure 1a.
In Stage 1, we developed an agent-based system that takes the input of multiple PMFs and protein-specific attributes and initiates a protein identification search agent for each PMF, to identify the protein, through an Internet protein identification server, such as PeptIdent or Mascot. Only one of PeptIdent or Mascot can be used exclusively but not combine. The user can choose which identifi-cation to use.
First, the agent-based system in Stage 1 creates an agent for each PMF and protein-specific attribute and sends the information to the protein identification server through the Internet. Next, each agent receives the identification results from protein identification Web server. The system collects each agent’s results and integrates them into lists of candidate proteins, associated with scores that match the input PMF in the protein sequence database.
An AgentMultiProtIdent Stage 1 example is shown in Figure 1b. Ten sets of peptide mass fingerprints (PMF1, PMF2, . . ., PMF10) and related protein-specific attributes were submitted to AgentMultiProtIdent Stage 1. AgentMultiProtIdent created an agent for each pair of PMFs and the protein-specific attributes and performed protein identification with an Internet protein identifi-cation server, such as PeptIdent or Mascot. The identifiidentifi-cation result was then returned to the agent, completing the identification process. The identification scores of PeptIdent and Mascot were different, because they had two different scoring schemes. In PeptIdent, the scores represented the number of measured peptide masses equal to the calculated peptide masses in the theoretical mass spectrum of each protein in the database. However, in Mas-cot, the candidate proteins were ranked with decreasing probability of being a random match to the experimental data.
Next, an agent-based system collected the search results from each agent. The search results were transformed into a uniform format; this comprised lists of candidate proteins associated with scores calculated by the PeptIdent or Mascot scoring function. In Figure 1b, the results represent 10 sets of candidate proteins and scores denoted SPMF1, SPMF2, . . ., SPMF10, respectively. Each candidate protein contained a score calculated by the protein identification scoring algorithm. The candidate proteins in SPMF1
were denoted as A_1, A_2, . . . , A_10 with scores Sa_1, Sa_2, . . . , Sa_10, respectively. Because the candidate protein
with the first ranking in each PMF set may not be the correct protein corresponding to the PMF, the user can select some or
Table 1. The Statistics of DIP, STRING, BIND, and MINT.
Database DIP STRING BIND MINT
Source Known Known and Predict Known Known
Proteins Mammalian about 1200 N/A N/A 3039
Total 17,048 444,238 (genes) 32,551 18,115 Interactions Mammalian about 1800 N/A N/A 4367
Figure 1. (a) The system flow of AgentMultiProtIdent. (b) An example of Stage 1 in
AgentMultiProtI-dent. [Color figure can be viewed in the online issue, which is available at www.interscience.wiley.com.]
all candidate proteins to be analyzed in Stage 2 of AgentMul-tiProtIdent.
Stage 2 of AgentMultiProtIdent analyzes the relationships among the sets of candidate proteins by using a protein relation knowledgebase. Relationships, such as protein–protein interac-tions or functional associainterac-tions, may exist among these candi-date proteins, for example, in a protein complex. With the integration and preprocessing of the information in the knowl-edgebase, protein–protein interactions or functional associa-tions, between each pair of the candidate proteins, can be found if they exist. Figure 2a gives an example, showing the relation-ships among SPMF1, SPMF2, . . . , SPMF10. SPMFn, containing a
set of candidate proteins, n⫽ 1, . . . , 10.
Figure 2b shows a detailed presentation of relationships among SPMF1, SPMF4, and SPMF7. The DIP, STRING, MINT, and GO are represented by the black, red, blue, and green lines, respectively. The protein–protein interactions or functional associations are visualized as an undirected graph G⫽ (V, E), where x, y 僆 V and (x, y)僆 E. Let x and y represent proteins and (x, y) 僆 E represent an interaction or association between proteins x and y.22In
Agent-MultiProtIdent, V refers to all proteins in Swiss-Prot, and E refers to all relationships in knowledgebase. To make the relationship search possible, we first found the subgraph of G, defined as follows,
Let x⬘, y⬘ 僆 V⬘ represent the proteins in candidate protein sets and (x⬘, y⬘) 僆 E⬘ represent a protein–protein interaction or func-tional association between proteins x⬘ and y⬘. The graph G⬘ ⫽ (V⬘,
E⬘), is a subgraph of G, where V⬘ 傺 V and E⬘ 傺 E. In this example,
the 10 sets of candidate proteins SPMF1, SPMF2, . . ., SPMF10were
subsets of V⬘, that is, SPMF1艛 SPMF2&cur; . . .艛 SPMF10⫽ V⬘.
All the edges (x⬘, y⬘) 僆 E⬘ among candidate proteins V⬘ were searched from knowledgebase E.
In addition to offering additional information among these unknown proteins, this information can help improve the accuracy of protein identification. Considering the relationships among
SPMF1, SPMF4, and SPMF7, vertexes A_5, G_4, D_2, and edges
(A_5, G_4), (G_4, D_2) form a connected subgraph of G⬘. In general, A_1, D_1, and G_1 were the first ranking, with the highest score in each candidate protein set. Because false positives do occur in traditional protein identification, due to the quality of MS spectra, parameters, and crosscontamination Keratins,4A_1, D_1,
and G_1 may not be the correct protein. However, A_5, G_4, and
D_2 are more likely to be the correct proteins responding to the
PMFs, and protein–protein interactions may exist among them. We say that A_5, G_4, and D_2 are associated proteins, because there are relationships between A_5 and G_4, as well as between G_4 and D_2.
The associated proteins among candidate proteins, such as A_5,
G_4, and D_2 in Figure 2b, can be seen as a connected subgraph
problem, given n candidate protein sets as SPMF1, SPMF2, . . ., SPMFnand艛 SPMFi⫽ V⬘ for i ⫽ 1 to n. Our goal was to find all
subgraphs of G⬘ denoted as G⬙ ⫽ (V⬙, E⬙), which satisfy the following conditions:
1. G⬙ is a subgraph of G⬘ V⬙ 僆 V⬘, E⬙ 僆 E⬘
2. Every vertex has an edge connected. Given xk僆 V⬙, k ⫽ 1 to n, there exists y⬙ 僆 V⬙ ⫺ xk, such that (xk, y⬙) 僆 E⬙
3. There are no two vertexes from the same candidate proteins set.
For every l⫽1 to n, given xl僆 SPMFw, for some w⫽ n and w ⬎
0 (see lemma 1). For every y⬙ 僆 V⬙ ⫺ xl, y⬙ ⰻ SPMFw,
4. The number of vertex is not more than the number of candidate proteins set. N(V⬙) ⱕ n.
The third condition uses a small obvious lemma as follows:
Lemma 1. Because V⬘ ⫽
写
i⫽1
n SPMFi,
For every x⬙ 僆 V⬘, there exist SPMFjsuch that x⬙ 僆 SPMFj, for some j⫽ n and j ⬎ 0.
In Figure 2b, vertices A_5, G_4, D_2, and edges (A_5, G_4), (G_4, D_2) form a connected subgraph of G⬘, which matched the condition. Vertices D_1, D_5, G_1, and edges (D_1, D_5), (D_5,
G_1) did not match the condition because D_1 and D_5 were from
the same candidate proteins set SPMF4. A weighted score of the
edge (Relationship) between each pair of proteins was calculated by summing up the ranking scores of the two proteins. The score of each candidate protein is shown in Figure 1b, the weighted score of edge (A_5, G_4) was 2(Sa_5⫹Sg_4), because there were two
relationships from DIP and GO. However, (D_5, G_1) was Sd_5⫹ Sg_1. The total score of the connected subgraph “vertices A_5, G_4, D_2, and edges (A_5, G_4), (G_4, D_2)” was 2(Sa_5⫹ Sg_4)
⫹ 2(Sg_4⫹ Sd_2). The score of the connected subgraph is defined
as follows:
S⫽
冘
We (1)where S is the score of the connected subgraph; and We is a weighted score of edge e. The score of the connected subgraph is the sum of all the weighted edge scores for all edges e in the connected subgraph.
Results
AgentMultiProtIdent is a Web-based system. A unified interface was designed so that the user could input more than one set of PMFs and protein specific attributes. Below, we present two groups of results to show how the AgentMultiProtIdent analyzed relationships among candidate proteins. One group shows the results after using the system with the MS spectra from mamma-lian and Pseudomonas Aeruginosa proteomes. The other group used simulated PMFs of the known components of cellular yeast complex from the MIPS database.
MS Spectra from Mammalian and Pseudomonas aeruginosa
One set of MS spectra was offered by Prof. Juan and another by Prof. Huang. The MS spectra TestSet_1 offered by Prof. Juan came from mammals, and the MS spectra TestSet_2 offered by Prof. Huang came from Pseudomonas aeruginosa. We had no prior knowledge of the test set, except for the source organism and the MS spectra. A description of TestSet_1 follows, in which the relationship among unidentified proteins was analyzed.
Figure 2. (a) An example to show the result from Stage 2 of AgentMultiProtIdent. (b) A detailed
representation of relationships among sets of candidate proteins.
There were 10 PMFs from Human liver in TestSet_1. The identification parameters of the 10 PMFs were given equally, as follows: the protein search identification tool used was Mascot; the searched database was Swiss-Prot; the selected species was Homo
sapiens (human); the digested enzyme was Trypsin; the
posttrans-lational modification was Oxidation of Methionine (M); the max-imal tolerance for masses was within 1 dalton; and at most, one missed cleavage was allowed, with the maximum number to list the results being set to 30.23By default, AgentMultiProtIdent was
set to pick the first ranking of candidate proteins in each result list, in order to analyze the relationship among them, as shown in Figure 3. User could choose more candidate proteins in each result, from the identification protein list. In this experiment, we only used the first ranking of candidate proteins.
In Figure 4a, several relationships can be seen among the 10 sets of candidate proteins; the proteins in PMF sets 2, 4, 7, and 10 seem to be isolated from the others, however. The user is able to view the detailed relationship information and the source of these relationships, as shown in Figure 4b.
By pressing the PMF1 in Figure 4a, possible relations as Figure 4b are shown to demonstrate the relationship of proteins in PMF 3, 8, and 9 to the protein in PMF1 (ATPB_HUMAN). The left part of Figure 4b shows the basic protein information such as protein ID, protein accession number, and protein name. The right part shows the possible interaction between these proteins. Figure 4b indicates that all the relationships in this experiment came from the GO
database. This means that although there were no known physical relationships (known protein–protein interactions) among these selected candidate proteins, functional relationships did exist among these proteins, based on the relationship information in the GO database. For example, the candidate protein ATPB_HUMAN of PMF1 had a similar protein function (GO:0005215) to the candidate protein FABL_HUMAN of PMF3. GO:0005215 had a transporter activity of molecular function; the annotated descrip-tion of the reladescrip-tionship is “enables the directed movement of substances (such as macromolecules, small molecules, ions) into, out of, within or between cells.”
MS Spectra from Known Cellular Complex
To validate our approach, protein complexes were used for testing the analysis of multiple PMFs, which had protein–protein interac-tions or functional associainterac-tions among them. In Table 2, we show five sets of test data, including cellular complexes from MIPS (http://mips.gsf.de/)24and some proteins, randomly chosen from
Saccharomyces cerevisiae. Parameter given to
AgentMultiProtI-dent is iAgentMultiProtI-dentical to the Parameter of TestSet_1 and TestSet_2 except species. Here we adapted a simulation of the peptide mass fingerprint.
In Figure 5, we show that computer simulations have been performed to generate PMFs of component proteins in the cellular complex.16For example, the cellular complex cAMP-dependent
Figure 3. Result list of candidate proteins. [Color figure can be viewed in the online issue, which is
protein kinase was composed of four entries: YIL033c, YJL164c, YKL166c, and YPL203w. Corresponding Swiss-Prot protein ID KAPA_YEAST, KAPB_YEAST, KAPC_YEAST,
and KAPR_YEAST were retrieved in step 1 of the simulation. These protein sequences were submitted to theoretical tryptic digestion by PeptideMass
(http://us.expasy.org/tools/peptide-Figure 4. (a)The relationships among the 10 sets of candidate proteins. (b) By pressing the PMF1 in (a),
possible relations are shown to demonstrate relationship of proteins in PMF 3, 8, and 9 to the protein in PMF1 (ATPB_HUMAN). There are five GO relations between ATPB_HUMAN, FABL_HUMAN,FA-BL_HUMAN, and CYB5_HUMAN shown in the right of the page. [Color figure can be viewed in the online issue, which is available at www.interscience.wiley.com.]
mass.html)18 with parameters allowing two missed cleavages
and with some posttranslational modifications in Step 2. To simulate a low coverage of 30%, three peptide masses with missed cleavages ⱕ1 and no posttranslational modification were randomly selected from the theoretical digested peptide masses in Step 3. Each of the randomly selected three peptide masses was added to a random value between⫺1 to ⫹1 daltons in Step 4. Similar mass error tolerance can be found in prior studies.23On the other hand, seven peptide masses were
ran-domly selected with missed cleavages⫽ 2 or with posttransla-tional modifications (PTMs) from the theoretical digested pep-tide masses in Step 5. Finally, the total 10 peppep-tide masses were
treated as simulated PMFs for each protein. The simulated PMFs were then submitted to AgentMultiProtIdent for multiple PMF analysis. Each test data was executed five times, in our simulation.
The second test data was a cellular complex cAMP-depen-dent protein kinase composed of four entries: YIL033c, YJL164c, YKL166c, and YPL203w, whose corresponding Swiss-Prot protein IDs were KAPA_YEAST, KAPB_YEAST, KAPC_YEAST, and KAPR_YEAST, respectively. These four proteins were mixed with six other proteins, randomly selected from Swiss-Prot. A total of 10 simulated PMFs were generated by the previous simulation process. PMF1, PMF3, PMF6, and
Table 2. Five Test Data Sets Include Cellular Complexes from the MIPS Database.
Test data Swiss-Prot ID of each Entries 1 2-oxoglutarate dehydrogenase (YDR148c, YFL018c, YIL125w) ODO1_YEAST, ODO2_YEAST, DLDH_YEAST 2 cAMP-dependent protein kinase (YIL033c, YJL164c,
YKL166c, YPL203w)
KAPA_YEAST, KAPB_YEAST, KAPC_YEAST, KAPR_YEAST 3 2-oxoglutarate dehydrogenase (YIL125w, YDR148c, YFL018c)
and YMR105c
ODO1_YEAST, ODO2_YEAST, DLDH_YEAST, PGM2_YEAST 4 Anthranilate synthase (YER090w, YKL211c) and YDR256C TRPE_YEAST, TRPG_YEAST, CATA_YEAST
5 Anthranilate synthase (YER090w, YKL211c)⫹ Fatty acid synthetase cytoplasmic (YKL182w, YPL231w)
TRPE_YEAST, TRPG_YEAST, FAS1_YEAST, FAS2_YEAST
Figure 5. The flow of generating simulated PMFs. The processes pointed by the dotted line are repeated
PMF9 were represented by KAPA_YEAST, KAPB_YEAST, KAPC_YEAST, and KAPR_YEAST, respectively.
By default, the first ranking candidate protein in each result set was selected to analyze the relationships among them. Assuming it was not known which one was correct, the user could select the top five ranking candidate proteins for analysis. Figure 6a shows the
relationships among these candidate protein sets. In Figure 6b, the cellular complex cAMP-dependent protein kinase, composed of KAPA_YEAST, KAPB_YEAST, KAPC_YEAST, and KAPR_Y-EAST, were successfully identified. KAPA_YKAPR_Y-EAST, KAPB-_YEAST, KAPCKAPB-_YEAST, and KAPR_YEAST were not the first ranking candidate proteins in each result set. Looking at the
Figure 6. (a) A graph shows the relationship among these sets of candidate proteins. (b) Detailed
information about relationships among these candidate proteins (KAPA_YEAST of PMF1 with DIP: 244E and MINT: P04244 is in the bottom of the Web page, which is now shown). [Color figure can be viewed in the online issue, which is available at www.interscience.wiley.com.]
relationship information from DIP, STRING, and MINT, the four candidate proteins KAPA_YEAST, KAPB_YEAST, KAPC_Y-EAST, and KAPR_YKAPC_Y-EAST, may be the correct proteins corre-sponding to PMF1, PMF3, PMF6, and PMF9, respectively.
The third test data was a cellular complex 2-oxoglutarate dehydrogenase composed of three entries: YIL125w, YDR148c, and YFL018c, corresponding to Swiss-Prot protein ID of ODO1_YEAST, ODO2_YEAST, and DLDH_YEAST,
Figure 7. (a) A graph shows the relationships among these sets of candidate proteins. (b) Detailed
information about relationships among these candidate proteins. [Color figure can be viewed in the online issue, which is available at www.interscience.wiley.com.]
respectively. These three proteins were mixed with seven other proteins, randomly selected from Swiss-Prot. A total of 10 simulated PMFs were generated by the previous simulation process. PMF1, PMF3, and PMF4, were represented by ODO1_YEAST, ODO2_YEAST, and DLDH_YEAST, respec-tively.
Here, we also selected the top five ranking candidate pro-teins in each result set to analyze the relationships among these candidate proteins. Figure 7a shows the graphical representa-tion of relarepresenta-tionships among these candidate protein sets. There were many edges among PMF1, PMF3, and PMF4, which corresponded to ODO1_YEAST, ODO2_YEAST, and DLDH-_YEAST, respectively. By clicking on the block chart of PMF1 in Figure 7a, the user was able to observe the detailed infor-mation of the candidate protein relationships of PMF1, as shown in Figure 7b. There was information of several relation-ships from DIP, STRING, and MINT, so the three candidate proteins ODO1_YEAST, ODO2_YEAST, and DLDH_YEAST may be the correct proteins corresponding to PMF1, PMF3, and PMF4, respectively.
Another finding showed that the identification processes of the sets of five cellular complexes, from MIPS, were identified correctly. The results of multiple PMF analysis, using interac-tion data from DIP, MINT, and BIND databases, performed better than interaction results from GO and STRING databases. Because of the quantity and quality of the predicted functional associations of STRING and GO, there are still false positives in the identification of protein complexes. On the other hand, most of the protein–protein interactions of the DIP database focused, mainly, on Drosophila melanogaster and
Saccharomy-ces cerevisiae (baker’s yeast), as the protein–protein
interac-tions of other organisms were lesser than these two.
Table 3 shows a comparison of the AgentMultiProtIdent and other popular protein identification tools. CombSearch (http://
us.expasy.org/tools/CombSearch/) is capable of querying sev-eral protein identification tools, simultaneously, through the Web, including PeptIdent, MultiIdent, MS-Fit, Mowse, and ProFound. The major feature of the AgentMultiProtIdent is the ability to identify multiple proteins though Internet, with the assistance of protein–protein interaction. Instead of a small interaction network, slow performance, and proprietary identi-fication engine of our prototype MultiProtIdent,17
AgenttMul-tiProtIdent is a smart agent system that takes advantage of other high accuracy identification tools and variety of interaction databases.
Discussion and Conclusion
AgentMultiProtIdent is the first protein identification tool able to identify multiple proteins simultaneously, and combine the infor-mation of protein–protein interactions or functional associations in protein identification. Relationships such as protein–protein inter-actions or functional associations may exist among proteins ex-cised from the same 1D/2D gel or when comparing two 2D gels. The results show that multiple PMF analysis has high precision, when applied to the identification of a protein complex. The results also show that an ontology relationship may be discovered via the AgentMultiProtIdent. Especially in the identification of protein complexes, the advantage of the existing protein–protein interac-tion databases can improve identificainterac-tion accuracy.
We plan to add more protein–protein interaction databases, such as MIPS and KEGG (http://www.genome.ad.jp/kegg/)25in
the further works. The KEGG pathway database will be added as a first priority; this will offer a detailed biological process for identifying multiple proteins sharing undirected interactions. There are several aspects to be considered for future study. For multi-plicity, the sequence tags of proteins can be submitted to the
Table 3. A Comparative Table of AgentMultiProtIdent and Other Popular Protein Identification Tools.7
Name MS type Other input PTM Note
PeptIdent MS None Cys blocking and Met oxidation making extensive use of database annotations MultiIdent MS AA⫹ sequence tag Cys blocking and Met oxidation None
MS-Fit MS AA Predefine partial and complete None MOWSE MS AA⫹ sequence tag None None
Mascot MS and MS/MS None Predefine partial and complete Probability based scoring function CombSearch MS AA⫹ sequence tag Predefine partial and complete Provide a unified interface to query several
protein identification tools accessible on the Web
MultiProtIdent MS and MS/MS AA⫹ sequence tag Predefine partial and complete 1. Allow user to input more than one PMF and MS/MS spectra
2. Find relations among DIP and STRING AgentMultiProtIdent MS and MS/MS AA⫹ sequence tag Predefine partial and complete 1. Agent base takes advantage of other
identification tool
2. Allow user to input more than one PMF and MS/MS spectra
3. Find relations among candidate proteins on various databases
AA represents amino acid composition and MS/MS represents tandem mass spectrometry.
system for identification of multiple proteins. For accuracy, the scoring function of our protein identification, and the weighting function of the interaction between proteins, will be refined; post-translational modification will also be considered. A visualization interface, showing the interaction, is also being considered, as well as a graph layout algorithm, to be used to draw the relationships of the multiple PMF analysis result.26
We are thankful for the two sets of MS spectra, one offered by Prof. Juan and another offered by Prof. Huang.
References
1. Wilkins, M. R.; Williams, K. L. J Theor Biol 1997, 186, 7. 2. Fenyo, D. Curr Opin Biotechnol 2000, 11, 391.
3. Liebler, D. C. Introduction to Proteomics. Tools for the New Biology; Humana Press Inc.: Totowa, NJ, 2002.
4. Ding, Q.; Xiao, L.; Xiong, S.; Jia, Y.; Que, H.; Guo, Y.; Liu, S. Proteomics 2003, 3, 1313.
5. Apweiler, R.; Bairoch, A.; Wu, C. H.; Barker, W. C.; Boeckmann, B.; Ferro, S.; Gasteiger, E.; Huang, H.; Lopez, R.; Magrane, M.; Martin, M. J.; Matale, D. A.; O’Donovan, C.; Redaschi, N.; Yeh, L. S. Nucleic Acids Res 2004, 32(Database issue), D115.
6. Clauser, K. R.; Baker, P.; Burlingame, A. L. Anal Chem 1999, 71, 2871.
7. Beavis, R. C.; David F. Proteomics 2000, 1, 641.
8. Mann, M.; Hojrup, P.; Roepstorff, P. Biol Mass Spectrom 1993, 22, 338.
9. Fenyo, D.; Qin, J.; Chait, B. T. Electrophoresis 1998, 19, 998.
10. Perkins, D. N.; Pappin, D. J.; Creasy, D. M.; Cottrell, J. S. Electro-phoresis 1999, 20, 3551.
11. Ho, Y.; Gruhler, A.; Heibut, A.; Bader, G. D.; Moore, L. Nature 2002, 415, 180.
12. Gavin, A. C.; Bosche, M.; Krause, R.; Grandi, P.; Marzioch, M.; Bauer, A. Nature 2002, 415, 141.
13. Park, Z. Y.; Russell, D. H. Anal Chem 2001, 73, 2558. 14. Eriksson, J.; Fenyo, D. J Proteome Res 2005, 4, 387.
15. Washburn, M. P.; Ulaszek, R. R.; Yates, Y. R., 3rd. Anal Chem 2003, 75, 5054.
16. Christophe Masselon, L. P.-T.; Lee, S.-W.; Li, L.; Anderson, G. A.; Harkewicz, R.; Smith, R. D. Proteomics 2003, 3, 1279.
17. Huang, H.-D.; Lee, T. Y.; Wu, L. C.; Lin, F. M.; Juan, H. F.; Horng, J. T.; Tsou, A. P. J Proteome Res 2005, 4, 690.
18. Xenarios, I.; Salwinski, L.; Duan, X. J.; Higney, P.; Kim, S. M.; Eisenberg, D. Nucleic Acids Res 2002, 30, 303.
19. Christian von Mering, M. H.; Jaeggi, D.; Schmidt, S.; Bork, P.; Snel, B. Nucleic Acids Res 2003, 31, 258.
20. Bader, G. D.; Betel, D.; Hogue, C. W. Nucleic Acids Res 2003, 31, 248.
21. Zanzoni, A.; Montecchi-Palazzi, L.; Quondram, M.; Ausiello, G.; Helmer-Citterich, M.; Gesareni, G. FEBS Lett 2002, 513, 135. 22. Han, K.; Ju, B. H. Bioinformatics 2003, 19, 1882.
23. Gras, R.; Muller, M.; Gasteiger, E.; Gay, S.; Binz, P. A.; Bienvenut, W.; Hoogland, C.; Sanchez, J. C.; Bairoch, A.; Hochstrasser, D. F.; Appel, R. D. Electrophoresis 1999, 20, 3535.
24. Mewes, H. W.; Amid, C.; Arnold, R.; Frishman, D.; Guldener, U.; Mannhaupt, G.; Munsterkotter, M.; Pagel, P.; Strack, N.; Stumeflen, V.; Warfsmann, J.; Ruepp, A. Nucleic Acids Res 2004, 32, D41. 25. Kanehisa, M., Goto, S.; Kawashima, S.; Nakaya, A. Nucleic Acids Res
2002, 30, 42.