Abstract
This work examines ERS-1 (the first European Remote Sensing Satellite) SAR (Synthetic Aperture Radar) water surface wave images over Hualien of Taiwan, indicating that the vari-ation of SAR signals in space domain is similar to in situ wave data’s in time domain. Some statistical properties of SAR data are investigated. The Rayleigh distribution function closely corresponds with the histogram of wave heights, but the Gaussian one cannot for water surface displacements. Evidence reveals that SAR wave signals do not respond well to actual ocean waves effectively. As wave spectral analysis of available SAR data reveals, the appropriate sample size of SAR wave image, sampling average, and moving average should be taken carefully to accurately confirm directional power spectra. Moreover, SAR spectra are compared with in situ ones, confirming that peak frequencies correlate well and wave directions approxi-mately agree with each other. Some differences between both spectral shapes remain somewhat unclear and require further study. Nevertheless, in this study, ERS-1 SAR power spectra veri-fied the feasibility of deriving an appropriate dominant wave direction and peak frequency.
1998 Elsevier Science Ltd. All rights reserved.
Keywords: Directional spectrum analysis; Ocean surface wave; SAR; Remote sensing
1. Introduction
Observing ocean surface waves using conventional wave instruments such as wave gauges, wave riders, and ultrasonic wave meters is a relatively difficult task. More
* Corresponding author. Present address: Building 24, 195-6 Chung-Hsing Road, Hsinchu, Taiwan 310, Republic of China. E-mail: [email protected]
0029-8018/99/$—see front matter1998 Elsevier Science Ltd. All rights reserved. PII: S 0 0 2 9 - 8 0 1 8 ( 9 8 ) 0 0 0 5 8 - 4
specifically, deploying, monitoring, and retrieving instruments are of particular con-cern. The wave data cannot always be acquired as generally expected owing to loss, damage, or malfunctioning of instruments. In addition, conventional wave instru-ments can record only time series data and cannot directly observe the spatial change of a wavefield. In contrast, the remote sensing technique can rapidly obtain synoptic information involving the wide ocean wavefield, thereby making it a preferable auxiliary tool over conventional ones.
The visible bands of SPOT, although capable of depicting ocean surface waves (Populus et al., 1991), can function only during the daytime. SAR images are differ-ent from visible ones. It is an active radar, capable of penetrating clouds and moisture in the air to observe the ocean surface waves, regardless of day or night. Information regarding a wavefield derived from SAR images at sea during poor climates, parti-cularly as a typhoon approaches, is quite valuable for coastal engineering construc-tion in terms of safety and economic feasibility. Previous investigators have used SAR images to observe ocean surface waves (Gonzales et al., 1979; Atul et al., 1982) since the launching of SEASAT in 1978. However, a comprehensive solution using SAR to image water surface waves is still lacking. Of particular concern, the SAR image spectrum is not actually representative of the actual water surface displacement spectrum. The power spectra of SAR images are a transformation of the sea surface’s directional slope spectrum via modulation transfer function (MTF) (Alpers and Hasselmann, 1978). The effects of surface waves’ motion on the SAR imaging mechanism still remains unclear (Alpers and Bru¨ning, 1986; Monaldo et al., 1993). Therefore, many studies of SAR imaging water surface waves are cur-rently underway (Charriez and Olagnon, 1995; Rufenach et al., 1995).
This study uses SAR wave images to estimate the directional wave spectrum. In general, wave length (or wavenumber) and direction can be evaluated. However, the variation of water surface (wave height) is presented in SAR image only with gray level and not well calibrated with in situ data presently, thereby not allowing wave height to be estimated precisely in terms of quantity. Although not easily derived from SAR images, the wave height (energy) can be easily obtained by other means such as conventional methods, an altimeter or wind wave forecasting models. On the other hand, SAR image can directly derive the wavenumber spectra instead of frequency spectra which are extensively and popularly used in engineering design. Therefore, this study attempts to obtain frequency spectra from SAR data. In order to know how well the SAR signal can respond to actual water surface waves, the differences of wave characteristics between SAR signals and in situ data were inves-tigated through statistical techniques. Owing to that their relationship remains some-what unclear, SAR power spectra must be carefully applied to ocean engineering. 2. SAR data and wave image properties
2.1. EAS-1 SAR images
ERS-1 SAR scans and receives radar echo in 5.3 Hz frequency, i.e. C-band. Each
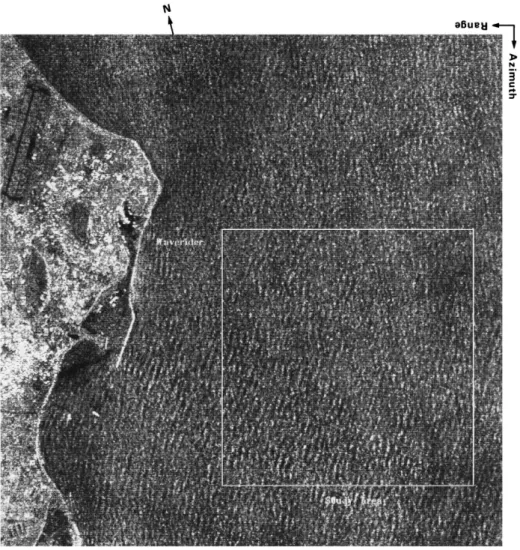
SAR images with information regarding water surface waves do not directly present the actual variation in water surface. Those images belong to a temporary photography process and are recorded radar echoes in digital count as gray levels. Factors such as SAR view angle, satellite track heading, and wave motion effects such as surface titling, hydrodynamic interactions, and velocity bunching (Stewart, 1985) may affect radio echoes. The images’ wavelike patterns are not an actual wave pattern and, subsequently, may be deformed by these factors. From another view, in spite of those factors affecting SAR imaging, SAR wave signals will be checked and focused on their statistical properties and probability distribution in advance. If the probability distribution of SAR wave signals is similar to the actual ocean waves, we have reason to think that the SAR wave signal can give us some important information concerning ocean waves. Wave properties over a coastal zone are easy influenced by bottom slope. Avoiding this bottom influence, the SAR image of deep water waves was chosen to be investigated. The study area depicted in Fig. 1 was selected for SAR signal analysis. A waverider was located about 1 km distant from the upper-left corner of this study area.
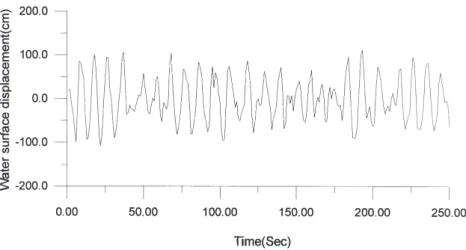
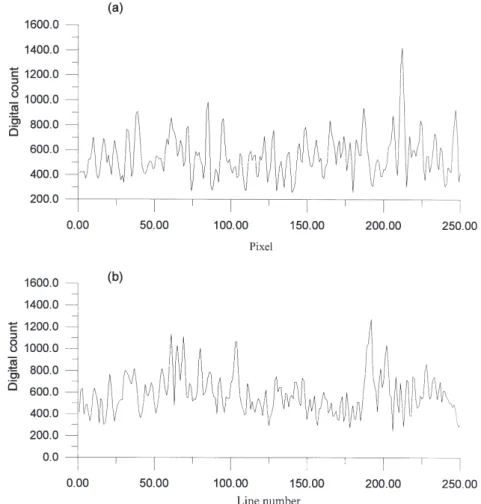
Ocean waves dominate SAR signals if the sea states are high. According to a previous study (Gonzales et al., 1979), SAR images have a satisfactory and clear wavelike pattern in the sea states of a significant wave height above 2 meters. In the case of sea states shown in Fig. 1 they were approaching to high ones, wave height was 1.69 meters (as indicated in in situ wave data of Fig. 2). The orthogonal components of spatial signals (Fig. 3) should be regarded as wave signals due to the SAR image’s apparent wavy pattern. The SAR wavelike signals apparently do not have the exact shape as those in situ wave data. Fig. 2 depicts portions of the time series wave data, as measured by a waverider. Comparing Fig. 2 and Fig. 3 reveals more zigzagging between every trough and crest in SAR wave signals than in situ wave data. Owing to such a tendency, different wave characteristics can be derived from SAR image and in situ wave data. Importantly, actual wave signals must be retrieved and noise removed from SAR images as well.
Herein, the zero-upcrossing method and crest-to-crest method were applied to cal-culate the total number of wave heights for any line of SAR wave images. Total
Fig. 1. The part image of a SAR scene over Hualien of eastern Taiwan, as acquired from CSRSR on November 26, 1993, 10:30 TLT. The wave image of study area with 512⫻ 512 pixels is gridded into sixteen (4⫻ 4) subimages (128 ⫻ 128 pixels) named (a)–(p) from left to right and top to bottom as shown below.
(a) (b) (c) (d)
(e) (f) (g) (h)
(i) (j) (k) (l)
Fig. 2. In situ wave data obtained from a waverider simultaneously as this SAR image for study.
numbers of wave N0 and N1 were derived from zero-upcrossing method and
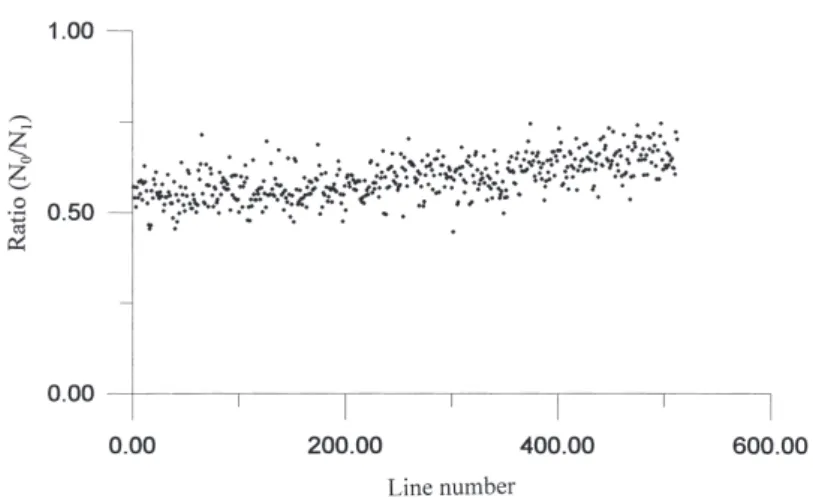
crest-to-crest method, respectively. The ratio N0/N1 approaching unity implies that SAR
wave signals had only a slight amount of noise. The 512 pixels by 512 pixels of the arbitrary SAR subimage covering the deep waters, located east of the Hualien harbor, was selected for analysis. By selecting any direction such as on the right
side of the SAR image, the values of N0/N1were calculated with 512 pixels in each
line. 512 lines were calculated. 512 values of N0/N1 were distributed in the range of
0.5 to 0.7, with its average of 0.6 denoted in Fig. 4. On the other hand, the ratio calculated from in situ time series wave data was approaching unity (0.92). This finding suggests that SAR wave signals are more zigzagged than in situ data. There-fore, we believe only a slight amount of noise could be found in the SAR wave signals, possibly accounting for the following spectral analysis yielding poor results for the directional spectra.
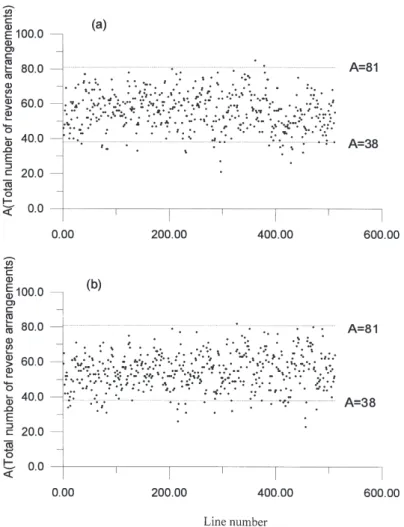
2.3. The stationary property of SAR wave images
A circumstance in which random data have stationary properties is quite desirable for statistical analysis. SAR wave images belong to a type of random data in space domain. Herein, we define “stationary” as a situation in which the statistics obtained from SAR wave image do not vary over different ocean areas. The reverse arrange-ments test is applied as a test for stationarity (Bendat and Piersol, 1986). Consider a sequence of M observations of random data and count the total number of reverse arrangements denoted by A. Assume that the data are stationary. This hypothesis
would be acceptable at the ␣ level of significance. The acceptance region for this
hypothesis is
[AM;1⫺␣/2⬍ A ⱕ AM;␣/2]
Fig. 3. Variation in wave signals of SAR image in (a) the X direction on the right side of the image, (b) the Y direction on the lower side of the image.
Those parameters can be used to examine the stationarity of SAR wave signals. By
selecting the same study area of the subimage of 512⫻ 512 pixels mentioned above,
512 pixels in a line were divided into sixteen groups with thirty-two pixels in each group. Mean and variance calculated with the thirty-two pixels were used as the random data to examine the stationarity. 512 values of A were calculated for 512 lines. Fig. 5(a) and (b) summarize the results obtained from a reverse arrangements test for mean and variance of SAR data, respectively. The stationary hypothesis should be acceptable at 5% level of significance if A falls within the range of 38 to 81. As Fig. 5 clearly indicates, SAR wave signals generally have stationary proper-ties.
Fig. 4. The ratio (N0/N1) of total numbers of wave for 512 lines of the SAR image, N0and N1calculated
by zero-upcrossing method and crest-to-crest method, respectively.
2.4. Probability distribution of SAR wave signals
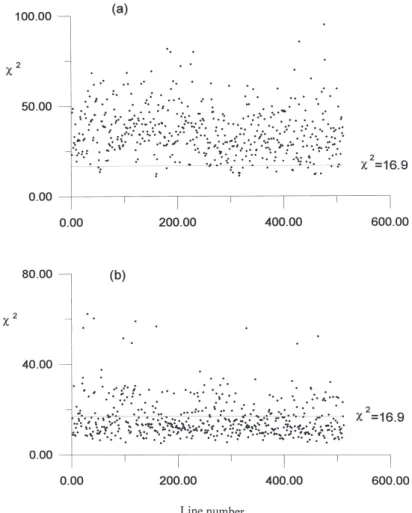
For ocean gravity waves, the Gaussian distribution is generally applicable to the probability distribution of water surface displacements and the Rayleigh distribution has been usually applied to describe wave heights (Tucker, 1991). Herein, we ana-lyzed and manipulated SAR wave signals as histograms of water surface displace-ments and wave heights. Those histograms were used to correlate with Gaussian and Rayleigh distribution functions by the chi-square goodness-of-fit test. With the degrees of freedom determined to be 9 and at the 5% significance level, it should
be a2 value smaller than 16.9 if the probability distribution can be accepted. The
Gaussian distribution function could not correlate well with the histogram of water surface displacements as shown in Fig. 6(a). However, the Rayleigh distribution function closely corresponded to the histogram of wave heights as shown in Fig. 6(b). From the investigation, it is found that the SAR wave signals do not completely respond to actual ocean waves.
3. Methodology and data processing for directional power spectra 3.1. Spatial Fourier transform
A SAR image is a 2-D (two-dimensional) sampling of the backscattering strength of satellite radar echoes of the sea surface over an area of 100 km by 100 km. The subscene covers the study area and the location of a waverider acquiring in situ wave data. Results obtained from the SAR data are then compared with those of in situ
wave data. All of the pixels are assumed here to be squares of length ⌬x equalling
12.5 m on each side. As Eq. (1) shows, let X(m1, m2) be the digital value of a pixel
Fig. 5. The reverse arrangements test for (a) mean and (b) variance of SAR wave data, respectively.
transform is used to derive the wavenumber spectra from the SAR images. Fourier coefficient represented by discrete type is defined as
F(kxky)⫽ 1 N2
冘
N⫺ 1 m2⫽ 0冋
冘
N⫺ 1 m1⫽ 0 X(m1,m2)·e−inx·k0·m1·⌬x册
·e−iny·k0·m2·⌬x (1)where k0 ⫽ 2/D, D ⫽ N·⌬x ⫽ the linear size of the subscene of the SAR image,
nx·k0 ⫽ kx ⫽ wavenumber in x the direction, ny·k0 ⫽ ky ⫽ wavenumber in y the
direction, nxand ny ⫽ 1, 2, 3, . . ., N.
In fact, computations are performed via Fast Fourier Transforms, thereby limiting
the choice of N to the power of 2, i.e. N⫽ 2p (p ⫽ 1, 2, . . .). The spectral power
Fig. 6. The chi-square goodness-of-fit test for (a) water surface displacements, and (b) waveheight, of 512 lines of the SAR wave image.
3.2. Wavenumber spectrum
The 2-D power spectrum can be derived by the 2D-Fourier coefficient,
(kx,ky)⫽ 兩F(kx,ky)兩2 (2) For the feasibility of comparing with in situ data and engineering applications, the wavenumber power spectrum should be transformed into frequency power spectrum. The wavenumber power spectrum is initially transformed from the Cartesian coordi-nate system into the polar coordicoordi-nate system. The wavenumber power spectra in the Cartesian coordinate system and in the polar coordinate system have the following relationship (Tucker, 1991):
One-dimensional wavenumber power spectrum (k) can be derived by integrating the 2-D wavenumber power spectrum in all directions. That is,
(k) ⫽
冕
2
0
(k,)d (4)
3.3. Frequency power spectrum
The frequency power spectra are widely and popularly applied to ocean engineer-ing. For conveniences of comparison with in situ data and ocean engineering appli-cation, SAR wavenumber spectra should be translated into frequency power spectra. In general, ocean waves are stationary and ergodic over open sea. The total wave energy computed from the frequency (f) domain and the wavenumber (k) domain should be equal, i.e.,
冕
⬁ 0冕
2 0 (f,)·df·d ⫽冕
⬁ 0冕
2 0 (k,)·dk·d (5)Therefore, the directional frequency power spectrum can be calculated in the follow-ing form:
(f,) ⫽ (k,)· dkdf (6)
dk/df in Eq. (6) can be calculated via the wave dispersion relation:
(2f)2⫽ gk tanh(kh) (7)
where g denotes the acceleration of gravity, h represents the water depth of the calculation area.
The directional frequency power spectrum can be obtained by considering the case of deep water or uniform water depth h. In these conditions, basically the bottom slope must be zero or small and the wavelength variation should be small in the
calculation area. Next, the omni-directional frequency power spectrum(f) can be
calculated by integrating the directional frequency power spectrum over all direc-tions:
(f) ⫽
冕
2 0
Fig. 7(a)–(d), respectively. As this figure indicates, wave energy distribution in the
power spectrum for the sample size of 512 ⫻ 512 pixels has better resolution than
that of 64⫻ 64 pixels. Finding the dominant wave energy distributed in the power
spectrum of Fig. 7(a) is quite difficult owing to the low resolution. The power
spec-trum of Fig. 7(b), as derived from a sample size of 128⫻ 128 pixels wave image,
clearly exhibits the dominant energy peak. Although there is a distinct energy peak in power spectra of Fig. 7(c) and (d) separately, more trival spectral energy also arises around its energy peak. It proved that the wavefield is also homogeneous in larger sample area but high resolution sample resulted in more trival spectral energy. Nevertheless, it need not waste more time in deriving the power spectrum and finding
its energy peak from larger sample size than 128⫻ 128 pixels. This finding suggests
that the sample size of 128⫻ 128 pixels can optimally calculate the power spectrum
and get adequate wave characteristics.
4.2. Moving average and sampling average
Before FFT, moving average of raw SAR wave images is a low pass filter so that the noise can be reduced and the discontinuity in wave images can be removed as well. However, it also might eliminate some short waves with high frequency. Fig.
8 depicts the spectrum achieved by the moving average with masks of 5⫻ 5 before
FFT. According to this figure, some short waves with a high wavenumber were eliminated. Moving average before FFT should be carefully performed in raw SAR wave images to avoid losing the waves that require analyzing.
Regarding the moving average of power spectrum after FFT, the random error arising from the processing of FFT must be eliminated. In contrast, moving average with a large mask significantly reduces the resolution of the power spectrum. An appropriate mask of moving average should be determined to remove the random error and, ultimately, achieve a better resolution of power spectrum after FFT.
Regarding the SAR wave image of 128 pixels by 128 pixels, a 3 ⫻ 3 mask of
moving average is appropriate to achieve a good result in this study.
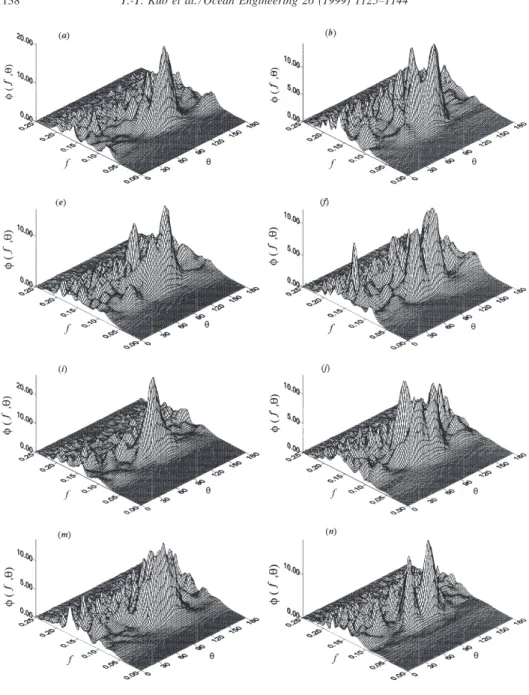
Sampling average is another method capable of removing random errors of power spectrum after FFT. Herein, a SAR wave image of the study area, 6400 meters by
Fig. 7. SAR directional wave spectra for various sample sizes of (a) 64 ⫻ 64, (b) 128 ⫻ 128, (c) 256 ⫻ 256, and (d) 512 ⫻ 512 pixels (wave direction in degree, frequency in Hz, and wave spectra in an arbitrary unit).
⫻ 5 mask before FFT.
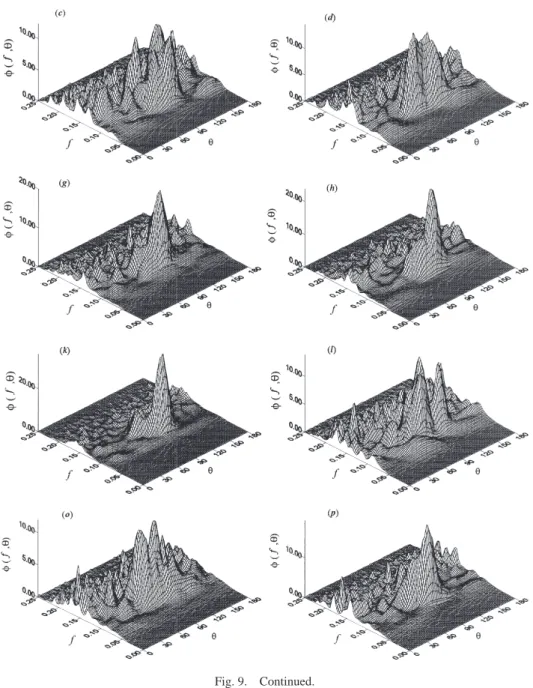
6400 meters, is divided into sixteen sub-images of 128 pixels by 128 pixels. Fig. 9(a)–(p) depict the sixteen power spectra derived from these sub-images. Fig. 9(a) displays the same power spectrum as Fig. 7(b). Although the SAR wave sub-images all belong to stationary phase, some differences arise between these power spectra. Such differences should be regarded as random errors, and subsequently be improved by averaging the samples. Fig. 10 depicts the power spectrum of sampling average for all sixteen samples. This figure confirms resolution and precision in frequency and wave direction.
Poor SAR images with low SNR (signal to noise ratio) are extremely difficult to analyze and obtain wave characteristics such as wavelength and wave direction. Satisfactory SAR wave images with a clear wavy pattern and high SNR can derive actual wave characteristics by less processing of the sampling average. These satis-factory SAR images described above are seldom acquired in Taiwan, thereby it is necessary to derive better wave characteristics, more similar to actual ones, from SAR images using the appropriate image size and sampling average mentioned above.
5. Comparison and verification with in situ wave data
The ERS-1 SAR image was acquired during phase C (i.e. 35 day repeat cycle) and applied to this study. The sea states of this case are shown in SAR waveimage of Fig. 1. A wave observation station was located at an offshore area of Hualien harbor. Its position was about 1 km distant from the upper-left corner of the study area. The Institute of Harbor and Marine Technology (IHMT) of Taiwan routinely
accumulated the in situ wave data by a waverider buoy deployed at (24°0⬘0⬙N,
121°38⬘24.5⬙E), outside of the east breakwater of Hualien Harbor. The waverider’s sampling rate was 1.28 Hz and the sea surface elevation was recorded for twenty minutes at two-hour intervals.
Fig. 9. Sixteen SAR directional wave spectra (a)–(p) derived from continuous 4⫻ 4 subimages and each subimage with 128 by 128 pixels (wave direction in degree, frequency in Hz, and wave spectra in an arbitrary unit).
Fig. 9. Continued.
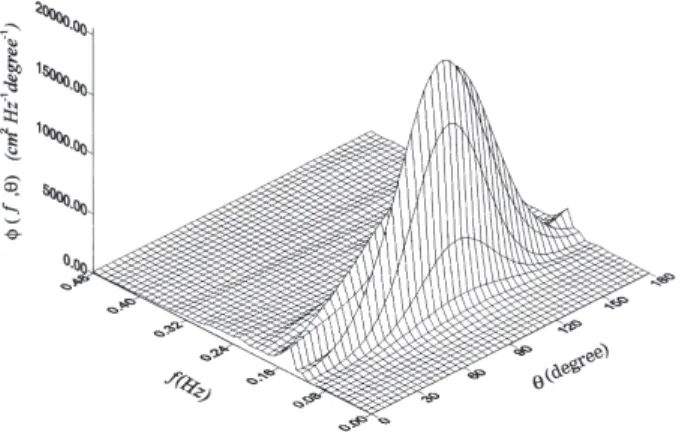
wavenumber spectra, wavelengths and directions of all subimages evidently did not change. To verify the SAR spectrum, the in situ wave data were simultaneously collected. The Extension Maximum Entropy (EME) method (Hashimoto et al., 1994) was applied to analyze the in situ wave data and calculate the directional power spectrum (Fig. 11). As this in situ spectrum indicates, wave energy was concentrated
Fig. 10. SAR directional wave spectrum of sampling average of all sixteen samples as Fig. 9(a)–(p).
Fig. 11. Directional wave spectrum derived from in situ wave data of a wave-rider by the EME method.
in 0.1 Hz of frequency and the dominant wave direction was 96°. Comparing Fig.
10 and Fig. 11 reveals that peak frequencies and dominant wave directions of both power spectra nearly corresponded with each other. Moreover, comparing their shapes of power spectra suggests that the SAR spectral power was more randomly distributed than the in situ one. Based on the theoretical analysis, in situ power
spectrum has a smooth spectral form and possesses the shape of cosn. Some
dis-crepancies between in situ and SAR spectral shape might be owing to the different approaches used in data processing.
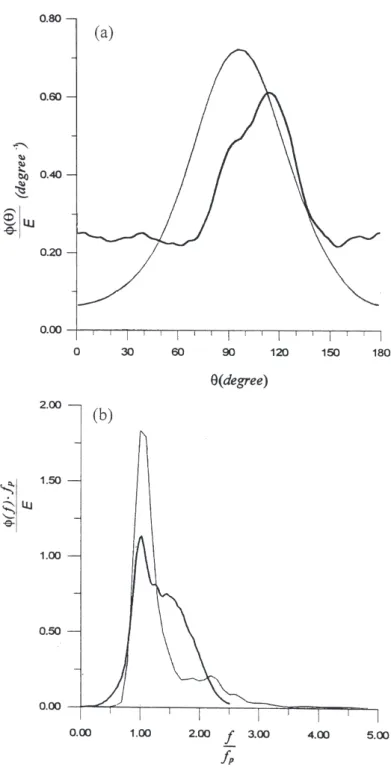
In a further comparison, both directional power spectra were integrated in all
fre-quencies and wave directions to attain the directional power function() and
fre-quency power function(f) in Fig. 12(a) and (b), respectively. These functions were
normalized by wave energy (E) and peak frequency (fp). Fig. 12(a) depicts that their
distributions of wave energy in wave direction appeared to superficially correspond with each other. However, in the area distant from the dominant wave direction, a
Fig. 12. Normalized wave spectra distributed in (a) direction and (b) frequency, respectively, by integrat-ing all frequencies and wave directions, thick and thin curves presentintegrat-ing SAR and in situ wave data, respectively.
higher wave energy distributed itself in the SAR directional power function more than the in situ one. This occurrence might be owing to some unknown noise in SAR data. In the SAR image of descending mode, the SAR dominant wave direction
should have 12.9°added to adjust the direction according to true north. A difference
of around 20° was found in the dominant wave directions obtained from SAR data
and in situ data. Besides comparing and verifying SAR spectra with in situ wave spectra, the dominant wave directions and wavelengths could also be directly investi-gated from SAR wave images. The dominant wave directions and wavelength were derived from spectral analysis and directly examined on SAR images that roughly corresponded with each other. This finding confirmed that the spectral analysis meth-odology of SAR wave image is largely valid. The difference in dominant wave directions, as derived from SAR data and in situ data, might be owing to measuring the different waves by the waverider over nearshore and by SAR over deep waters with average wave directions of all sub-images.
6. Discussion and conclusion
Besides this ERS-1 SAR image analyzed as above, some ERS SAR images, col-lected on June 16, 1994, January 7 and May 17, 1995 etc., provided by CSRSR were used to analyze and compare with in situ wave data. Generally, the periods of their dominant wave system varied from 6 to 12 seconds. According to results in this study, the representative ERS-1 SAR wave image has stationary wave character-istics in statcharacter-istics over a wavefield of 6400 m by 6400 m via the Reverse Arrangement Test. The power spectrum can be roughly calculated and has poor precision with a smaller sample size of SAR wave images. In order to avoid spending more compu-tational time, the SAR wave image of 128 pixels by 128 pixels is the appropriate sample size used to estimate the directional power spectrum via FFT.
In statistics, some differences among wave characteristics exist between SAR wave signals and in situ wave data. For instance, more noise can be found in SAR wave signals than in situ ones, thereby causing some redundant wave energy to appear distant from the peak frequency of SAR power spectra via spectral analysis. The Gaussian distribution cannot correlate well with the SAR histogram of water surface displacements; however, the Rayleigh distribution can closely correspond to that of wave heights. The above finding suggests that SAR wave signals cannot completely respond to actual ocean waves. SAR wave images should be carefully taken during spectral analysis so that approximate actual wave characteristics can be obtained.
Moving average on raw SAR wave data should be carefully performed before FFT in order to avoid removing the useful short wave signals. Moving average after FFT should not be overdone to prevent the wave energy from being vaguely distrib-uted in SAR power spectra. Additionally, many SAR data included in the SAR data
wave image of 128⫻ 128 pixels has a sample size sufficiently large to obtain wave
characteristics in statistics. However, some random errors still persist in SAR power spectra; sampling average is used to effectively reduce such errors.
The authors would like to thank the Remote Sensing Technology Planning and Developmental Committee, Council of Agriculture, the Republic of China (ROC), and the National Science Council of the ROC for financially supporting this manu-script. CSRSR and IHMT provided ERS-1 SAR images and in situ wave data.
References
Alpers, W.R., Bru¨ning, C., 1986. On the relative importance of motion-related contributions to the SAR imaging mechanism of ocean surface waves. IEEE Transactions on Geoscience and Remote Sensing 24, 873–885.
Alpers, W.R., Hasselmann, K., 1978. The two-frequency microwave technique for measuring ocean-wave spectra from an airplane or satellite. Boundary-Layer Meteorology 13, 215–230.
Atul, J., Medlin, G., Wu, C., 1982. Ocean wave height measurement with SEASAT SAR using speckle diversity. IEEE Journal of Oceanic Engineering 7, 93–108.
Bendat, J.S., Piersol, A.G., 1986. Random Data: Analysis and Measurement Procedures. John Wiley and Sons, New York, Chichester, Brisbane, Toronto and Singapore.
Charriez, P., Olagnon, M., 1995. Relevance of satellite data for a reliability approach of design coastal wave estimation. Proceedings of 14th Conference on Offshore Mechanics and Arctic Engineering. OMAE 2, 71–78.
Gonzales, F.I., Beal, R.C., Brown, W.E., Deleonibus, P.S., ShermanIII, J.S., Gowere, J.F.R., Lichy, D., Ross, D.B., Rufenach, C.L., Shuchman, R.A., 1979. Seasat synthetic aperture radar: ocean wave detec-tion capabilities. Science 204, 1418–1521.
Hashimoto, N., Nagai., T., Asai, T., 1994. Extension of the maximum entropy principle method for directional wave spectrum estimation, Proceedings 24th International Conference Coastal Engineering Research Council/ASCE, Kobe, Japan, October 1994, pp. 23-28.
Monaldo, M., Gerling, T.G., Tilley, D.G., 1993. Comparison of SIR-B SAR wave image spectra with wave model predictions—Implications on the SAR modulation transfer function. IEEE Transactions on Geoscience and Remote Sensing 31 (6), 1199–1209.
Populus, J., Aristaghes, C., Jonsson, L., Augustin, J.M., Pouliquen, E., 1991. The use of SPOT data for wave analysis. Remote Sensing of Environment 36, 55–65.
Rufenach, C., Johnsen, H., Høgda, K.A., 1995. An approximate analytical method for correcting distortion in synthetic-aperture-radar ocean wave spectral peaks. IEEE Transactions on Geoscience and Remote Sensing 33, 504–509.
Stewart, R.H., 1985. Synthetic-aperture radars. In: Methods of Satellite Oceanography. University of California Press, Berkeley, Los Angeles, and London, pp. 225-259.
Tucker, M.J., 1991. Waves in ocean engineering: measurement, analysis, interpretation. Ellis Horwood, Chichester.