Crucial effects of the anisotropy on optical field
induced pattern formation in nematic liquid
crystal films
Hsu-Kuan Hsu, Shu-Hsia Chen and Yinchieh Lai
Institute of Electro-Optical Engineering, National Chiao Tung University, 1001 Ta Hsueh Road, Hsinchu 300, Taiwan, R.O.C.
hkhsu.eo87g@nctu.edu.tw
Abtract: We present here the crucial effects of material anisotropy on optical field induced pattern formation in the one-feedback-mirror arrangement which utilizes the nematic liquid crystal film as the nonlinear medium. By using the quasi-static electric-field-biased planar-aligned homogeneous nematic liquid crystal (NLC) films, we observe both the hexagon and the roll patterns which can be switched optically due to the intrinsic anisotropic distribution of the threshold intensity. The anisotropy comes from the anisotropic nonlinear response of the NLC film and is the crucial factor for such a one-feedback-mirror system to form both the roll and hexagon patterns. The observed phenomena can be explained from the linear stability analysis of the governing diffusion-like equation. The experimental results indicate that the stable roll patterns are formed at low input light power and the stable hexagon patterns formed at high input power.
©2004 Optical Society of America
OCIS codes: (190.0190) Nonlinear optics; (190.4420) Nonlinear optics, transverse effects in
References and links
1. G. D’Alessandro and W.J. Firth, “Spontaneous hexagon formation in a nonlinear optical medium with feedback mirror,” Phys. Rev. Lett. 66, 2597-2600 (1991).
2. G. D’Alessandro and W.J. Firth, “Hexagonal spatial patterns for a Kerr slice with a feedback mirror,” Phys. Rev. A 46, 537-548 (1992).
3. R. Macdonald and H.J. Eichler, “Spontaneous optical pattern formation in a nematic liquid crystal with feedback mirror,” Opt. Commun. 89, 289-295 (1992).
4. E. Ciaramella, M. Tamburrini, and E. Santamato, “Talbot assisted hexagonal beam patterning in a thin liquid crystal film with a single feedback mirror at negative distance,” Appl. Phys. Lett. 63, 1604-1606 (1993). 5. M. Tamburrini, M. Bonavita, S. Wabnitz, and E. Santamato, “Hexagonally patterned beam filamentation in a
thin liquid-crystal film with a single feedback mirror,” Opt. Lett. 18, 855-857 (1993).
6. R. Neubecker, G.-L. Oppo, B. Thuering, and T. Tschudi, “Pattern formation in a liquid-crystal light valve with feedback, including polarization, saturation, and internal threshold effects,” Phys. Rev. A 52, 791-808 (1995).
7. F. Castaldo, D. Paparo, and E. Santamato, “Chaotic and hexagonal spontaneous pattern formation in the cross section of a laser beam in a defocusing Kerr-like film with single feedback mirror,” Opt. Commun. 143, 57-61 (1997)
8. R. Martin, A.J. Scroggie, G.-L. Oppo, and W. J. Firth, “Stabilization, selection, and tracking of unstable patterns by Fourier space techniques,” Phys. Rev. Lett. 77, 4007-4010 (1996).
9. R. Martin, G.-L. Oppo, G. K. Harkness, A.J. Scroggie, and W. J. Firth, “Controlling pattern formation and
spatio-temporal disorder in nonlinear optics,” Opt. Express 1, 39-43 (1997).
http://www.opticsexpress.org/abstract.cfm?URI=OPEX-1-1-39
10. E. Benkler, M. Kreuzer, R. Neubecker, and T. Tschudi, “Experimental control of unstable patterns and elimination of spatiotemporal disorder in nonlinear optics,” Phys. Rev. Lett. 84, 879-882 (2000).
11. E. Ciaramella, M. Tamburrini, and E. Santamato, “Observation of nonhexagonal laser-beam patterning in a thin liquid crystal cell in front of a single feedback mirror,” Appl. Phys. Lett. 64, 3080-3082 (1994).
12. G. Grynberg, “Drift instability and light-induced spin waves in an alkali vapor with feedback mirror,” Opt. Commun. 109, 483-486 (1994).
13. J. P. Seipenbusch, T. Ackemann, B. Schapers, B. Berge, and W. Lange, “Drift instability and locking behavior of optical patterns,” Phys. Rev. A 56, R4401-R4404 (1997).
14. T. Ackemann, B. Schapers, J. P. Seipenbusch, Yu. A. Logvin, and W. Lange, “Drifting and locking behavior of optical patterns- an investigation using Fourier filters,” Chaos. Solitons & Fractals 10, 665-673 (1999). 15. S. H. Chen and Y. Shen, ‘‘Optical phase conjugation in a nematic liquid-crystal film modulated by a
quasi-static electric field,’’ J. Opt. Soc. Am. B 14, 1750–1753 (1997).
16. S. H. Chen and Y. Shen, ‘‘Observation of self-starting phaseconjugate oscillation in a planar nematic liquid-crystal cell,’’ Appl. Phys. Lett. 72, 1281–1283 (1998).
17. Yuhren Shen, Hsu-Kuan Hsu, and Shu-Hsia Chen, “Phase-conjugate reflection and self-starting optical phase-conjugate oscillation in planar nematic liquid-crystal cells,” J. Opt. Soc. Am. B 20, 65-72 (2003).
1. Introduction
Optical pattern formation in nonlinear optics has received great interest in the last decade. A simple arrangement which is useful for optical pattern formation is constituted by a thin slice of Kerr or Kerr-like nonlinear medium and a single feedback mirror [1-7]. The hexagons are the usual patterns often observed in these experiments. To stabilize and select patterns other than the hexagons, one can add a Fourier filter in the feedback route [8-10] or break the rotational symmetry by applying the anisotropic nonlinear medium [11]. As pointed out by Santamato in Ref.11, by using the homeotropically aligned NLC films as the anisotropic nonlinear medium, one makes the formation of the roll patterns possible and the hexagon patterns can also be formed as the anisotropy is reduced to zero by setting the NLC film in a suitable tilt angle. The anisotropy for such systems can also come from the tilt of the feedback mirror although the drifting instability in the formation of the optical patterns may also occur [12-14].
In this paper, we present the theoreticalderivationsand experimental evidences about the crucial effects of the anisotropy on optical pattern formation in the NLC film. Unlike the Santamato’s method proposed in Ref.11, we use the quasi-static electric-field-biased planar-aligned homogeneous NLC films as the nonlinear medium to demonstrate the optical pattern formation of the rolls and the hexagons without canceling the anisotropic nonlinear response of the NLC film. Also unlike the anisotropy induced from the tilt of the feedback mirror as in Ref. [12], the hexagon patterns observed in this work are not drifting within the response time of human eyes (~16ms), since we can see them on the screen even without taking short time snapshot pictures. The results further reveal the effects of the anisotropy in the formation of the optical patterns.
The organization of this paper is as follows. In Section 2 we express the theoretical derivation of the governing diffusion-like equation for the orientational distribution of the liquid crystal directors in the transverse plane with externally applied electric and optical fields. The threshold intensity for the optical patterns to be formed can be obtained from the linear stability analysis of the diffusion-like equation. The anisotropic properties of the threshold intensity resulted from the anisotropic nonlinear response of the NLC films can be calculated to predict the pattern configuration that will be formed. In Section 3 we experimentally demonstrate the formation of the optical patterns and showed that both the hexagons and the rolls can be obtained by simple optical power modulation. Finally in Section 4 we give a brief conclusion about the obtained results.
2. Theory
In order to obtain the governing diffusion-like equation for the orientational distribution of the liquid crystal directors in the transverse plane with externally applied fields, we start from the continuum theory for the NLCs. If one assumes a p-polarized light beam impinges on the electric-field-biased liquid crystal film, then the liquid crystal directors will be re-orientated when the electric and the optical fields are high enough. As the liquid crystal directors are re-orientated, the light beam passing through the liquid crystal film will experience a phase
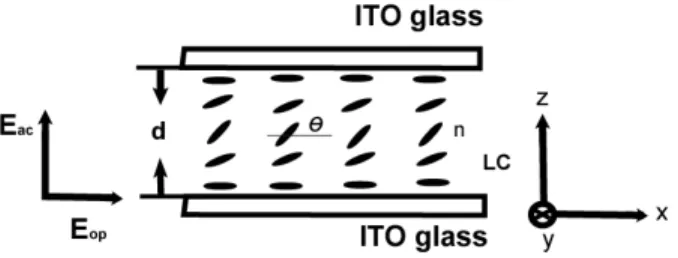
orientational distribution of the liquid crystal directors θ(x,y,z) must be calculated first. Figure 1 shows the configuration of the quasi-static electric field biased planar-aligned homogeneous NLC film used in our experiment.
Fig. 1. The planar-aligned nematic liquid crystal cell: LC, liquid crystal;
θ
, molecular orientational angle; Eop , optical field; Eac, electric field; nˆ , molecular director; d, cell thickness, and ITO, indium tin oxide.We choose the coordinates system with the z axis perpendicular to the cell walls, the x-y plane coincident with the input cell wall and the xˆ direction coincident with the easy axis of the liquid crystal directors. From the continuum theory and by following the derivation of our previous papers [15-17], the free-energy density f consisted of the Frank elastic free-energy density, the optical energy density, and the electric energy density is given by:
)] )( ( cos sin 2 ) )( sin 1 ( ) )( cos 1 [( { 2 1 2 2 2 2 11 z x k z k x k k f ∂ ∂ ∂ ∂ + ∂ ∂ + + ∂ ∂ + = θ θ θ θ θ θ θ θ 2 / 1 2 2 2 2 22
)
sin
1
(
)
sin
1
(
8
}
)
(
θ
µ
θ
πε
θ
−
−
−
−
∂
∂
+
⊥c
In
w
D
y
k
z e (1) wherek
=
(
k
33/
k
11)
−
1
,w
=
1
−
ε
///
ε
⊥ ,µ
=
1
−
(
n
e/
n
o)
2, D is the z component of zthe electric displacement, c is the velocity of light in vacuum, I is the input optical intensity, k11 , k22 , and k33 are the splay, twist, and bend elastic constants and
n
e andn
o, ε// and ε⊥ arethe values of the refractive indices and the dielectric constants with their directions parallel and perpendicular to the liquid crystal director. Instead of solving the distribution function
) , , (x y z
θ by the Euler–Lagrange equations directly, we assume a trial solution of θ(x,y,z)
as follows:
)
sin(
)]
,
(
[
)
,
,
(
d
z
y
x
z
y
x
θ
aθ
pπ
θ
=
+
(
,
)
sin(
)
d
z
y
x
tπ
θ
=
(2) We also assume the hard-boundary conditions, θ(z=0)=θ(z=d)=0. Here d is the thickness of the sample andθ
a ,θ
p , andθ
t represent the electrically biased spatial average orientational angle, the optically modulating amplitude, and the transverse orientational angle in the middle layer of the liquid crystal cell. After substituting Eq. (2) into Eq. (1), integrating the total volume of the cell, and following the Euler- Lagrange optimization process, we can get the torque balance equation of the liquid crystal directors. After some algebra and considering the viscositic term, the torque balance equation can be expressed as:
G
J
k
I
I
V
V
y
l
x
l
t
t fr th t t y t x t2
(
2
)
]
2
[
)
(
)
(
1 2 2 2 2 2 2 2 2θ
θ
θ
θ
θ
γ
+
=
−
+
∂
∂
−
∂
∂
−
∂
∂
(3) with[
1
2
(
2
)
(
2
)
]}
2
1
{
)
(
1
1 0 2 2 t t t xJ
J
k
d
G
l
θ
θ
θ
π
+
+
−
=
(3a)1
(
)
(
)
11 22 2 2k
k
d
G
l
yπ
=
(3b)[
(
2
)
(
2
)]}
2
2
{
k
k
J
0 tJ
2 tG
=
+
−
θ
−
θ
(3c) 2 1 // 11]
[
2
⊥−
=
ε
ε
π
π
k
V
th (3d))
(
1
)
(
2 11µ
π
e frn
d
ck
I
−
=
(3e) Hereγ
is the viscosity coefficient, I is the input intensity, V is the root mean square value of the biased voltage, li (i = x, y) is the diffusion length in the i direction, Ji(2θt) is the Bessel function of the first kind of order i, andI and frV
th are the Freedericksz optical intensity andvoltage. Equation (3) can be changed into the diffusion-like equation for the optical phase variation in the transverse plane since the effective index of refraction for the NLC materials can be expressed as:
)
sin
1
(
2 2 2θ
µ
−
=
e effn
n
(4) and the optical phase variation in the transverse plane is
Ψ
=
∫
d effdz
n
y
x
0 02
)
,
(
λ
π
(5)After substituting Eq. (2) into Eq. (4) and replacing
n
eff in Eq. (5) by Eq. (4), the diffusion-like equation can be expressed as:
S
T
I
I
V
V
y
l
x
l
t
x y∂
+
Ψ
=
th−
fr+
Ψ
∂
−
∂
Ψ
∂
−
∂
Ψ
∂
]
[
2 2 2 2 2 2 2 2τ
(6)Here
τ
is the response time related with the viscosity coefficient, S and T are the coefficients which are functions of the material parameters and the orientation of the liquid crystal directors. Now if we consider a uniform applied voltage, then the phase variation in the transverse plane directly comes from the light intensity variation in the transverse plane. It follows that the constant phase terms and the constant driving forces can be removed from Eq. (6). Therefore a simplified governing diffusion-like equation for the Kerr induced optical phase variationφ
(
x
,
y
)
can be obtained and shown as:
I
y
l
x
l
t
x yφ
α
φ
φ
φ
τ
+
=
∂
∂
−
∂
∂
−
∂
∂
2 2 2 2 2 2 (7)G
I
J
dJ
n
fr a t e 0 1 1(
2
)
(
2
)
2
λ
θ
θ
µ
π
α
=
−
(8) Equation (7) is similar to the equation proposed by D’Alessandro in Ref.1 except the anisotropic property of the diffusion lengths in the transverse plane andα
is the effective nonlinear coefficient affected by the molecular orientations as shown in Eq. (8). From Eqs. (3a-c) and Eq. (8), we can see that the relative coefficients can be obtained as the material parameters, the electrically biased spatial average orientational angle θa, and the optically modulating amplitude θp are known. The electrically biased spatial average orientational angle θacan be determined by minimizing the total free energy under the hard boundary condition and the assumption of a uniformly distributed electric field. By following the Euler-Lagrange optimization process, we find that θahas to obey the following equation:
)
2
(
2
)
4
(
)]}
2
(
)
2
(
2
[
2
2
{
2 1 2 2 0 a fr th a a aJ
k
I
I
V
V
J
J
k
θ
θ
θ
θ
+
−
+
=
−
+
(9)Equation (9) can be calculated numerically if d, V, I, and the material parameters are known. From our previous paper [17], the optically modulating amplitude is much smaller than the electrically biased spatial average orientational angle, θp << . Therefore we can reasonably θa substitute
θ
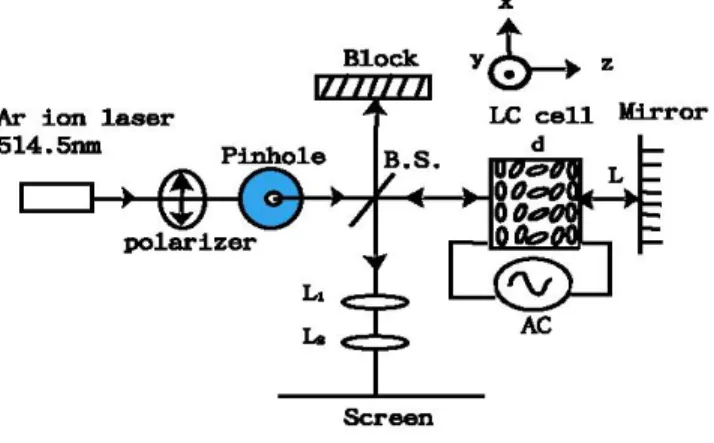
t by θa in Eqs. (3a-c) and Eq. (8).Fig. 2. Experimental setup: B.S., beam splitter; d, cell thickness; L, feedback length; LC, liquid crystal; L’i, lens
Our experimental setup is the one-feedback-mirror system as shown in Fig.2. For such a system, the linear stability analysis (LSA) of Eq. (7) can be performed by assuming that a small sinusoidal phase modulation is applied to the forward plane wave E0. After the plane wave
0
E just passes through the sample, it will experience the phase variation as given by:
E
f(
x
,
y
)
=
E
0{
1
+
i
ρ
cos(
q
cos(
ϕ
)
x
+
q
sin(
ϕ
)
y
)}
(10)Here ρ<<1 is the perturbation amplitude and the terms related to the wave vector q have
been written in the polar form with the azimuthal angle
ϕ
from the axis of the anisotropy to the wave vector clockwise. The beam Ef(x,y) then propagates freely to and reflects from the reflecting mirror. This part of wave propagation can be readily modeled by the Fresnel propagation formula. By squaring the reflected beam field to obtain the feedback intensity distribution and by inserting it into the right side of Eq. (7) for performing the stability analysis, after some algebra we can derive the following threshold intensity for the growing of the perturbation:)
2
sin(
2
)
sin
cos
(
1
)
,
(
0 2 2 2 2 2 2L
q
R
l
l
q
q
I
th x yλ
π
α
ϕ
ϕ
ϕ
=
+
+
(11)Here L is the length between the sample and the reflecting mirror and R is the reflectivity of the reflecting mirror. From Eq. (11), the threshold intensity as a function of q is expected to reach its minimum approximately when sin(q2
λ
0L/2π
)=1 or equivalently when
L
q
0λ
π
≅
(12) At this time the net feedback length 2L is simply the required length to transform the phase modulation in Eq. (10) to pure amplitude modulation as the beam is reflected back to the sample. The threshold intensity in various azimuthal angles can then be readily obtained when the spatial frequency is known.4 7 . 5 4 8 4 8 . 5 4 9 4 9 . 5 5 0 5 0 . 5 5 1 5 1 . 5 5 2 5 2 . 5 0 0 . 5 1 1 . 5 2 2 . 5 3
az imuthal angle (rad. )
th re sh o ld in te n si ty (W /c m 2 )
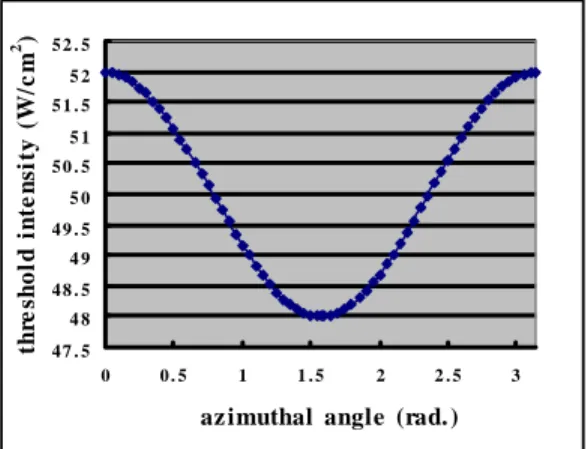
Fig. 3. The calculated curve of the threshold intensityversus the azimuthal angle
ϕ
when the average tilt angleθ
a is fixed at 0.787 radian and the beam diameter=1.4mm, d=68µ m, L=1.9cm, R=0.65From Eq. (7) and Eq. (11) we can easily see that the anisotropic nonlinear response of NLC films indeed induces the anisotropic distribution of the needed threshold intensity for the pattern to be formed. Unlike Santamato’s method in Ref. [11] we analyze the optical pattern formation phenomena by calculating the threshold intensity distribution for various azimuthal angles. After knowing the sample thickness, the material parameters, the feedback length, the external applied fields,the reflectivity of the feedback mirror,and the θ from Eq. (9), the
threshold intensity distribution versus the azimuthal angle
ϕ
can be obtained. For instance, Fig. 3 shows the threshold intensity versusϕ
for the 0.9W input light power and the 1.117Vrms biased planar-aligned homogeneous nematic E7 sample with the sample thickness of 68 µm and the average tilt angle θa of 0.787 radian.From Fig. 3 we can find the anisotropic property of the threshold intensity in various azimuthal angles. In the case of isotropic media, the threshold intensity should be equal in all azimuthal directions. However in our case, the diffusion length anisotropy results in the anisotropic threshold intensity distribution such that the minimum threshold intensity locates at
0
90
=
ϕ
and the maximum one locates atϕ
=
0
0and180
0. This property gives us a hint to obtain both the hexagonal and the roll-like patterns using the anisotropic nonlinear materials. For the isotropic materials, the common hexagonal pattern will appear as soon as the input light intensity is above the threshold. Similarly, in our anisotropic case, we believe if the input light intensity is above the maximum threshold, the hexagon patterns may appear since all the modes with different azimuthal anglesϕ
are allowed to exist and the final stable hexagons can be obtained because of their compact stable structures. On the other hand, since the threshold intensity distribution has a minimum, what pattern will be formed when the input light intensity is above and near the minimum threshold intensity? A direct and simple prediction is that the mode with the minimum threshold intensity will exist since it experiences the maximum nonlinear gain.Furthermore, our approach to get both the hexagons and the rolls are not the same as the Santamato’s method in which the anisotropic nonlinear response of the NLC is removed by rotating the sample to a suitable angle. In our quasi-static electric-field-biased planar-aligned homogeneous NLC films the anisotropic property will not be removed within the tilted range from θa=
0
to θa=π
/2
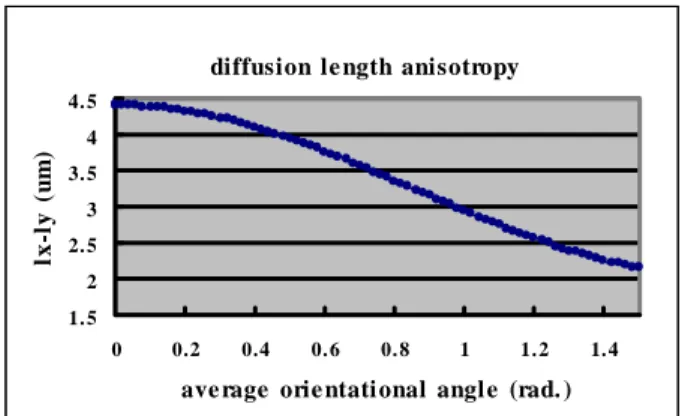
. This is seen as we calculating the difference between the diffusion lengths in the x and y directions and the result is shown in Fig. 4. From Fig. 4 we see that the anisotropy exists from θ a = 0 to θ =a π /2
. In other words, for this system the diffusion length anisotropy can not be suppressed to zero by changing θa.diffusion le ngth anisotropy 1. 5 2 2. 5 3 3. 5 4 4. 5 0 0.2 0.4 0. 6 0. 8 1 1. 2 1. 4
ave rage orie ntati onal angl e (rad. )
lx -l y (u m )
Fig. 4. Diffusion length anisotropy (lx-ly) versus the average orientational angle θa with input power= 0.9W, d=68µm, L=1.9cm, R=0.65, and beam diameter=1.4mm.
3. Experiments and discussions
To illustrate the predictions in Section 2 experimentally, we use the quasi-static electric field biased planar-aligned homogeneous nematic E7 cell sandwiched between two indium-tin oxide coated glass windows as the nonlinear medium. The experimental setup is the same as shown in Fig. 2. We use polyvinyl alcohol (PVA) as the alignment material and achieve the parallel planar alignment by rubbing. The thickness of the cell is about 68µm. The applied external #3938 - $15.00 US Received 27 February 2004; revised 22 March 2004; accepted 23 March 2004
fields include a 1KHz electric field (1.117Vrms) generated by a microcomputer’s waveform synthesizer (Quatech Inc., WSB-A12M) and the p-polarized optical field at the wavelength of 514.5nm from an Ar-ion laser. The original beam waist from the Ar-ion laser is 1.9mm and the input beam diameter is controlled by the pinhole as 1.4mm. The pinhole is used to block the stray light in the low intensity wings of the beam and let the high intensity region pass through the sample. The reflectivity of our reflecting mirror is about 0.65. The lens L1, L2 are arranged to observe the near field picture of the reflected beam impinging on the sample. In the following we fix the biased voltage and change the input light power to see what patterns will be formed at different input powers. The powers used in our experiments are from 0.71W to 0.98W with a power step about 0.03W. The input light power is measured after the beam passing through the pinhole and the beam splitter. In our experiments, the laser beam is blocked when we change the input light to the desired power. Therefore the pattern formations are always starting from the homogeneous state. The pictures of the observed patterns are shown in Fig. 5 with the exposure time of 1.25ms.
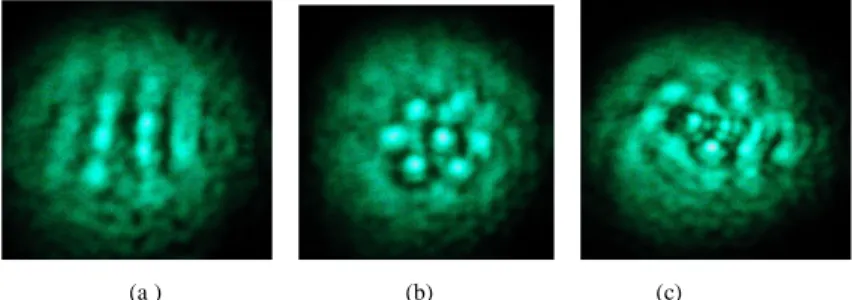
(a ) (b) (c)
Fig. 5. Near field patterns observed on the screen (a) input power=0.74W (b) input power=0.83W (c) input power=0.98W. With biased voltage=1.117Vrms, d=68µm, L=1.9cm, R=0.65, beam diameter=1.4mm,and exposure time=1.25ms.
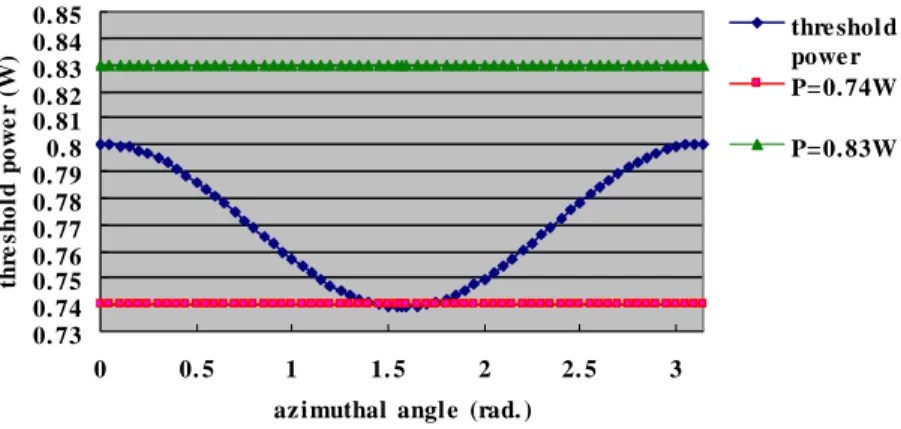
In Fig. 5 we can clearly see that the stable rolls and hexagons are obtained at 0.74W and 0.83W respectively. For the relative higher power of 0.98W the optical patterns become chaotic. This kind of unstable phenomena at the high input power has also been reported in the literature [5]. One thing has to be mentioned is that when we apply an optical power of 0.83W, the roll patterns appear first and then transform finally to the stable hexagon patterns as shown in Fig. 5(b). This dynamic transition implies the instability of the homogeneous state and then the instability of the roll state. Besides, we do not observe stable optical patterns with the input power at 0.77W and 0.8W. We plot the calculated threshold power distribution versus the azimuthal angles in Fig. 6to relate these experimental observations to our arguments from the theoretical results in Section 2. Even though the actual laser beam is a gaussian beam, for simplicity we calculate the threshold power from the threshold intensity shown in Fig. 3 by multiplying the beam area. Since only the light with high intensity passing through the pinhole and the sample the optical power with the peak intensity reaching the threshold intensity should be lower then that shown in Fig. 6. Nevertheless, it is clear that the stable rolls and stable hexagons exist and are obtained indeed in the power regions near the minimum and the maximum threshold power respectively.
0. 73 0. 74 0. 75 0. 76 0. 77 0. 78 0. 79 0. 8 0. 81 0. 82 0. 83 0. 84 0. 85 0 0. 5 1 1. 5 2 2. 5 3
az i muthal angl e (rad. )
thr e s ho ld po w e r ( W ) thre shol d powe r P=0. 74W P=0. 83W
Fig. 6. The calcualted curve of the threshold power versus the azimuthal angle ϕ when the average tilt angle θa is fixed at about 0.787 radian and the biased voltage is 1.117Vrms.
According to the theoretical analysis and the experimental observations that we have shown above, one can see that the anisotropy indeed play an important role in the formation of the rolls. Moreover, some more words have to be said about the input power issue. When the power is above the maximum threshold, the hexagons appear. However, chaotic patterns will be formed if we keep increasing the input power. One interesting question may appear is that what patterns will be formed as the input power is between the minimum and the maximum threshold power. Actually our experimental observations at 0.77W and 0.8W indicate that the hexagons and the rolls may compete with each other and are not stable. This implies an interesting suggestion that the hexagons may still be formed without the requirement that all the modes with different azimuthal angles are allowed to appear. Unfortunately, since we do not observe stable patterns in this parameter range, no conclusive remarks can be made about this point at the present time. We are investigating more carefully on this respect right now. 4. Conclusions
In this paper we have theoretically analyzed and experimentally observed the effects of the anisotropic nonlinear response of the NLC film on pattern formation and have found that this anisotropy plays a crucial role for the one-feedback-mirror system to form the roll and the hexagon patterns. The anisotropy is the necessary factor in the formation of the rolls without externally adding a mask or filter. Based on this intrinsic anisotropy, theformation of both the stable roll and the stable hexagon patterns has been achieved by suitably adjusting the input power.
Acknowledgement
This work was partially supported by the National Science Council, R.O.C., under Contrast No. NSC 92-2112-M-009-025-.