Taipei Medical University
T
he
a
ssociation
b
etween
a
nthropometric
m
easurements
a
nd
n
utritional
s
tatus
i
n
c
hronic
h
emodialysis
p
atients
I
ntroduction
O
bjective
Hemodialysis (HD) patients have high prevalence of
malnutrition.
S
ubjects and Methods
R
esults and Discussion
C
onclusion
Chiu YC
1
, Lin WC
1
, Yang SH
1,2
1
School of Nutrition and Health Sciences, Taipei Medical University
2
Nutrition research center, Taipei Medical University Hospital
This study was to evaluate the association between
anthropometric measurements and nutritional status in
chronic hemodialysis (CHD) patients.
One hundred and seven hemodialysis patients were
recruited from Taipei Medical University Hospital and
Wanfang Hospital in 2010. Which were 53 males and 54
females. To evaluate biochemical variables among
underweight ( BMI <18.5 ), normal weight ( 18.5 < BMI <
23.9 ) and overweight & obese ( BMI ≧ 24) groups.
Overweight & obese group had higher phosphate and
calcium × phosphate than underweight group. Normal
weight and overweight & obese groups had higher GNRI
score than underweight group. Higher BMI groups includes
normal weight and overweight & obese groups had more
well-nourished (GNRI score > 90) but lower calorie and
protein intake.
Higher BMI may reflect well-nourished in CHD patients,
but they have lower dietary intake.
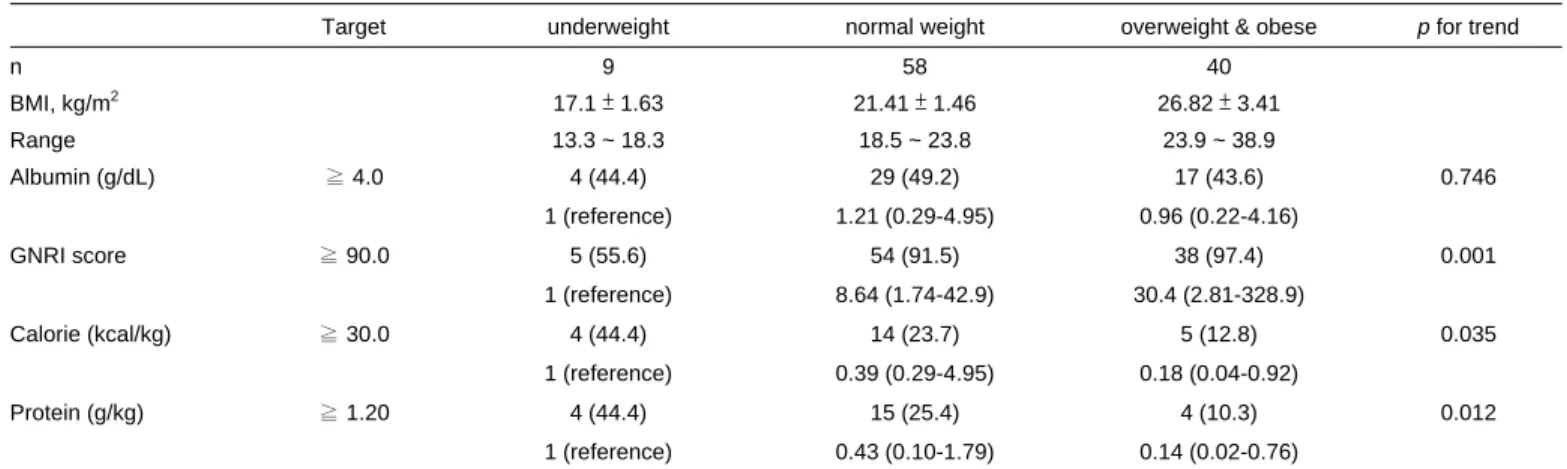
Table 2. Odds ratio of nutritional status parameter with optimal target according to BMI groups. 0
Target underweight normal weight overweight & obese p for trend
n 9 58 40 BMI, kg/m2 17.1 ± 1.63 21.41 ± 1.46 26.82 ± 3.41 Range 13.3 ~ 18.3 18.5 ~ 23.8 23.9 ~ 38.9 Albumin (g/dL) ≧ 4.0 4 (44.4) 29 (49.2) 17 (43.6) 0.746 1 (reference) 1.21 (0.29-4.95) 0.96 (0.22-4.16) GNRI score ≧ 90.0 5 (55.6) 54 (91.5) 38 (97.4) 0.001 1 (reference) 8.64 (1.74-42.9) 30.4 (2.81-328.9) Calorie (kcal/kg) ≧ 30.0 4 (44.4) 14 (23.7) 5 (12.8) 0.035 1 (reference) 0.39 (0.29-4.95) 0.18 (0.04-0.92) Protein (g/kg) ≧ 1.20 4 (44.4) 15 (25.4) 4 (10.3) 0.012 1 (reference) 0.43 (0.10-1.79) 0.14 (0.02-0.76)
Values are number, mean ± SD or odds ratio with 95% confidence interval. GNRI = geriatric nutritional risk index. Statistical significance analyzed by logistic regression at p < 0.05.
Table 1. Clinical characteristics of hemodialysis patients divided by BMI groups.000
BMI (kg/m2)
Variables Total underweight normal weight overweight & obese p
Subjects (n) 107 9 58 40 BMI (kg/m2) 23.1 ± 3.9 17.1 ± 1.6 21.4 ± 1.5 26.8 ± 3.4 Age (years) 63.4 ± 14.7 68.4 ± 19.3 63.9 ± 14.9 61.6 ± 13.1 0.426 Hemoglobin (g/dL) 10.5 ± 1.3 10.6 ± 1.5 10.3 ± 1.4 10.8 ± 1.0 0.174 Total protein (g/dL) 6.8 ± 0.6 6.8 ± 0.5 6.7 ± 0.6 6.8 ± 0.6 0.744 Albumin (g/dL) 3.9 ± 0.4 3.9 ± 0.6 3.9 ± 0.4 4.0 ± 0.3 0.741 BUN (mg/dL) 71.3 ± 20.3 63.4 ± 15.7 70.6 ± 23.0 74.0 ± 16.5 0.345 Creatinine (mg/dL) 10.4 ± 3.0 8.9 ± 2.4 10.3 ± 3.2 10.9 ± 2.6 0.167 Cholesterol (mg/dL) 174 ± 44 157 ± 46 174 ± 46 178 ± 41 0.439 Triglyceride (mg/dL) 194 ± 136 156 ± 137 179 ± 132 226 ± 140 0.168 Potassium (mg/dL) 4.6 ± 0.8 4.6 ± 0.7 4.5 ± 0.7 4.6 ± 0.8 0.643 Calcium (mg/dL) 9.4 ± 0.9 9.1 ± 0.5 9.4 ± 0.9 9.4 ± 0.8 0.463 Phosphate (mg/dL) 5.1 ± 1.4 4.2 ± 0.9a 4.9 ± 1.5ab 5.6 ± 1.3b 0.013 Ca × P (mg2/dL2) 48.0 ± 13.8 38.1 ± 8.3a 48.4 ± 13.7ab 52.5 ± 13.4b 0.007 Kt/V 1.63 ± 0.29 1.66 ± 0.36 1.67 ± 0.27 1.57 ± 0.30 0.237 GNRI score 98.7 ± 6.9 89.8 ± 9.9a 98.7 ± 6.5b 100.7 ± 4.9b <.0001 Calorie (kcal/kg) 24.4 ± 7.9 28.4 ± 10.4 25.1 ± 8.3 22.3 ± 6.2 0.062 Protein (g/kg) 0.97 ± 0.35 1.09 ± 0.44 1.01 ± 0.38 0.88 ± 0.27 0.097 Values are expressed as mean ± SD. BUN = blood urea nitrogen; Ca × P = calcium phosphate products; GNRI = geriatric nutritional risk index. Values with different superscripts are significantly different at p < 0.05 by t test.