on 5-year survival rates following oral
cancer resections: The experience of
an Asian country
Chia-Cheng Lin, DDS,a,band Herng-Ching Lin, PhD,bTaipei, Taiwan
Background. Although the relationship between provider volume and treatment outcome has been established for many types of operations, such a relationship has yet to be determined for resection of oral cancers. The purpose of this report is to assess the effects of surgeon and hospital volume on 5-year survival for oral cancer.
Methods. A total of 6,666 patients who underwent resections of oral cancer between 1997 and 1999 were identified from the Taiwan National Health Insurance Research Database. These data were linked to the ‘‘cause of death’’ data file from the Department of Health in Taiwan and traced for 5 years to obtain the survival times for individual patients. Survival analysis and proportional hazard regressions were conducted to assess the association between 5-year survival rates and surgeon and hospital volumes after adjusting for patient and provider variables. Volume relationships were based on the following criteria: low-, medium-, and high-volume surgeons were defined by <52, 52 to 142, and >142 resections, respectively, during the 3-year period. Similarly, low-, medium-, and high-volume hospitals were defined by <343, 343 to 531, and >531 resections, respectively, during the 3-year period.
Results. With an increase in individual surgeon volume, there were increases in the unadjusted 5-year survival rates (45.5%, 49%, and 51.8% for low-, medium-, and high-volume groups, respectively; P < .001); no such association, however, was observed with hospital volumes (47.5%, 51.3%, and 49% for low-, medium-, and high-volume hospitals, respectively; P = .074). Compared with treatment by low-volume surgeons, operations by high-volume surgeons were associated with an adjusted hazard ratio of 0.810 (95% confidence interval = 0.735-0.893).
Conclusions. We conclude that, for patients who underwent oral cancer resections, after adjusting for differences in the case mix, high-volume surgeons had better 5-year survival rates. This association, however, was not discernible for high-volume hospitals. (Surgery 2008;143:343-51.)
From the Department of Dentistry, Shin Kong Wu Ho-Su Memorial Hospital,a and School of Health Care Administration, Taipei Medical University,b Taipei, Taiwan
ARELATIONSHIP BETWEEN HOSPITAL AND PHYSICIAN VOLUME AND PATIENT OUTCOMEShas been well-documented in the literature for more than 3 decades.1The major-ity of studies examining this issue have demon-strated that high volume is associated with better patient outcomes. Studies also have shown, how-ever, that the benefits of high-volume providers vary by the type of operative procedure performed. Despite the substantial body of literature investigat-ing the effects of the volume-outcome relationship on cancer treatments,2-10to the best of our knowl-edge no study has yet examined the effects of surgeon or hospital volume on treatment outcomes after resections for oral cancer.
Globally, oral cancer is among the 10 most com-mon forms of cancer. In 2002, more than 274,000 Study was supported by a grant from the National Science
Council (NSC 95-2416-H-038-001) in Taiwan.
This study is based in part on data from the National Health Insur-ance Research Database provided by the Bureau of National Health Insurance, Department of Health, Taiwan and managed by the National Health Research Institutes. The interpretations and conclusions contained herein do not represent those of the Bureau of National Health Insurance, Department of Health, or the National Health Research Institutes.
Accepted for publication September 18, 2007.
Reprint requests: Herng-Ching Lin, PhD, Associate Professor, School of Health Care Administration, Taipei Medical University, 250, Wu-Hsing St., Taipei 110, Taiwan. E-mail: henry11111@ tmu.edu.tw.
0039-6060/$ - see front matter Ó 2008 Mosby, Inc. All rights reserved. doi:10.1016/j.surg.2007.09.033
new cases of oral cancer were reported worldwide, with approximately 127,000 consequent deaths. Although almost two thirds of these new cases were found in developing countries,11cases of oral cancer are nevertheless increasing in the Western world; various reports have recently cited a rising trend in the rates of oral cancer mortality in most of Central and Eastern Europe.12,13In some devel-oping countries, almost 50% percent of oncology patients suffer from cancer of the oral cavity.11
Of all male cancers in Taiwan, oral cancer has been ranked fifth in incidence and subsequent mortality since 1995, and both incidence and mor-tality continue to increase. Oral cancer also has become the number one cause of all cancer deaths in Taiwan among males between the ages of 25 and 44 years; this is probably due to the progressive increase in betel quid consumption on the island.14 Because increasing numbers of young people are likely to suffer from oral cancer as a direct conse-quence of betel quid consumption, it is clearly a serious socioeconomic problem in Taiwan and a public health issue of considerable concern.
Even though the operative risk involved in most resections of oral cancers is small, a coordinated, multidisciplinary approach including surgery, ra-diotherapy, adjuvant chemotherapy, and dental and maxillofacial rehabilitation is required to im-prove the long-term survival of patients and their overall quality of life. Clearly, then, it is of consid-erable importance to have a firm understanding of the relationship between institutional surgical volume, individual surgeon experience, and treat-ment outcomes for oral cancer, to assess the coordination of the necessary care.
Therefore, the purpose of this nationwide, popu-lation-based study is to examine the effects of sur-geon and hospital volume in Taiwan, focusing on the 5-year survival rates following oral cancer surgery.
PATIENTS AND METHODS
Database. Two databases were used in this study. The first of these was the Taiwan National Health Insurance Research Database (NHIRD), which is published by the Taiwan National Health Research Institute and is one of the largest and most comprehensive databases currently available. Cov-ering almost the entire population of 23 million Taiwanese citizens, the NHIRD comprises compre-hensive hospitalization data, such as medical claims for inpatient expenditure on admissions, details of inpatient orders, and a registry of contracted medical facilities, medical personnel, board-certified specialists, and beneficiaries.
One principal diagnosis and procedure code is listed for each hospitalization, with up to four secondary diagnoses and procedure codes based on the International Classification of Disease, 9th Revision, Clinical Modification (ICD-9-CM) codes. The second database, the ‘‘cause of death’’ data file published by the Department of Health (DOH) in Taiwan, provides data on all Taiwanese citizens, including marital status, employment status, place of legal residence, date of birth and death, and the underlying cause of death (ICD-9-CM code). Because the registration of all births and deaths is mandatory in Taiwan, the data are considered to be extremely accurate and comprehensive. The NHIRD was linked to the ‘‘cause of death’’ data file with the assistance of the DOH in Taiwan.
Study subjects. A total of 6, 666 hospitalizations were identified from the NHIRD between 1 January 1997 and 31 December 1999 for resections of oral cancer including excision of tissue of the gum (ICD-9-CM procedure code 24.31), excision of tissue of the tongue or glossectomy (ICD-9-CM procedure codes 25.1-25.4 and 25.94), excision of tissue of the bony palate (ICD-9-CM procedure codes 27.31-27.32), excision of tissue of the lip (ICD-9-CM procedure codes 27.42-27.43), other excision of tissues of the mouth (ICD-9-CM proce-dure code 27.49), excision of the uvula (ICD-9-CM procedure code 27.72), and removal of facial bones (ICD-9-CM procedure codes 76.01, 76.09, 76.31, and 76.39) with a diagnosis code of malig-nant neoplasm of the lip and oral cavity (ICD-9-CM codes 140 to 141 and 143 to 145).
These cases were then linked to the ‘‘cause of death’’ data file covering the years 1997 to 2004; every sampled patient was subsequently followed for 5 years to analyze the mortality after their cancer resection. No one died of accidents (ICD-9-CM codes E800-E869, E880-E928, and E950-E999), and all cause mortality was used.
Surgeon and hospital oral cancer resection vol-ume groups. Because the 3-year surgeon and hos-pital volumes correlated well with annual volume, the surgeons and hospitals were divided into 3 volume groups according to the number of oper-ations performed between 1997 and 1999. Sur-geons and hospitals were sorted, in ascending order, by their total volume of resections of oral cancers. The volume category cutoff points (high, medium, and low) were determined by sorting the sample into 3 approximately equal groups, which is standard practice.15,16The volume cutoff points were determined deliberately so that each group would have approximately equal numbers of patients. The 3 surgeon volume groups were as
follows: < 52 patients (low-volume), 52 to 142 pa-tients (medium-volume) and > 142 cases (high-volume). The 3 hospital volume groups were as follows: < 343 patients (low-volume), 343 to 531 pa-tients (medium-volume) and > 531 papa-tients (high-volume).
Key variables of interest. The key dependent variable of interest was the 5-year survival of the patient; the key independent variables were the oral cancer resection volume groups for the sur-geons and the hospitals. The characteristics of the providers and the patients were also taken into consideration for risk adjustment. Surgeon char-acteristics included specialty (ear, nose, and throat [ENT]; general or plastic; or others), sex, and age. Age was used as a surrogate for practice experi-ence. The age of the surgeons was further catego-rized into 3 groups: # 40, 41 to 50, or $ 51 years. The hospital characteristics included the type of ownership (public, not-for-profit or for-profit), geographic location (Northern, Central, Southern, or Eastern Taiwan), teaching status (yes or no), and hospital level. The hospital level was the categorization of each hospital: a medical center (minimum of 500 beds), a regional hospital (min-imum 250 beds), or a district hospital (min(min-imum 20 beds). Hospital level could be used as a proxy for clinical service capabilities.
Patient characteristics included age (< 50, 50 to 64, 65 to 74, or > 74 years), sex, tumor subsite, and severity of illness. Tumor subsites were classified into 3 groups: tongue (ICD-9-CM codes 141.0-141.9), buccal mucosa (ICD-9-CM code 145.0), and others. No illness severity index is available at this time in Taiwan, and so we used a modified Charlson Index (the Deyo Charlson index) to adjust for patient comorbidities.17The comorbid-ities were identified by the diagnosis codes, with the total number of comorbidities being catego-rized as #1, 2, or $3.
Statistical analysis. Relative to surgeon and hos-pital oral cancer resection volume groups, chi-square or analysis of variance (ANOVA) tests were used to examine the distribution of surgeon, hospital, and patient characteristics. The cumula-tive 5-year survival rates and the survival curves were then calculated using the Kaplan-Meier method and compared by the log-rank test. A Cox proportional hazards regression model was conducted to evaluate the contribution of surgeon and hospital volume to the 5-year survival rate, while adjusting for the variables mentioned above. Hazard ratios (HR) are presented with the 95% percent confidence intervals (CI). Because the 2 variables were related closely to each other, the
surgeon and hospital volumes were analyzed under separate regression models. A 2-sided P value less than .05 was considered statistically significant. The SAS statistical package (SAS System for Win-dows, Version 8.2; SAS Institute, Cary, NC) was used for all of the analyses in this study.
RESULTS
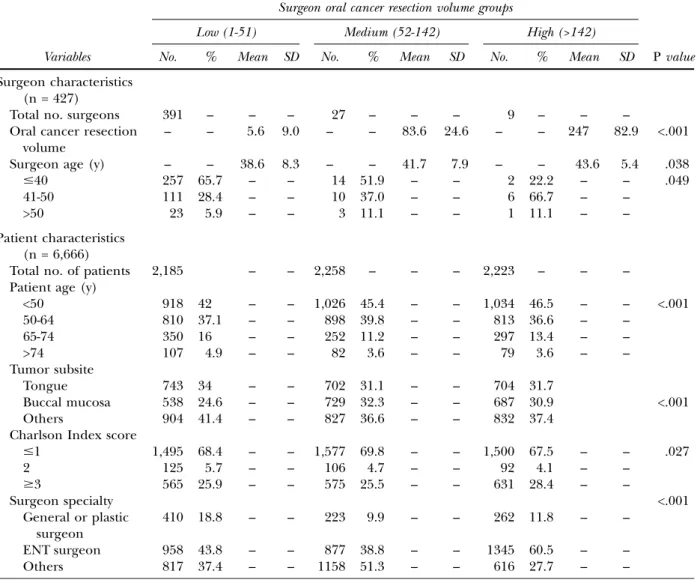
A total of 3,273 deaths (49.1%) were identified from the total sample of 6,666 patients undergo-ing resection of oral cancer between 1997 and 1999. Operations for these patients were per-formed by 427 surgeons, with an average of 15.6 operations per surgeon during the 3-year study period. The characteristics of the surgeons and patients, analyzed by surgeon volume, are pre-sented inTable I. The low-volume group was com-posed of 391 surgeons (91.6%), whereas the medium-volume group was composed of only 27 (6.3%). Although only 9 surgeons (2.1%) made up the high-volume group, they performed one-third of all operations. The mean age of the sur-geons in the sample was 38.9 years; the sursur-geons in the high-volume group were more likely to be older. Patients in the high-volume surgeon group were, on average, slightly younger than their counterparts in other groups, but with a higher comorbidity index score. The majority of the pa-tients (90.5%) were male.
The characteristics of the hospitals and the patients, analyzed by hospital volume, are pre-sented inTable II, which shows that oral cancer sur-gery was performed at 89 hospitals, with a mean of 74.9 resections per hospital over the 3-year period. The majority of the hospitals (92.1%) were in the low-volume group, and most of the hospitals in this group were regional hospitals. The medium-volume group was composed of only 4 hospitals, and the high-volume group was composed of just 3 hospitals. The 7 hospitals in the medium- and high-volume groups were medical centers and teaching hospitals. Patients treated in the high-volume hospitals had more comorbid conditions and tended to be younger than their counterparts in the other groups.
The unadjusted 5-year survival rates, by surgeon volume groups, are illustrated in Fig 1. With no adjustment for other characteristics, there were general improvements in the five-year survival be-tween low- and high-volume surgeon groups, from 45.5% for patients treated by low-volume surgeons to 49.9% for those treated by medium-volume sur-geons, and 51.8 % for those treated by high-volume surgeons (P < .001).
This positive association between survival and surgeon volume, however, was not observed with regard to hospital volume. The 5-year survival rates, by hospital volume groups, are presented in Fig 2, which shows that the survival rates were 47.5% for the low-volume hospital group, 51.3% for the medium-volume hospital group, and 49% for the high-volume hospital group (P = .074).
The 5-year survival rates, crude hazard ratios and adjusted hazard ratios, based on the Cox proportional hazards regression model, are pre-sented in Table III. The positive association be-tween survival and surgeon volume remained statistically significant after adjusting for the differ-ences in the case mix. Compared with operations performed by low-volume surgeons, patients whose operations were performed by high-volume sur-geons were found to have a 19% lower risk of
death (HR = 0.810; 95% CI, 0.735 to 0.893). Pa-tients whose operations were performed by me-dium-volume surgeons, however, were not found to have a significantly lower risk of death after ad-justing for other variables (HR = 0.923; 95% CI, 0.847 to 1.005).
Hospital volume alone, however, was not a significant predictor of 5-year survival for oral cancer resections. For those patients who had undergone oral cancer resections in the medium-and high-volume hospitals, the risk of death at 5 years was almost the same as it was for patients whose operations had been performed in the low-volume hospitals (HR = 0.944; 95% CI, 0.841 to 1.059 and HR = 0.996; 95% CI, .897 to 1.105, respectively).
Table IV describes 5-year oral cancer survival rates and adjusted HRs by surgeon resection Table I. Surgeon and patient characteristics in Taiwan, by surgeon oral cancer resection volume groups, 1997-1999
Surgeon oral cancer resection volume groups
Low (1-51) Medium (52-142) High (>142)
Variables No. % Mean SD No. % Mean SD No. % Mean SD P value
Surgeon characteristics (n = 427)
Total no. surgeons 391 – – – 27 – – – 9 – – –
Oral cancer resection volume
– – 5.6 9.0 – – 83.6 24.6 – – 247 82.9 <.001
Surgeon age (y) – – 38.6 8.3 – – 41.7 7.9 – – 43.6 5.4 .038
#40 257 65.7 – – 14 51.9 – – 2 22.2 – – .049
41-50 111 28.4 – – 10 37.0 – – 6 66.7 – –
>50 23 5.9 – – 3 11.1 – – 1 11.1 – –
Patient characteristics (n = 6,666)
Total no. of patients 2,185 – – 2,258 – – – 2,223 – – –
Patient age (y)
<50 918 42 – – 1,026 45.4 – – 1,034 46.5 – – <.001 50-64 810 37.1 – – 898 39.8 – – 813 36.6 – – 65-74 350 16 – – 252 11.2 – – 297 13.4 – – >74 107 4.9 – – 82 3.6 – – 79 3.6 – – Tumor subsite Tongue 743 34 – – 702 31.1 – – 704 31.7 Buccal mucosa 538 24.6 – – 729 32.3 – – 687 30.9 <.001 Others 904 41.4 – – 827 36.6 – – 832 37.4
Charlson Index score
#1 1,495 68.4 – – 1,577 69.8 – – 1,500 67.5 – – .027 2 125 5.7 – – 106 4.7 – – 92 4.1 – – $3 565 25.9 – – 575 25.5 – – 631 28.4 – – Surgeon specialty <.001 General or plastic surgeon 410 18.8 – – 223 9.9 – – 262 11.8 – – ENT surgeon 958 43.8 – – 877 38.8 – – 1345 60.5 – – Others 817 37.4 – – 1158 51.3 – – 616 27.7 – –
volume groups and the characteristics of the pa-tient, surgeon, and hospital. Generally, the ad-justed HR increases with the patient’s age and the Charlson comorbidity index score. The risk of death at 5 years was greater for patients who un-derwent resections of oral cancers by general or plastic surgeons compared with those performed by ENT surgeons and other specialists (HR = 0.877; 95% CI, 0.786 to 0.978 and HR = 0.889; 95% CI, 0.794 to 0.994. respectively).
DISCUSSION
More than 90% of our sample patients were male---a pattern that reflects the prevalence of a specific risk factor, the chewing of betel quid, the
same factor that is discernible in South-Central Asia and Melanesia.11Oral cancer is now one of the ma-jor malignancies in this area. In Taiwan specifically, there was a 5-fold increase in the incidences of oral cancer over the past 2 decades, which reflects the exact magnitude of the per capita growth in betel quid consumption on the island.18
To the best of our knowledge, this is the first study to undertake an examination of the volume-outcome relationship in the treatment of oral cancer. We have evaluated the long-term survival of these patients essentially because of the low-risk nature of oral cancer resections. Our findings suggest that an increase in surgeon volume corre-sponds to an increase in the 5-year survival rates for oral cancer patients in Taiwan; however, there Table II. Hospital and patient characteristics in Taiwan, by hospital oral cancer resection volume groups, 1997-1999
Hospital oral cancer resection volume groups
Low (1-342) Medium (343-531) High (>531)
Variables No. % Mean SD No. % Mean SD No. % Mean SD P value
Hospital Characteristics (n = 89)
Total no. of hospitals 82 – – – 4 – – – 3 – – –
Oral cancer resection volume – – 28.4 58.3 – – 457.5 70.5 – – 842 360.7 <.001 Hospital level Medical center 7 8.5 – – 4 100 – – 3 100.0 – – <.001 Regional hospital 50 61 – – – – – – – – – – District hospital 25 30.5 – – – – – – – – – – Teaching status Yes 75 91.5 – – 4 100 – – 3 100.0 – – .723 No 7 8.5 – – – – – – – – – – Patient characteristics (n = 6,666)
Total no. patients 2,316 – – – 1,824 – – – 2,526 – – –
Patient age (y)
<50 1,24 44.2 – – 790 43.3 – – 1,164 46.1 – – .013 50-64 851 36.7 – – 707 38.8 – – 963 38.1 – – 65-74 349 15.1 – – 237 13.0 – – 313 12.4 – – >74 92 4 – – 90 4.9 – – 86 3.4 – – Tumor subsite Tongue 728 31.4 – – 600 32.9 – – 821 32.5 – – Buccal mucosa 605 26.1 – – 540 29.6 – – 808 32.0 – – <.001 Others 983 42.4 – – 684 37.5 – – 897 35.5 – –
Charlson Index score
#1 1,561 67.4 – – 1,287 70.6 – – 1,724 68.2 – –
2 153 6.6 – – 87 4.8 – – 83 3.3 – – <.001
$3 602 26 – – 450 24.7 – – 719 28.5 – –
Surgeon specialty <.001
General or plastic surgeon 383 16.5 – – 80 4.4 – – 432 17.1 – –
ENT surgeon 985 42.5 – – 681 37.3 – – 1,514 59.9 – –
Others 948 40.9 – – 1063 58.3 – – 580 23 – –
is no similar association with hospital volume. Be-cause our nationwide study design was popula-tion-based and involved complete follow-up, we believe that the risk of selection bias is low, and that the data will remain valid if generalized.
Compelling evidence has already been pre-sented to support the benefits of high hospital and surgeon volume on the outcomes of cancer treatment.2-7,19-21 The independent contributions of each of these elements, however, remain uncer-tain. In a study of colon cancer resections using the
Surveillance, Epidemiology and End Results
(SEER)-Medicare linked database from 1991 to 1996 in a SEER area, Schrag et al22reported that outcomes were predicted by both hospital and sur-geon volume, but that hospital volume may well ex-ert a stronger effect. In contrast, Birkmeyer et al23 used information from the national Medicare claims database for the years 1998 and 1999 to ex-amine 4 cardiovascular procedures and 4 types of
cancer resection (esophagectomy, cystectomy, and pancreatic and lung resections) for which they had previously found a relatively strong association between hospital volume and operative mortality. They concluded that, according to the procedure carried out, certain proportions of the apparent hospital volume effect were attributable to surgeon volume. Hence, the observed associations between hospital volume and operative mortality were largely mediated by surgeon volume. Moreover, in a review of 163 studies examining volume ef-fects, Chowdhury et al24 found that 13 studies had examined both hospital and surgeon volume, and had carried out regression analyses to identify their relative contributions. After adjusting for hos-pital volume, high-volume surgeons were found to be beneficial in 11 of the studies (85%), whereas, after controlling for surgeon volume, only 6 stud-ies (46%) demonstrated significant benefit from high-volume hospitals. It would seem, therefore, Fig 1. Oral cancer survival rates for patients hospitalized
in Taiwan, by surgeon volume, 1997-1999. Surgeon vol-ume was defined as the number of oral cancer surgeries performed between 1997 and 1999. 1, High-volume group; 2, Medium-volume group; 3, Low-volume group.
Fig 2. Oral cancer survival rates for patients hospitalized in Taiwan, by hospital volume, 1997-1999. Hospital vol-ume was defined as the number of oral cancer surgeries taking place between 1997 and 1999. 1, High-volume group; 2, Medium-volume group; 3, Low-volume group.
Table III. Five-year oral cancer survival and hazard ratios, by surgeon and hospital resection volume groups Variables 5-year survival rate (%) Crude hazard ratio (95% CI) Adjusted hazard ratio*(95% CI) Surgeon volume Low (#51) 45.5 1.000 1.000 Medium (52-142) 49.9 0.898 (0.828-0.974)y 0.923 (0.847-1.005) High (>142) 51.8 0.840 (0.773-0.912)z 0.810 (0.735-0.893)z Hospital volume§ Low (# 342) 47.5 1.000 1.000 Medium (343-531) 51.3 0.905 (0.830-0.986)jj 0.944 (0.841-1.059) High (>531) 49 0.966 (0.893-1.044) 0.996 (0.897-1.105)
CI, confidence interval.
*Hazard ratios are adjusted for patient’s age, tumor subsite, the Charlson Index, surgeon’s age, surgeon’s specialty, and hospital characteristics, including hospital level, hospital ownership and geographical location.
yP < .01. zP < .001.
§Hospital volumes were analyzed under separate regression model. jjP < .05.
that a good number of the studies investigating hospital and surgeon volume simultaneously have suggested that, as independent variables, the sur-geon volume has greater influence on treatment outcomes than institutional volume.
Thus, the results of our study of oral cancer resections are consistent with the conclusions of most of the abovementioned studies: The skills or experience of individual surgeons may be more important than supportive hospital care. Operative
technique such as ensuring tumor-free margins may be an important factor. In addition, we assume that one of the possible reasons for our conclu-sions could be due to the surgeon’s decision on, and performance of, elective or radical neck dissection. The presence of cervical lymph node metastasis is one of the most significant predictive factors for oral cancer survival.25The incidence of occult cervical nodal metastases has been reported to be 20% to 30%26; thus, a carefully judged and Table IV. Five-year oral cancer survival rate and adjusted hazard ratios by surgeon resection volume groups and the characteristics of the patients and providers
Variables Adjusted hazard ratio 95% CI P value
Surgeon volume Low (#51) 1.000 Medium (52-142) 0.923 0.847-1.005 .066 High (>142) 0.810 0.735-0.893 <.001 Surgeon characteristics Surgeon Specialty General or plastic 1.000 ENT 0.877 0.786-0.978 .019 Others 0.889 0.794-0.994 .039
Surgeon’s age (y)
<41 0.940 0.866-1.022 .146 41-50 1.000 >50 1.104 0.982-1.241 .099 Patient characteristics Tumor subsite Tongue 1.000 Buccal mucosa 1.001 0.919-1.101 .896 Others 1.079 0.993-1.172 .072
Patient age (y)
<50 1.000
50-64 0.997 0.924-1.076 .937
65-74 1.217 1.100-1.347 <.001
>74 1.228 1.040-1.451 .016
Charlson Index score
#1 1.000 2 1.157 0.983-1.360 .079 $3 2.291 2.132-2.461 <.001 Hospital characteristics Hospital level Medical center 1.449 0.965-2.172 .074 Regional hospital 1.356 0.905-2.031 .140 District hospital 1.000 Hospital ownership Public 0.623 0.503-0.773 <.001 Private not-for-profit 0.701 0.575-0.854 <.001 Private for-profit 1.000 Geographic location Northern 1.000 Central 1.194 1.075-1.326 .001 Southern 0.995 0.913-1.085 .914 Eastern 1.274 1.045-1.553 .017
performed neck dissection could be a critical procedure for oral cancer resection. A study by Gilligan et al27reported that in treating early-stage breast cancer, higher volume surgeons were signif-icantly more likely to perform axillary lymph node dissection in accordance with the 1990 National In-stitute of Health consensus statement recommen-dations. It may be possible that surgeons who adopt a more aggressive treatment of the neck, whether through surgical or adjuvant therapy, might achieve outcomes that are more favorable. Further investigation is necessary to clarify this pos-sibility, along with other surgeon characteristics related to better outcomes.
In contrast, the role of hospital volume seems to be of less importance. Birkmeyer et al23 sug-gested that both surgeon and hospital volume could be of significant importance in most high-risk procedures, with the relative importance vary-ing accordvary-ing to the procedure bevary-ing performed. Because the resection of oral cancer is not a risky operation, the hospital facilities and surgical team support may not play such an important role in determining the treatment outcome. Furthermore, with the increasing threat of oral cancer in Taiwan, health authorities already have taken steps to control this highly recurrent malig-nancy by instituting various policies, such as the development of a core measurement set on the quality of care. Standards of care may have already been adopted in hospitals that would minimize the influence of hospital-specific care in low-volume hospitals.
Questions remain as to the underlying mecha-nisms by which higher volume providers can achieve better surgical outcomes. Whether pro-vider volume affects outcomes (the ‘‘practice makes perfect’’ hypothesis) or whether better institutes and physicians attract more patients (the ‘‘selective referral’’ hypothesis) remains diffi-cult to ascertain, and we cannot jump to any conclusions based upon our cross-sectional study. Nevertheless, we do have reason to believe that, in Taiwan, the ‘‘selective referral’’ hypothesis may be more important. Apart from the relatively low
copayment requirements of the compulsory
National Health Insurance program, there are basically no restrictions with regard to a patient’s choice of hospital or surgeon. Consulting with relatives and friends has been found to be the most popular way for patients in Taiwan to obtain information about physicians. As a result, those physicians with good reputations will invariably attract greater numbers of patients through Ôword of mouthÕ recommendations.28 However, further
longitudinal studies will be required to determine the true underlying mechanisms.
Limitations of this study arise primarily from the nature of the administrative data. Important infor-mation relating to the initial diagnosis, such as the cancer stage or the time elapsed between diagnosis and operation, are not available from the data. However, in a study by Begg et al21using a SEER-Medicare linked database, cancer stage and patient age were basically independent of hospital volume. Therefore, considering the relatively large sample population in our study, we have no reason to believe that such confounding would be a major caveat. Besides, the overall survival instead of can-cer-specific survival was used, because it was difficult to differentiate the cause-specific mortality based on the registry data. A similar volume-outcome study, however, by Roohan et al4reported no significant differences in 5-year survival models for mortality from all causes and from breast cancer.
The volume cutoff points for our study were determined deliberately so that each volume group would have approximately equal numbers of patients; therefore, the cutoff points for hospital and surgeon volume groups were different. The threshold used to define high and low volume and the number of volume groups may have substan-tially influenced the result of the analyses. More-over, owing to the incompleteness of the data, we did not adjust for adjuvant therapy, a factor that could be more important for coordinating hospital care. Hence, it is possible that there may be some association between hospital volume and oral can-cer survival that we failed to identify.
Another important limitation of using adminis-trative information is the quality of the
risk-adjust-ment technique. Although we adjusted for
comorbidities using a widely adopted method,17 it may not reflect adequately the clinical condition or health status of the patients. Accordingly, it should not be surprising to find that the risk of death is greater for the general or plastic surgeon group, whose patients may need more extensive reconstructive surgery, but this possibility cannot be identified from the administrative database we used. Finally, although the results of our study are highly significant statistically, the differences we measured in oral cancer survival rates may be of questionable clinical significance.
In summary, despite the abovementioned limita-tions, our findings provide support for earlier studies on the effects of provider volume with regard to treatment outcomes. We found that for those patients who had undergone oral cancer resections in Taiwan, after adjusting for differences
in the case mix, there was an association between high-volume surgeons and better 5-year survival. This association was not discernible, however, for high-volume hospitals. Even with such strong evidence of a volume-outcome relationship, it is important to recognize that, at an individual level, low-volume surgeons or hospitals may well be pro-viding excellent care and positive outcomes, and that higher volume does not necessarily equate to superior outcomes. Further research should be carried out in an attempt to determine the specific operative techniques or processes of care that con-tribute to such variations if we are to succeed in improving the quality of care for oncology patients.
REFERENCES
1. Halm EA, Lee C, Chassin MR. Is volume related to outcome in health care? A systematic review and methodologic cri-tique of the literature. Ann Intern Med 2002;137:511-20. 2. Begg CB, Riedel ER, Bach PB, Kattan MW, Schrag D,
War-ren JL, et al. Variations in morbidity after radical prostatec-tomy. N Engl J Med 2002;346:1138-44.
3. Hodgson DC, Zhang W, Zaslavsky AM, Fuchs CS, Wright WE, Ayanian JZ. Relation of hospital volume to colostomy rates and survival for patients with rectal cancer. J Natl Can-cer Inst 2003;95:708-16.
4. Roohan PJ, Bickell NA, Baptiste MS, Therriault GD, Ferrara EP, Siu AL. Hospital volume differences and five-year sur-vival from breast cancer. Am J Public Health 1998;88:454-7. 5. Dimick JB, Wainess RM, Upchurch GR Jr, Iannettoni MD, Orringer MB. National trends in outcomes for esophageal resection. Ann Thorac Surg 2005;79:212-6.
6. Meyer HJ. The influence of case load and the extent of resection on the quality of treatment outcome in gastric cancer. Eur J Surg Oncol 2005;31:595-604.
7. Sosa JA, Bowman HM, Gordon TA, Bass EB, Yeo CJ, Lillemoe KD, et al. Importance of hospital volume in the overall man-agement of pancreatic cancer. Ann Surg 1998;228:429-38. 8. Peterson ED, Coombs LP, DeLong ER, Haan CK, Ferguson
TB. Procedural volume as a marker of quality for CABG sur-gery. JAMA 2004;291:195-201.
9. Horn M, Morgan MK, Ingebrigtsen T. Surgery for unrup-tured intracranial aneurysms in a low-volume neurosurgical unit. Acta Neurol Scand 2004;110:170-4.
10. Taub DA, Miller DC, Cowan JA, Dimick JB, Montie JE, Wei JT. Impact of surgical volume on mortality and length of stay after nephrectomy. Urology 2004;63:862-7.
11. Parkin DM, Bray F, Ferlay J, Pisani P. Global cancer statistics, 2002. CA Cancer J Clin 2005;55:74-108.
12. Sudbo J. Novel management of oral cancer: a paradigm of predictive oncology. Clin Med Res 2004;2:233-42.
13. La VC, Lucchini F, Negri E, Levi F. Trends in oral cancer mortality in Europe. Oral Oncol 2004;40:433-9.
14. Bureau of Health Promotion (Taiwan). Cancer Registry Annual Report, 2002, Republic of China (in Chinese). Tai-pei: Department of Health, The Excecutive Yuan, Republic of China; 2005.
15. Laks MP, Cohen T, Hack R. Volume of procedures at trans-plantation centers and mortality after liver transtrans-plantation. N Engl J Med 2000;342:1527.
16. Goodney PP, Stukel TA, Lucas FL, et al. Hospital volume, length of stay, and readmission rates in high-risk surgery. Ann Surg 2003;238:161-7.
17. Deyo RA, Cherkin DC, Ciol MA. Adapting a clinical comor-bidity index for use with ICD-9-CM administrative data-bases. J Clin Epidemiol 1992;45:613-9.
18. Directorate-General of Budget, Accounting and Statistics (Taiwan). Statistical Yearbook of the Republic of China. Taipei: The Excecutive Yuan, Republic of China; 2003. 19. Hillner BE, Smith TJ, Desch CE. Hospital and physician
vol-ume or specialization and outcomes in cancer treatment: importance in quality of cancer care. J Clin Oncol 2000; 18:2327-40.
20. Hannan EL, Radzyner M, Rubin D, Dougherty J, Brennan MF. The influence of hospital and surgeon volume on in-hospital mortality for colectomy, gastrectomy, and lung lobectomy in patients with cancer. Surgery 2002;131:6-15. 21. Begg CB, Cramer LD, Hoskins WJ, Brennan MF. Impact
of hospital volume on operative mortality for major cancer surgery. JAMA 1998;280:1747-51.
22. Schrag D, Panageas KS, Riedel E, Hsieh L, Bach PB, Guil-lem JG, et al. Surgeon volume compared to hospital volume as a predictor of outcome following primary colon cancer resection. J Surg Oncol 2003;83:68-78.
23. Birkmeyer JD, Stukel TA, Siewers AE, Goodney PP-Wennberg DE, Lucas FL. Surgeon volume and operative mortality in the United States. N Engl J Med 2003;349: 2117-27.
24. Chowdhury MM, Dagash H, Pierro A. A systematic review of the impact of volume of surgery and specialization on patient outcome. Br J Surg 2007;94:145-61.
25. Woolgar JA, Rogers SN, Lowe D, Brown JS, Vaughan ED. Cervical lymph node metastasis in oral cancer: the impor-tance of even microscopic extracapsular spread. Oral Oncol 2003;39:130-7.
26. Beenken SW, Krontiras H, Maddox WA, Peters GE, Soong S, Urist MM. T1 and T2 squamous cell carcinoma of the oral tongue: prognostic factors and the role of elective lymph node dissection. Head Neck 1999;21:124-30.
27. Gilligan MA, Neuner J, Sparapani R, Laud PW, Nattinger AB. Surgeon characteristics and variations in treatment for early-stage breast cancer. Arch Surg 2007;142:17-22. 28. Cheng SH, Song HY. Physician performance information
and consumer choice: a survey of subjects with the freedom to choose between doctors. Qual Saf Health Care 2004;13: 98-101.