1
The Association of Board Structure and Composition with Nonprofit
Hospitals’ Donation Revenues
Yi-Cheng Ho, Ph.D. Professor,
Department of Public Finance, National Cheng-Chi University E-mail:[email protected]
Jenn-Shyong Kuo, Ph.D. Associate Professor,
Department of Accounting, National Taipei University Email: [email protected]
Abstract
A two-part model is applied to a unbalanced panel data consisting of 39 not-for-profit hospitals from 2000 to 2010, in order to estimate the relationship between board composition and probability of donation revenues, and association with board and donation revenue amount. The first part of the two-part model used logit analysis to predict the probability of donation revenues and the board composition, the empirical result is insignificant. The second part of the linear regression model indicated that both the board size and CEO on board are negative associated with the donation revenue. CEO on small size board has positive relationship with the donation revenue. The result indicated that the board structure and composition were the determinants of hospitals’ donation revenue, however, were irrelevant to the probability of receiving donation revenues.
Keywords: nonprofit hospitals, board structure and composition , donations
2
1. Introduction
The goal of this paper is to explore the relationship between board composition and structure and donation revenues in Taiwan’ nonprofit hospitals. A non-profit's board has several important responsibilities to fulfill, one major mission is to monitor the organization’s operations the other is fundraising and donations and operational duties (O’Regan, and Oster, 2005). The non-profit
hospitals serve more commercial than social roles (Hansmann, 1980). The governmental regulations for the non-profit sectors are loose. Past studies pointed out that non-profit organizations lack effective external control mechanisms. Internal control mechanisms become the main supervision mechanism, and board is an important and effective internal supervision mechanism. This study is to examine the influence of board size, percentage of outsiders, CEO on small size board on the
probability of received donation and amount donation revenue received by not-for-profit hospitals. Nonprofit hospitals’ long term capital mainly comes from net assets and long term debt. The net assets mainly consist of donor capital and retained earnings. The governmental subsidies to nonprofit hospitals have been declining and the competition in the health care market is increasing, resulting in increasing demand for investment in medical equipment. As it is difficult to accumulate operating surplus, some hospitals raise funds by debt financing. Faced with nonprofit hospitals periodic
payment of interest and pressure to repay due principal, nonprofit hospitals’ board and management echelon are more concerned about financial performance, resulting in reduction in free medical care to improve the operational surplus (Magnus, Smith, and Wheeler, 2003; Kuo, Ho, and Lo, 2006). In addition, there will be an over-investment in equipment, which is not conducive to the accumulated surplus. By contrast, nonprofit organizations can obtain donor capital at lower cost with less damage to operational mission.
As a commercial nonprofit organization, the nonprofit hospital (Hansmann, 1987) depends on medical care as the major financial source. By contrast, donation revenues account for a low percentage of the total income; however, the absolute amount of nonprofit hospitals’ donation revenues is high. According to the data of 2000-2010, donation revenues had been increasing since 2000 and reached about NTD 5.6 billion in 2006, and started to decline over the years afterwards. During the data period of this study, on average, the donation revenues account for about 5.4% of the total income of the hospital, and the average donation revenues is five times of the net profit of the medical service income and 1.85 times of the total net profit. To conclude, nonprofit hospitals’ donation revenues still play a very important role in the financial stability of hospitals.
Previous studies on board functionality emphasize on board size and independence. First, in the aspect of board size, board size expansion has two effects; one is that the size expansion will worsen the problem of free-riding in team work, making the agency problem even worse. On the other hand, the benefit of board size expansion is that it can accommodate directors in different disciplines. Since the function of profit organization’s board is mainly of supervision, the profit organization board’s diversified benefits are lower than agency costs; therefore, board size expansion can reduce the supervision effectiveness (Jensen, 1993). The profit organization’s empirical findings suggest board
3
size and performance are negatively correlated (Yermack, 1996; Coles, Daniel, and Naveen, 2008). In the aspect of nonprofit organization, the nonprofit organization’s board functions are not limited to supervision but including fund raising and administrative work. The expansion of the board size in a nonprofit organization can produce opportunities to invite professionals of different fields to serve as directors to satisfy the diversified demands for work. Therefore, the benefits are higher as compared with the profit organization (Oster, 1995). The final effect of the nonprofit organization board size expansion is determined by the tradeoff relationship between agency costs and professional interests. previous empirical studies have suggested, board size and operating efficiency are negatively
correlated or have no relationship at all, indicating that board size expansion is not conducive to supervision efficiency (Dyl, Frant and Stephenson 2000; Callen et al., 2003; Andres-Alonso, Cruz, and Romero-Merino 2006). However, it is positively correlated to donation revenues, being
conducive to increase in donation revenues (Olson, 2000; O'Regan and Oster, 2005; Brickley, Van Hornb, and Wedig, 2010; Callen, Klein and Tinkelman, 2010).
Secondly, in terms of board independence, studies on profit organization argue that managers prefer directors of low independence as the probability of replacing the managers is higher if the independence of directors is higher (Hermalin and Weisbach, 1988). The engagement in supervision activities by directors can produce negative effects; however, information obtained from supervision activities can be used to assess manager performance, and enhance share value and help improve director’s personal reputation for diligence to create positive effects. Hence, the benefits brought about by supervision activities to outside directors will be higher than benefits to inside directors. Independent directors of major shareholders can help improve company value (Shleifer and Vishny, 1986; Rosenstein and Wyatt, 1990). For nonprofit organizations, most directors are unpaid volunteers and nonprofit organizations have not issued shares. The major motivation of outside directors to enter the board for service is the recognition of the organizational mission and belief in capabilities to accomplish the tasks (Moyers and Enright, 1997). Such an interest in participating in
organizational objectives can enhance board independence, increase directors’ motivation to monitor managers, and thus enhance organizational performance. Empirical results suggest that higher level of board independence (outside directors’ percentage) will result in higher efficiency of the nonprofit organizations or have no relation at all (Callen, Klein, and Tinkelman, 2003; Andrés-Alonso, Cruz, & Romero-Merino, 2006). In terms of donation, there are two viewpoints, one is that the donor will consider whether the donations will be abused in selecting the object of donation (Fama and Jensen, 1983; Hansmann, 1980), board with high level of independence can reduce the probability of abusing donation resources to help board fund raising performance (Fama and Jensen, 1983; Hansmann, 1980). Another viewpoint is that the board composition and structure have interactive relations with CEO’s rights. Powerful CEO tends to choose directors willing to donate who have no time in supervision. Hence, the greater influencing power of the CEO will result in lower board
independence and more personal donations of the directors (O'Regan and Oster, 2005; Brickly, Van Horn, and Wedig, 2010).
4
2. Literature Review
The nonprofit hospital’s board has multiple tasks. In addition to the planning and supervision tasks similar to the profit organization’s board (e.g., responsible for the planning of the operational principles of the hospital, monitoring and assessment of the management), the board is responsible for tasks different from those of the profit organization’s board. For example, the nonprofit
organization’s board needs to collect and manage resources and participate in the activities of the hospital. As the main goals of the nonprofit organizations are different from those of the profit organizations, it results in differences in board composition and structure, causing different impact on organizational operational performance.
Previous studies on corporate governance mainly emphasize on profit organization to discuss the impact of business performance and relevant factors on corporate governance (Demsetz and Lehn, 1985; Hermalin and Weisbach, 1988; Brickley and James, 1987; Shivdasani and Yermack, 1999; Baker and Gompers, 2000), and the impact of corporate governance on company control
mechanisms (e.g., replacing CEO, anti-takeover provisions) (Weisbach, 1988; Brickley, Coles, and Terry, 1994) and performance (Mock, Shiefer, and Vishny, 1988; Hermalin and Weisbach, 1991; Yermack, 1997).
By contrast, few articles have discussed the governance of nonprofit organizations. As nonprofit organizations have some different characteristics from profit organizations (e.g., multiple target functions with complexity, operational surplus allocation limit, intransferability of ownership, and taxation preference). Therefore, the conclusions of profit organizations cannot be directly applied in nonprofit organizations. In particular, nonprofit organizations lack in effective external governance mechanisms (Fisman and Hubbare, 2003; Glaeser, 2003; O’Regan and Oster, 2005). By contrast, internal governance mechanisms become even more important, and board is one of the important factors of internal governance (Fama and Jensen, 1983; Andres-Alonso, Cruz and Romero-Merino, 2006).
Compared with profit organization’s board’s major function of supervision, nonprofit organizations’ board is also responsible for fund-raising and financial management, as well as participation in organizational activities and administrative job (Olson, 2000; O'Regan and Oster, 2005). Hence, the performance of a nonprofit organization’s board should be evaluated in multiple aspects and the common measurement indicators include: the performance of the nonprofit
organization converting input resources into out (efficiency), the performance of getting external resources (fund-raising) and achieving the mission of the organization (efficacy).
Most of the studies on the correlation of nonprofit organizations’ donation revenues discuss the impact of donation price, fund-raising cost and reputation on the donation revenues (Wiesbrod and Dominquez, 1986; Posnett and Sandler, 1989; Khanna, Posnett, and Sandler, 1995; Okten and Weisbrod, 2000). The follow-up studies start to discuss the impact of nonprofit organizations’ operating efficiency (Drtina 1984; Cherny, Gordon, and Herses, 1992), financial stability (Parsons 2003, JAL), quantity of information available (Weisbrod and Dominquez 1986), quality of
5
information provided and reputation (Trussel and Parsons 2008; Tinkelman 1999), debt financing (Kuo, Ho, and Lo, forthcoming) and credit rating (Gordon, Knock, and Neely, 2009), network
disclosure (Saxton, Neely, and Guo, 2009) on donation revenues. Due to limitation in data access, the discussions on impact of board characteristics on revenues only appear in recent years.
In studies relating to the correlation between nonprofit organization’s board and donation, board characteristics including board size and independence are often used to measure. Articles relating to donation correlation are illustrated as below:
First, regarding board size, when board size expands, there will be more space for diversified professionals to satisfy the multiple needs of the board of the nonprofit organization. However, expanding board will result in difficulties of communications among board directors and free-riding behaviors in teamwork to worsen the problem of agency. Profit organization related studies have suggested that too many board directors can result in trouble in communications, coordination and decision-making, lowering supervision capacity of the directors, and thus reducing organizational efficiency (Eismberg, Sundgren and Wells, 1998; Yermack, 1996). As the nonprofit organization’s board needs to accomplish multiple tasks, the benefits of board size expansion are greater than costs (Oster, 1995). The empirical studies often use the number of directors on the board (Olson, 2010; Brickly, Van Horn, and Wedig, 2010; Callen, Klein, and Tinkleman, 2010), or proxy variables to represent different sizes of the board (O’Rgean and Oster 2005) to measure the impact of the board size. According to the empirical results, board size is positively correlated to the organization’s donation revenues (Olson, 2000; Brickly, Van Horn, and Wedig, 2010; Callen, Klein, and Tinkleman, 2010), and personal donation of the director (O’Rgean and Oster 2005).
Second, in terms of board independence, higher board independence results in stronger incentives to monitor managers. The studies on profit organizations have suggested that, board independence and corporate performance are positively correlated (Baysinger and Butler, 1990; Rosenstein and Waytt, 1990). In the aspect of nonprofit organizations, there are two types of viewpoints:
(1). Fama and Jensen (1983) and Hasmann (1980) suggested that higher board independence can better reduce the abuse of donation resources. Therefore, donators tend to donate to nonprofit organizations of high level of board independence, thus, it can be concluded that board independence and donation revenues are positively correlated.
(2). O’Rgean and Oster (2005) argued that duality of manager and director in the nonprofit organization or manager participating in director selection process will affect board composition and structure (Hermalin and Weibach, 1998). As directors of nonprofit organizations should accomplish multiple tasks, managers will tend to select directors in favor of donation but not willing to take part in monitoring activities. In other words, regarding lower board independence, director donations will be higher.
Measures commonly used in empirical studies include non-employee director percentage (Weisach, 1998; Byrd and Hickman, 1992), employee director salary (Callen and Falk, 1993), CEO
6
with board voting rights, CEO participating in director selection process (O’Rgean and Oster 2005; Brickley, Van Horn and Wedig, 2010). According to empirical results, board independence is
significantly negatively correlated to nonprofit organizations’ donation revenues (Brickly, Van Horn, and Wedig, 2010), and personal donation of the director (O’Rgean and Oster 2005).
Third, smaller board size will enhance board independence as the communications becomes smoother due to small number of directors without needing managers for coordination and illustration of decision-making. As a result, the impact of CEO on directors reduces. In addition, smaller board size results in less space for diversified directors and reduces the probability of focusing on donating directors, and thus reducing director donation and promoting fund-raising. In other words, smaller board size will result in reducing influence of the manager, increasing level of board independence and reduced donation revenues.
In sum, serving as the president in case of a small board is negatively correlated to donation revenues. There are studies on the impact of personal characteristics of directors, such as director tenure, director serving in other nonprofit organizations as director, director professional or work background, director race, and director gender. According to empirical results, donation revenues are positively correlated to director term and director professional homogeneity (Olson, 2000; O’Rgean and Oster 2005). Donation revenues are positively correlated to director serving in other nonprofit organizations as a director and director family members as the beneficiaries (O’Rgean and Oster 2005).
3. Hypothesis
Based on the nonprofit hospitals’ board size and independence, this paper establishes three donation-related hypotheses. Regarding board size, when nonprofit organizations’ board size expands, more diversified professional talents can be invited to serve as the directors to broaden sources of knowledge, information and wisdom of nonprofit organizations (Bantel and Jackson, 1989; Hambrick and D'Aveni, 1992; Hambrick and Mason, 1984). Although expansion of board size can worsen the agency problem, it can increase number of directors of high donation willingness or directors with fund-raising capabilities to create the “warm glow effect” (Andreoni, 1993). In other words, larger board size can lead to more nonprofit hospitals’ donation revenues (Olson, 2000; O'Regan and Oster, 2005; Brickley, Van Hornb, and Wedig, 2010; Callen, Klein and Tinkelman, 2010). It can be inferred from this theory that larger board size can increase the probability to hire directors of donation willingness or directors of fund-raising capabilities. Meanwhile, more liaison channels between directors and the outside world will lead to higher probability of receiving donation revenues. The hypotheses are provided as follows:
[Hypothesis I] When other conditions remain unchanged, a larger board size leads to a higher
probability of receiving donations.
[Hypothesis II] When other conditions remain unchanged and nonprofit hospitals have
received donations, a larger board size leads to more donation revenues.
7
relationship between board independence and donation revenues. One is that nonprofit organizations’ board independence can reduce agency problem and enhance performance (Callen et al., 2003; Andrés-Alonso et al., 2006) as high independence of the board can prevent the abuse of donation resources (Fama and Jensen, 1983; Hasmann, 1980), better win donator’s trust to receive more donations. In other words, board independence and donation revenues are positively correlated. On the other hand, Hermalin and Weisbach (1988) employed the CEO-Board bargaining model to find that greater manager capabilities and influencing power are often accompanied by weak board. High level of board independence is often accompanied by managers of low capabilities and influencing power. If managers can affect the selection of the directors, they tend to select directors with high donations and participation in fund-raising activities but not interested in supervision activities. Therefore, higher influencing power of the manager will result in lower level of board independence and more donation revenues. In other words, board independence and donation revenues are
negatively correlated (O'Regan and Oster, 2005; Callen, Klein and Tinkelman, 2010). Therefore, this study proposes the following Hypothesis:
[Hypothesis III] When other conditions remain unchanged, higher board independence of
nonprofit hospitals leads to a higher probability of receiving donation revenues.
[Hypothesis IV] When other conditions remain unchanged and nonprofit hospitals have
received donations, higher board independence of nonprofit hospitals lead to more hospital donation revenues.
Regarding board size and independence, when the board size is larger, it is more difficult for directors to communicate with each other. Directors often have to rely on the manager to provide information and illustrations for decision-making, thus, the impact of manager on directors is greater, further reducing the level of board independence. On the contrary, if the board size is smaller, the communications between directors is better, thus reducing the impact of manager and increasing the board independence accordingly. In addition, decreasing board size can lead to decrease space for diversified directors and reducing the probability of selecting directors focusing on donations. As a result, the donations and fund-raising of directors will be reduced. According to Hypothesis III and IV, board independence and donation revenues are negatively correlated. It thus can be inferred that when the hospital president serve as a direction on a small board, the board independence is
relatively higher, therefore, the donation revenues will increase. In other words, serving as the
president of a hospital with a small board and donation revenues are positively correlated. Hence, we developed the following Hypothesis:
[Hypothesis V] When other conditions remain unchanged, the nonprofit hospital’s board size is
small and the hospital president is a director, both the board independence and the probability of receiving donation revenues are higher.
[Hypothesis VI] When other conditions remain unchanged and nonprofit hospitals have
received donations, if the nonprofit hospital’s board size is small and the hospital president is a director, both the board independence and the hospital donation revenues are higher.
8
4. Empirical model
Model specification
Nonprofit hospitals are nonprofit organizations of relatively high commercial characteristics and the financial sources for operations often come from commercial activities. By contrast, other
nonprofit organizations’ dependence on donation is higher, thus, most nonprofit hospitals’ donation revenues are zero. This paper discusses the correlation between the nonprofit hospital’s board structure and composition, and donation revenues in two stages. First, the logit model is used to review the probability of nonprofit hospitals receiving donations, and the linear regression model is used to analyze the donation revenues of given nonprofit hospitals. The reasons for the two-stage analysis and discussion of the nonprofit hospitals’ donation revenues are: first, nonprofit hospitals’ donation revenues can be obtained from the financial statements. When the donation revenues are zero, it is not unable to observe the donation revenues, thus, the models can be respectively established (all zero donation observations were observed rather than unobserved in financial statement). Second, Tobit regression makes a strong assumption that same probability mechanism generates both the zero and the positives. In fact, nonprofit hospitals receiving donations or not and the amount of donation revenues production mechanism may be different. Hence, this paper
discusses the correlation between nonprofit hospitals’ donation revenues and board structure and composition in two stages.
At the first stage, this paper uses the logit model to analyze the probability of nonprofit hospitals receiving donations. The factors influencing probability include board structure and composition and characteristics of nonprofit hospitals.
Pr( DONi,t >0) = β0 + β1 BSIZEi,t + β2 BOUTi,t + β3 EOBi,t + β4 Bsmalli,t * EOBi,t
+ β5 ln PRICEi,t-1 + β6 ln OVERHEADi,t-1 + β7 ln PREVi,t-1 (1) + β8 ln AGEi,t + β9 ln WEALTHi,t + β10 ln TOTASSi,t
+ β11 DEBTi,t-1 + β12 mi + ei,t
where, i is the hospital, t is the year. dependent variablePr(DONi,t>0) is thebinary outcome; when donation revenues of the i-th nonprofit hospital in Year t are more than zero, Pr(DONi,t>0) =1, otherwisePr(DONi,t>0) = 0; BSIZE is the board number; BOUT is the percentage of outside directors(non-employee directors); EOB is the proxy variable of duality of hospital president as a director; SMALL is the proxy variable of small-sized board (board directors are fewer than or equal to 9); donation price (lnPRICE) is the natural logarithm of the division of the total cost by cost for purpose business; overhead cost ratio (lnOVERHEAD) is the natural logarithm of the division of total cost by overhead cost (fixed cost or constant cost); purpose business revenues (lnPREV) is the natural logarithm of purpose business revenues; age of hospital (lnAGE) is the natural logarithm of the age of nonprofit hospital; annual available wealth (lnWEALTH) is the natural logarithm of the
9
division of nonprofit hospitals’net assets by total cost; total assets (lnTOTASS) is the natural logarithm of the year end total assets; DEBT is the debt ratio defined as the division of total
liabilities by total assets; mi is the features of the i-th hospital that cannot be observed; finally, ei,t is the residual item. According to Hypothesis I, it is expected β1>0, according to Hypothesis III, it is expected that β2>0 and β3<0, according to Hypothesis V, it is expected that β4>0.
At the second stage, this paper uses linear regression model by assuming given hospitals have received donations to estaimate the correlation between board structure and compositionof nonprofit hospitals, hospital characteristics, and donation revenues. In regression analysis, natural logarithm is used to convert donation revenues, thus reducing skew in the dependent variable. The regresison equation is as shown below:
ln DONi,t = α0 +α1 BSIZEi,t +α2 BOUTi,t +α3 EOBi,t +α4 Bsmalli,t * EOBi,t
+α5 ln PRICEi,t-1 +α6 ln OVERHEADi,t-1 +α7 ln PREVi,t-1 (2) +α8 ln AGEi,t +α9 ln WEALTHi,t +α10 ln TOTASSi,t
+α11 DEBTi,t-1 +α12 mi + εi,t
where, dependent variable ln DON is the natural logarithm of donation revenues of the i-th nonprofit hospital in year t; board structure and composition, observable hospital characteristics and unobservable hospital characteristicsare the same with Equation (1). According to Hypothesis II, it is expected that α1>0, according to Hypothesis IV, it is expected that α2>0 and α3<0, according to Hypothesis VI, it is expected α4>0.
To reduce the possible endogeneity of the explanatory variables and explained variables, data of donation price, overhead cost ratio, purpose business revenue, debt ratio are of the previous year.
When estimating the first stage logit regression and the second stage linear regression, this paper first estiamtes the panel data’s fixed effect model and random model before testing whehter there are panel data model characteristics of individual hospitals. Afterwards, Hausman test is employed to determine the better one between the fixed effect model and the random effect model.
5. Variable Definition
1. Donation revenues
The linear regression model uses the nonprofit hospitals’ donation revenues as the dependent variable. This paper uses the natural logarithm of the donation revenues (thousand NTD) for
measurement. As some nonprofit hospitals do not list donation revenues or the donation revenues are 0, donation revenues are replaced by NTD 10 to prevent the infinity of conversion into natural logarithm (Gillingan&Smirlock, 1984; Kim, 1987; Weninger, 2003). The sensitivity analysis uses the proportion of donation revenues against total revenues and donation revenues as the proxy variables.
2. Board structure and composition variables
10
president serving as a director, and hospital president serving as a director in a small board to measure board characteristics. The relevant definitions and illustrates are as follows:
(1) Board size (BSIZE):
When the board size expands, there will be more space for inviting personnels of different professions to serve as the board directors to meet the needs of the nonprofit organization board. However, as board size expansion will result in difficulties of communications between directors, the problem of agency and the problem of free-riding will be worsening. Studies on profit
organization have suggested that excessive board memembers will result in trouble in
communications, coordination and decision-making, reduced monitoring capabilities of directors and further reducing organizational efficiency (Eismberg, Sundgren and Wells, 1998; Yermack, 1996). However, since the nonprofit organization board is required to accomplish diversified tasks, the benefits of board size expansion are higher than the cost (Oster, 1995). Previous empirical studies often use number of board members (Olson, 2010; Brickly, Van Horn, and Wedig, 2010; Callen, Klein, and Tinkleman, 2010), or proxy variables to represent different board types (O’Rgean and Oster, 2005) to measure board size. According to empirical results, board size is significantly positively correlated to organizational donation revenues (Olson, 2000; Brickly, Van Horn, and Wedig, 2010; Callen, Klein, and Tinkleman, 2010) and personal donation of the director (O’Rgean and Oster, 2005). This paper uses the number of board members to measure board size . (positive)
(2) Board independence:
A higher level of board independence results in stronger incentives to monitor the manager. Studies on profit organizations have suggested that, board independence and corporate
performance are positively correlated (Baysinger and Butler, 1990; Rosenstein and Waytt, 1990). Regarding the studies on nonprofit organizations, there are two opposing viewpoints about the impact of board independence on donation revenues. One is that higher level of board
independence means more capabilities to reduce the abuse of donation resources. As a result, donators tend to donate the resources to nonprofit organizationsof high board independence level. Therefore, board independence and donation revenues are positively correlated (Fama and Jensen, 1983; Hasmann, 1980). Another viewpoint argues that the nonprofit organization’s board is responsible for multiple tasks, in the formation of board, the manager will prefer board
directors in favor of donation but unwilling to spend too much time in monitoring activities (Hermalin and Weibach, 1998). In other words, when CEO serves as a board director or is able to participate in the selection of board directors, the level of board independence is lower and the donations by board directors is more (O’Rgean and Oster, 2005). Indicators to measure board independence in previous studies includenon-employee director percentage (Weisach, 1998; Byrd and Hickman, 1992; Callen et al. 2003), employee director salary (Callen and Falk, 1993), CEO having board voting rights, CEO participating in board director selection procedure (O’Rgean and Oster 2005; Brickley, Van Horn and Wedig, 2010). According to empirical results, board
11
independence is significantly negatively correlated to nonprofit organizations’ donation revenues (Brickly, Van Horn, and Wedig, 2010) and personal donation of the director (O’Rgean and Oster 2005). This paper uses two indicators to measure the board independence and the definitions are as illustrated as below:
A. Percentage of outside directors (non-employee director percentage; BOUT): the monetary returns of nonprofit organizations’ outside directors are low while outside directors on the board need to spend personal time and professional knowledge. Form the non-monetary perspective, outside directors are donators of non-financial resources with relatively strong supervisory motivations and higher level of independence (Fama and Jensen, 1983). Since outside directors are donators of non-financial resources, some studies used the percentage of outside directors as the proxy variable of the percentage of major donators serving as directors (Callen and Falk, 1993). This paper measures board independence by the division of nubmer of non-employee directors by board size(Weisach, 1998; Byrd and Hickman, 1992;Callen et al., 2003). In other words, higher percentage of outside directors leads to a higher level of board independence and more donation revenues.
B. Hospital president serving as a board director (EOB): the hospital president has the medical professional background and the private information of the hosptial in which the outside directors lack. When serving as a board director, the hospital president can directly
communicate with other board directors to affect board decision-making. There search data have suggested that, the hospital president can have board voting rights only when serving as a board director. In this case, the level of board independence will be reduced. This paper uses the 0/1 proxy variable to measure hospital president serving as a board director
(O’Rgean and Oster 2005; Brickley, Van Horn and Wedig, 2010). This paper expects that the hospital president serving as a board director can reduce the level of board independence and donation revenues. (negative) when the hospital president serves as a director on a small board (BSMALL x EOB): when the board size of the nonprofit organization is relatively small, the possibility to accommodate more diversified directors is lower and thus it will reduce the persuasion power of the hospital president serving as a board director. Therefore, the overall board independence can be improved. According to the Act of Medical Care, the number of directors of the board of a medical organization should be 9-15. However, as director inadequacies in some nonprofit hospitals may not be made up immediately by election, the number of directors of the board may be lower than 9 (or below). This paper uses the 0/1 proxy variable to measure cases with number of board directors fewer than 9 people (or below) (BSMALL =1). When setting the empirical model, the multiplication of the small board proxy variable (BSMALL) and hospital president serving as a board director (EOB) is used to measure the situation when the hospital president serves as a director of the small board. This paper expects that the board independence level would be higher when the hospital president serves as a director of the small board, thus increasing the donation
12
revenues. In other words, hospital president serving as a director on a small board and donation revenues are positively correlated.
3. Control variable
(1). Donation price (PRICE):
Donation price is used to measure average sum donated by donors when non-profit
organizations make investment so as to know efficiency of program service and output of non-profit organizations. Weisbrod and Dominguez (1986) defined donation price as , is the marginal tax rate, is the ratio of administration cost to total expenses, is the ratio of fundraising to total expenses. Total expense of non-profit organizations is equal to the summation of administration expense, fundraising expense and program service expense. The above literature uses ratio of program service expense to total expanse to measure donation price. Past literature indicates that donation price is negatively related to total donation earnings (Wiesbrod and Dominquez, 1986; Posnett and Sandler, 1989; Callen, 1994; Trussel and Parsons, 2008), but no consistent conclusions have been reached in the studies of medical care industry. For example, Jacobs and Marudas (2009) and Okten and Weisbrod (2000) found that donation price is negatively related to donation revenue, but Marudas and Jacobs (2004) and Khanna et al. (1995) suggested that there is no significant relation between them. According to past studies, this paper uses the ratio of program service
expense to total expense to measure donation price, and predicts that donation price is not negatively or insignificantly related to donation revenue.
(2). Fixed cost ratio (OVERHEAD):
Fixed cost ratio is used to measure total expense of non-profit organizations spent in
administration and fundraising activities. The higher the fixed cost ratio, the lower the efficiency of non-profit organizations, this may reduce donated sum. Past literature divides fixed cost ratio into fundraising expense ratio (ratio of fundraising to total expense) and administration ratio (ratio of administration cost to total expense), and discusses impacts of two ratios on donation revenue. Research results indicate a negative relation between administration ratio and fundraising expense ratio (Greenlee and Brown, 1999; Tinkelman and Mankaney, 2007; Parsons and Trussel, 2009; Jacobs and Marudas, 2009). Since Taiwan's nonprofit hospitals have not separately listed
administration expense and fundraising expense, this study employs ratio of fixed cost (fundraising expense and administration expense) to total expense to measure inefficiency of non-profit hospitals' resources allocated to administration and fundraising activities. This is predicted that the higher the fixed expense ratio, the lower the efficiency of nonprofit organizations; donors will reduce donation. Accordingly, fixed expense ratio is negatively related to donation revenue.
(3). Program revenue (PREV):
Program service is products and services of nonprofit organizations, for non-profit hospitals, is the income of medial care activities of nonprofit hospitals. Purpose revenues can be used to measure fundraising capacity of and reputation of nonprofit organizations (Parson, 2003 ). In this paper, annual revenues of medical care activities of samples hospitals are observed for variable definition.
13
Past empirical studies have no consistent conclusions on the impact of program service revenues on donation revenue.
(4). Funding year (AGE):
Since donors are not necessarily the direct beneficiaries of the services provided by nonprofit organizations, donors often assess the quality of its products and services, by the nonprofit
organization’s reputation as reference information for donation. Relevant studies often employ the age or the years since the obtaining of the tax-exempt status of the nonprofit organization to measure the reputation. Previous empirical studies have found that the two are positively correlated (Weisbrod and Dominguze, 1986; Khanna, Posnett and Sandler, 1995), negatively correlated (Tinkleman, 1998; Marudas and Jacobs, 2006), or have no connection at all (Callen, 1994; Okten and Weisbrod, 2000), indicating that there is no consistent relationship between age of hospital and donation revenues. Taiwan’s nonprofit hospitals are tax-exempt at establishment; thus, this paper uses the age of hospital as a measurement indicator.
This paper expects that age of hospital and donation revenues are positively correlated. (5). Annual available wealth(WEALTH):
The US watchdog agency, AIP (American Institute of Philanthropy) argues that, when the nonprofit organizations have more wealth, their dependence on additional donations will be lower, thus, the donation revenues will be fewer accordingly (Marudas, 2004). However, Fisman and Hubbard (2003) found that annual available wealth and revenue volatility are positively correlated. They argued that annual available wealth has the function of stable income. Previous studies on nonprofit organizations’ annual available wealth and donation revenues have not reached consistent conclusions. According to the definition of Marudas(2004), the nonprofit hospitals’ wealth is the division of its net assets by total expenses, in other words, it is the percentage of the ownership of self-owned assets by each NTD.
(6). Total asset (TOTASS):
Organizational size is an important variable to measure organizational characteristics and is correlated to operation or performance. The larger the of non-profit organization, the higher the political cost, and the lower the competitive cost, thus resulting in economies of scale in production. Based on research of Tinkleman (1998: 377-394), this paper uses total assets as substitute variable of nonprofit organizational size, and predicts positive relation exists between size and donation revenue. (7). Debt ratio (DEBT):
High debt ratio suggests that the manager has stronger motivation to carry out investment plans by debt financing. High debt ratio has two implications: one is that the hospital productivity to provide community services is relatively high, which can be regarded as a commitment to provide more community services in the future. Hence, the donors are more willing to donate (Kuo, Ho, and Lo, forthcoming); another implication is that long term debt means the liability of regular repayment of principal and interest by the hospital in the future. A higher debt ratio means higher risk of default. To reduce default risk, the manager tends to reduce social community services, making the donor
14
less willing to donate (Magnus, Smith and Wheeler, 2003; Yetman, 2007). The impact of liabilities on donation can be regarded as the outcome of the above two forces. This paper uses the long term debt against total assets to measure the debt ratio.
6. Data Sources and Descriptive statistics
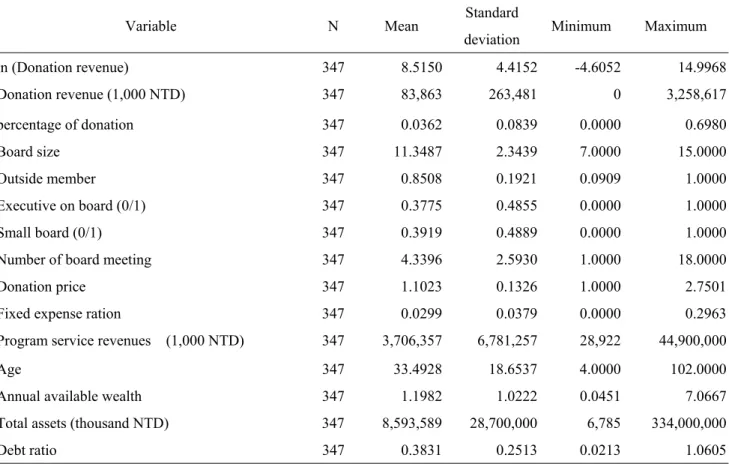
This paper uses the unbalanced data of 39 nonprofit hospitals in the period of 2000-2010. Descriptive statistics of donation revenues, board structure and composition and control variables is as shown in Table 1. Regarding donation revenues, the average value is NTD 83,863,000, the minimum value is 0, the maximum value is NTD 3,258,617,000, and the standard deviation is NTD 263,481,000, which are far greater than the average value. This suggests that the deviation in
donation revenues among hospitals is significant. In terms of board structure and composition, board size is in the range of 7-15, on average, 11 directors. The percentage of outside directors is on
average 85%, on average, 85% directors have no posts in the nonprofit hospitals in the range of 9%-100%. However, the standard deviation is 19.21%, suggesting that most of the observations are concentrated although the differences are extreme. The average percentage of hospital president serving as a board director is 0.38 and smaller than the standard deviation (0.49). The percentage of boards with fewer than 9 directors is about 0.39 and is smaller than the standard deviation (0.49), indicating that a high percentage of nonprofit hospitals meets the legitimate threshold of board size. In terms of hospital characteristics, the average value of donation price is 1.1023, suggesting that on average, a cost of NTD 1.1023 can provide NTD 1 for purpose of business activities. The standard deviation (0.1326) above the average value suggests that the donation prices vary between nonprofit hospitals; the average value of overhead cost is 0.0299, suggesting that on average, 0.0299 NTD of a cost of 1 NTD is used for administrative activities having no direct relations with purpose of business. For the purpose of business revenue, the average value is NTD 3,706,357,000, and the standard deviation is far greater than the average value, suggesting that the revenues between nonprofit hospitals vary significantly. The average age of hospital is 33.49 years, the average percentage of the annual available wealth is 1.1982, indicating that the expenditure of each NTD 1 has the support of NTD 1.1982 in net assets. The average total asset is NTD 8,593,589,000, the minimum value is NTD 6,785,000 the maximum value is 334,000 million. Finally, the average proportion of total liabilities against total assets is 0.3831, suggesting that 38.31% of the total assets of nonprofit hospitals in Taiwan come from liabilities on average. Table 2 illustrates the Pearson correlation coefficients between independent variables. Correlation coefficients of the variable of board structure and composition and all independent variables are below 0.4139, indicating that the co-linearity level between key variables and other independent variables is not high. Regarding the control variables, correlation coefficient between total assets and purpose business (0.91), and the correlation
coefficient between debt ratio and annual available wealth (0.7994) are relatively high, which may affect the regression coefficient testing efficiency. The correlation coefficients between other variables are all lower than 0.37, indicating that the co-linearity situation is not serious.
15
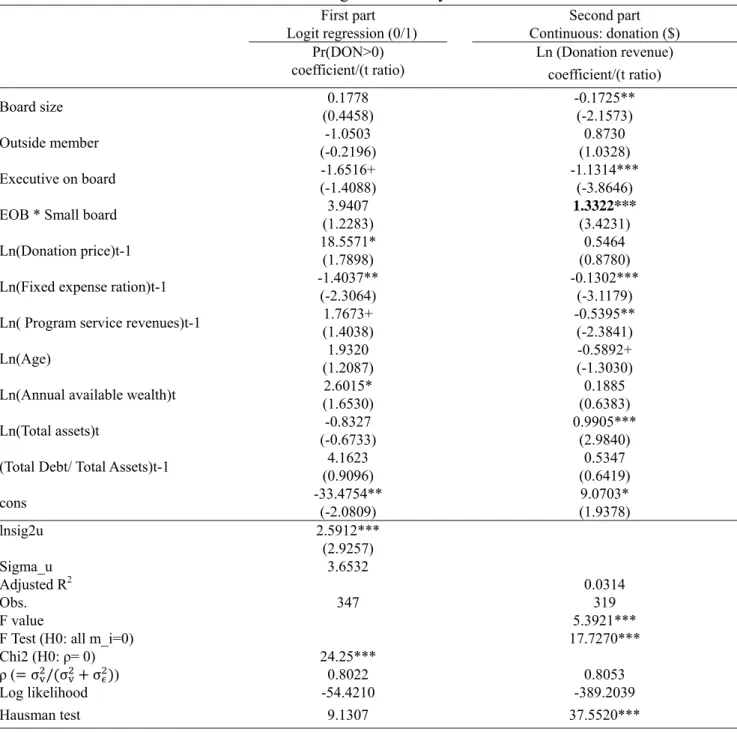
7. Empirical Results
This paper uses the unbalanced panel data of 39 nonprofit hospitals in the period of 2000-2010 for analysis. By employing two models, this paper discusses the correlation between board structure and composition, and donation revenues. The regression analysis results are as shown in Table 3. First, regarding the use of panel data model or comprehensive data model, in the first stage Logit regression, the likelihood ratio test rejects the null hypothesis that the hospital level variation is zero, indicating that it is more suitable to use the panel data model. However, in the linear regression model at the second stage, F test rejects the null hypothesis that the special effects of the hospital are zero, suggesting that it is more suitable to use the panel data model. (The appropriateness of a panel data method is ascertained for the first part of the model with a likelihood ratio test that rejected a null hypothesis of panel-level variance equaling zero. For the second part of the model, an F-test rejects a null hypothesis of all individual-specific effects equal to zero.
Second, this paper evaluates whether the panel data model should adopt the fixed effect or the random effect. In the random effect model, the model assumes unobservable hospital-specific effects as exogenous; however, for the fixed effect model, it assumes that the unobservable hospital-specific effects and explanatory variables are correlated. In the Logit regression at the first stage, the
Hausman testing statistics is 9.1307 (p value = 0.5197), suggesting that random effect model is better than fixed effect model. In the linear regression model of the second stage, the statistics of the
Hausman test is 37.5520 (p value = 0.0001), suggesting that the fixed effect model is better than the random effect model. Regression analysis results are as shown in Table 3. Regarding the Logit model of the probability of nonprofit hospitals receiving donations, for board structure and composition variables, the regression coefficients of variables including board size, hospital president serving as a director, and hospital president serving as a director on a small board are as expected. However, the regression coefficient of the percentage of outside directors is opposite to the expectations. Nevertheless, the regression coefficients of the four variables have not reached the 10% significance level, thus it is unable to verify the Hypothesis. Second, donation price regression coefficient is significantly positive in opposition to the expectation. Third, overhead cost ratio’ regression coefficient is significantly negative, suggesting that higher overhead cost ratio of nonprofit hospitals results in lower probability of receiving donations as expected. Fourth, the regression coefficient of the annual available wealth is significantly positive, indicating that a higher level of financial stability of nonprofit hospitals lead to higher probability of receiving donations; finally, the regression coefficients of the remaining control variables have not reached the 10% significance level.
Regarding the linear regression model of nonprofit hospitals’ donation revenues, the findings are as follows:
(1) The regression coefficient of board size is significantly negative, indicating that greater nonprofit hospital’s board size results in fewer donation revenues, being opposite to the expectations of this study. However, this is consistent with the situation of the profit
16
organizations. When the board size is larger, the incentives to supervision will be lower to reduce the performance. In addition, highly commercial nonprofit hospitals can receive financial resources via medical activities. Article 43 of the Medical Care Act provides that at least one third of all the board members of the nonprofit hospitals should be of medical
background. Therefore, the medical background rather than the fund raising capabilities should be the top condition in the selection of board members. In addition, the subjects of this study are not the college and university as in previous studies (Olson, 2000; O'Regan and Oster, 2005; Callen, Klein, and Tinkleman, 2010) that cover all profit-making industries. Therefore, the impact of board size on donation revenues may be different from the previous articles. (2) The regression coefficient of the percentage of outside directors is positive as expected. However, it has not reached the 10% significance level, and thus it is unable to verify the hypothesis.
(3) Third, the regression coefficient of the hospital president serving as a director is negative as expected. This suggests that, when the hospital president serving as a director, board
independence will decrease to affect the confidence of donors in the nonprofit hospitals, and they will reduce donations.
(4) The regression coefficient of the variable of hospital president serving as a director on a small board is significantly positive as expected. The regression results suggest that, when the
president of a nonprofit hospital serves as a director in a small board, the increase in the level of independence by the small board can offset the impact of hospital president serving as a board director, contributing to the increase of donor confidence in nonprofit hospitals to increase donations accordingly.
(5) The regression coefficient of the variable of donation price is positive but has not reached the significance level. 3
(6) The regression coefficient of the variable of fixed cost ratio is significantly negative as expected. This suggests that, when the fixed cost ratio of the nonprofit hospitals’ is higher, the hospital efficiency is lower, and thus the hospital donation revenues will decrease.
(7) The regression coefficient of the variable of age of hospital is negative, and has not reached the 10% significance level.
(8) The regression coefficient of the annual available wealth is positive and has not reached the 10% significance level.
(9) The regression coefficient of the variable of total assets is significantly positive as expected. This suggests that the larger nonprofit hospitals have more donation revenues.
(10) The regression coefficient of the variable of debt ratio is positive but has not reached the significance level.
The regression analysis results of the Logit regression at the first stage and the linear regression model at the second stage are as shown in Table 3. As seen, for the two models of the probability of nonprofit organizations receiving donations and the nonprofit hospitals’ donation revenues, only the
17
regression coefficient of the variable of overhead cost ratio is significantly negative. The remaining significant regression coefficients are different in case of the two models. It can be inferred that the determining factors of the model at the first stage and the second stage model are different. Therefore, it is necessary to analyze the probability of receiving donations and donation revenues by two
models.
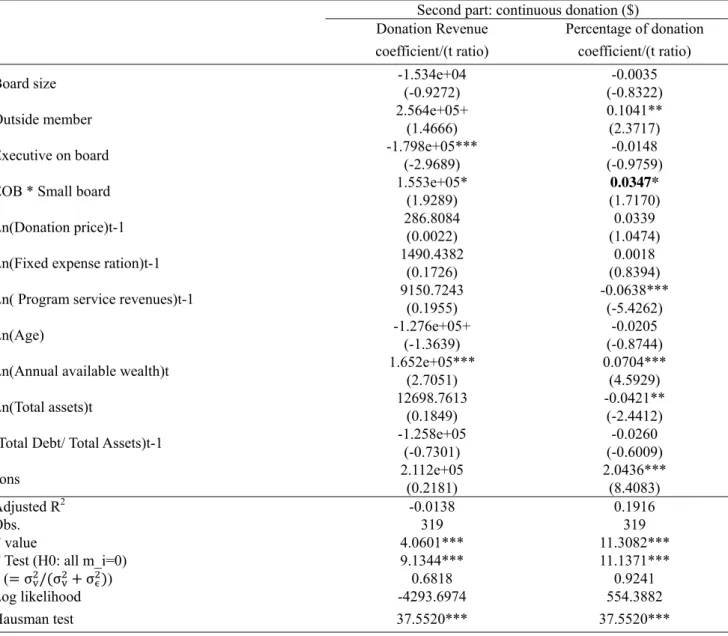
To test the robustness of research findings, the second stage linear regression model uses the proportion of the donation revenues against total revenue and the sum of donation revenues as the proxy variables of the donation revenues for sensitivity analysis. The regression results are as shown in Table 4. Except for the variable of total assets, the regression coefficients positivity or negativity is the same with the results of Table 3.
Regarding some variables of significant level differences in regression coefficients, the findings are as follows:
(1) The regression coefficient of the variable of the percentage of the outside directors in the second column of Tables 3 and 4 is positive, and has not reached the 10% significance level in both cases. However, the regression coefficient of the variable of the percentage of the outside directors in the second column of Table 4 has reached the 5% significance level.
(2) The regression coefficient of the variable of the annual available wealth in the first column and the second column of Tables 3 and 4 is positive. However, it has reached the 1% significance level only in Table 4.
(3) The regression coefficient of the variable of total assets in the second column of Table 4 is significantly negative. However, the regression coefficient of the variable of Table 3 is
significantly positive. This may be because the donations listed in the second column of Table 4 are the deduction by the total revenues. However, the donation revenues are the revenues without adjusting the impact of size. As a result, the regression coefficients of the two are different in terms of the total assets representing size.
8. Conclusions
This paper discusses the correlation between nonprofit hospitals’ board structure and composition and donation. The board of the nonprofit organization needs to help fund-raising, financial management, participation in activities or even direct participation in business and administrative work in addition to the supervisory functions (O'Regan and Oster 2005). Compared with other nonprofit organizations, nonprofit hospitals are of higher commerciality and the board of directors can control the hospital operations (Hansmann 1980). Nonprofit organizations are
organization of high self-discipline. The government allows the nonprofit hospitals to enjoy high level of self-government. Therefore, as the major internal governance mechanism, the board of directors is relatively important. Based on the respect for its autonomy, the government only limits the board composition and structure by medical regulations and law, expecting to effectively monitor the hospitals by internal governance mechanism. Hence, the functions of the board of directors have
18
a key impact on the business performance of nonprofit hospitals. Although nonprofit hospitals can receive financial resources from medical activities, donation revenues are necessary for nonprofit hospitals engaging in social community services or improvement of medical quality in the face of increasing medical competition. This paper uses the two-stage approach to analyze the correlation between donation revenues and board size, percentage of the outside directors, hospital president serving as a director and hospital president serving as a director on a small board, the probability of nonprofit hospitals receiving donations.
This paper uses the unbalanced data of 39 nonprofit hospitals in the period of 2000-2010 for analysis. The two models are employed to discuss the correlation between board structure and composition, and donation revenues. First, in the probability of nonprofit hospitals receiving donations, board structure and composition are not significantly correlated to the probability of receiving donations. Donation price and annual available wealth are positively correlated to the probability of receiving donations. Overhead cost ratio and the willingness to receive donations of the nonprofit hospitals are negatively correlated; Second, in the nonprofit hospitals receiving donations, when nonprofit hospitals have received donations, the board size and donations are negatively correlated, suggesting that expanding board size can reduce the effective communications between directors, leading to the decrease of fund-raising performance. Hospital president serving as a director is negatively correlated to donations, suggesting that the donors will be concerned about board independence to decrease donations as the president plays the dual role of the manager and board director. Hospital president serving as a director on a small board are positively correlated to donation revenues, suggesting that smaller board size can help improve board independence and increase donation revenues as board of directors requires no intermediation of the hospital president. In addition, overhead cost ratio and purpose business revenue are negatively correlated to donation revenues, while total assets and donation revenues are positively correlated. According to the empirical results of the two models, board structure and composition are correlated to donation revenues. However, the probability of nonprofit hospitals receiving donations is not correlated. Hence, the two models have different key factors, and it is necessary to estimate separately.
Finally, based on the data structure and variable definition, this study has the following limitations. First, it uses the nonprofit hospitals as the research subject. However, since nonprofit hospitals are highly commercial, donors are often affected in the evaluation of the necessity of donations. Secondly, Taiwan has implemented the system of general health care system which can help people short of medical care and the remote areas’ medical needs to substantially reduce the responsibilities of nonprofit hospitals to provide free medical services. Third, the nonprofit hospital’s board is reelected every 3-4 years, and the reappointment of directors is very common. As a result, the yearly variation of board structure and composition is too small to likely affect the estimation effect of using the panel data.
19
Reference
Andreoni, James (1993), An experimental test of the public goods crowding out hypothesis,”
American Economic Review, 83 (5), 1317-1327.
Andrés-Alonso,Pablo de, Natalia Martín Cruz, and M. Elena Romero-Merino (2006). The
governance of nonprofit organizations: empirical evidence from nongovernmental development organizations in Spain. Nonprofit and Voluntary Sector Quarterly, 35(4): 588-604.
Baker M, Gompers P. 2000. The determinants of Board Structure and Function in Entrepreneurial Firms. Working Paper. Harvard Business School.
Bantel, K., & Jackson, S. (1989). Top management and innovations in banking: Does the
composition of the top team make a difference? Strategic Management Journal, 10, 107-124. Baysinger, R. D., & Hoskisson, R. E. 1990. The composition of boards of directors and strategic
control. Academy of Management Review, 15: 72-87.
Bradshaw, P., V. Murray, and J. Wolpin (1992). “Do nonprofit boards make a difference? An
exploration of the relationship among board structure, process, and effectiveness.” Nonprofit and
Voluntary Sector Quarterly, 21, 227-249.
Brickly, J. and C. James (1987). “The takeover market, corporate board composition, and ownership structure: the case of banking.” The Journal of Law and Economics, 30, 161-180.
Brickley, J. A., J. L. Coles, and R.L. Terry, 1994, Outside directors and the adoption of poison pills,
Journal of Financial Economics, 35, 371-390.
Brickley, J. A., R. L. Van Hornb, and G. J. Wedig (2010). Board composition and nonprofit conduct: Evidence from hospitals. Journal of Economic Behavior & Organization 76 (2010) 196–208. Byrd, J. W., and K. A. Hickman, 1992, Do outside directors monitor managers? Evidence from
tender offer bids, Journal of Financial Economics, 32, 195-222.
Callen, J., & H. Falk. 1993. Agency and efficiency in nonprofit organizations: the cases of “specific health focus” charities. The Accounting Review, 66(1), 48-65.
Callen, J, A. Klein, and D. Tinkelman (2003). Board composition, committees, and organization efficiency: the case of nonprofit. Nonprofit and Voluntary Sector Quarterly, 32(4), 493-520. Callen, J, A. Klein, and D. Tinkelman (2010). The contextual impact of nonprofit board composition
and structure on organizational performance: agency and resources dependence. Voluntas, 21, 101-125.
Callen, J. L. (1994). Money donations, volunteering and organizational efficiency. The Journal of
Productivity Analysis, 5, 215–28.
Caves, D., Christensen, L., & Tretheway, M. (1980). Flexible cost functions for multiproduct firms.
Review of Economics and Statistics, 62(3), 477–481.
Cherny, J., A. R. Gordon and R. J. L. Herson (1992). Accounting – A social institution: A unified
theory for the measurement of the profit and nonprofit sectors. New York, NY: Quorum Books.
Coles, Jeffrey L., Naveen D. Daniel, Lalitha Naveen (2008). Boards: does one size fit all, Journal of
20
Demsetz, H., and K. Lehn (1985). The structure of corporate ownership: causes and consequences.
Journal of Political Economy, 93: 1155-1177.
Drtina, R. E. (1984). Measurement preconditions for assessing nonprofit performance: An exploratory study. The Government Accountants Journal 33 (2) (Summer), 13-19.
Dyl, E. A., H. L. Frant, and C. A. Stephenson (2000). Governance and funds allocation in United States medical research charities. Financial Accountability and Management, 16(4), Nov., 335-352.
Eisemberg, T., Sundgren, S., & Wells, M. T. (1998). Larger board size and decreasing firm value in small firms. Journal of Financial Economics, 48, 35-54.
Fama, E. F. and M. C. Jenson, M. C. (1983). Agency problems and residual clams. Journal of Law
and Economics, 26, 327-349.
Fisman, R., and G. Hubbard (2003). Endowments, governance, and the nonprofit form. The
governance of not-for-profit organizations. Chicago: University of Chicago Press.
Gillingan, T., & Smirlock, M. (1984). An empirical study of joint production and scale economies in commercial banking. Journal of Banking and Finance, 8(1), 67–76.
Glaeser, E. L. (2003). Introduction. In E. Glaeser (Ed.), The governance of not-for-profit
organizations (1-44). Chicago: University of Chicago Press.
Gordon, T. P., C. L. Knock, and D. G. Neely (2009). The role of rating agencies in the market for charitable contributions: An empirical test. Journal of Accounting and Public Policy, 28 (6), 469-484
Greenlee, J. S., and Brown, K. L. (1999). The impact of accounting information on contributions to charitable organizations. Research in Accounting Regulation. 13:111-125.
Hambrick, D. C., and D’Aveni, R. A. (1992). Top team deterioration as part of the downward spiral of large corporate bankruptcies. Management Science, 38, 1445-1466.
Hambrick, D. C., & Mason, P. (1984). Upper echelons: The organization as a reflection of its top managers. Academy of Management Review, 9, 193-206.
Hasmann, H. (1980). The role of nonprofit enterprise. Yale Law Journal, 89, 835-901.
Hansmann, H. (1987). Economic theories of nonprofit organization. In The Nonprofit Sector: A
Research Handbook, edited by W. Powell, 27-42. New Haven: Yale University Press.
Hausman, J. A. (1978). Specification tests in econometrics. Econometrica 46, 1251-1271. Hermalin, B. and M. Weisbach (1988). Endogenously chosen boards of directors and their
monitoring of the CEO. American Economic Review, 88, 96-118.
Hermalin, B. and M. Weisbach (1991). The effects of board composition and direct incentives on firm performance. Financial Management, 20, 101-112.
Jacobs, F. A. and N. P. Marudas (2009). The combined effect of donation price and administrative inefficiency on donations to US nonprofit organizations. Financial Accountability and
Management 25(1), 33-53.
21
systems, The Journal of Finance, 48 (3) (July, 1993), 831-880.
Kim, H. Y. (1987). Economies of scale in multi-product firms: An empirical analysis. Economica, 54(214), 185–206.
Khana, J. and J. Posnett and T. Sandler (1995). Charity donations in the UK: new evidence based on panel data. Journal of Public Economics, Vol. 56, pp. 257–72.
Kuo, J. S., Y. C. Ho, and D. C. Lo (2006). " The Association of Debt Financing with Community Benefit Services Provided by Private, not-for-profit Hospitals in Taiwan," Taiwan Journal of
Public Health, 26(6), 440-448. [in Chinese]
Kuo, J. S., Y. H. Ho, and K. T. Lo (forthcoming). "The Relation between Debt Financing and Not-For-Profit Hospitals’ Donations," NTU Management Review, accepted at May 21, 2012. [in Chinese]
Marudas, Nicholas P. and Fred A. Jacobs (2004). Determinants of charitable donations to large U.S. higher Education, hospital, and scientific research MPOs: new evidence from panel data.
Voluntas: International Journal of Voluntary and Nonprofit Organizations, 15 (2), 157-179.
Marudas, Nicholas P. and Fred A. Jacobs (2006). Effects of nonprofit organizational wealth on donations: Evidence from recent data on the nonprofit Times 100, Zeitschrift fur Offentliche and
Gemeinwirtschaftliche Unternehmen, 34, 74-88.
Marudas, N. P. (2004). Effects of nonprofit organization wealth and efficiency on private donations to large nonprofit organizations. Research in Governmental and Nonprofit Accounting, 11, 71– 91.
Magnus, S., D. Smith, J. R. Wheeler (2003). Agency implications of debt in not-for-profit hospitals: a conceptual framework and overview, Research in Healthcare Financing Management, 8 (1), 7-17.
Miller,L. E., R. M.Weiss, and B. V. MacLeod (1988). Boards of directors in nonprofit organizations: composition, activities, and organizational outcomes. Journal of Voluntary Action Research, 17, 81-89.
Mock,R. A. Shiefer, and R.Vishny (1988). Management ownership and market valuation. Journal of
Financial Economics, 20, 293-315.
Moyers, R. and K. Enright (1997). Snapshot of America's Nonprofit Boards: Results Of The Ncnb
Nonprofit Governance Survey. Washington, DC: National Center for Nonprofit.
Okten, C. and B.A. Weisbrod (2000). Determinants of donations in private nonprofit markets.
Journal of Public Economics, 75, 255–72.
Olson, David E. (2000). Agency Theory in the not-for-profit sector: Its role at independent colleges.
Nonprofit and Voluntary Sector Quarterly, 29, 280-296.
Olson, E. (2000). Agency theory in the not-for-profit sector: Its role at independent colleges.
Nonprofit and Voluntary Sector Quarterly, 29(2), 280-296.
O'Regan, K. and S. M. Oster (2005). Does the structure and composition of the board matter? The case of nonprofit organizations. Journal of Law, Economics, and Organization, 21 (1), April,
22
205-227 (23)
Oster, S. (1995). Strategic management for nonprofit organizations: theory and cases. New York: Oxford Press.
Parsons, L. M. (2003). Is accounting information from nonprofit organizations useful to donors? A review of charitable giving and value-relevance. Journal of Accounting Literature, 22, 104–129. Parsons, L. M., & Trussel, J. M. (2009). Fundamental analysis of not-for-profit financial statements:
An examination of financial vulnerability measures. Research in Governmental and Nonprofit
Accounting, 12, 35-56.
Posnett, J. and T. Sandler (1989). Demand for charity donations in private non-profit markets.
Journal of Public Economics, 40, 187–200.
Rosenstein, Stuart, and Jeffrey G. Wyatt (1990). Outside directors, board independence, and shareholder wealth. Journal of Financial Economics 26, 175-191.
Saxton, Gregory D., Daniel G. Neely, and Chao Guo (2009). Web disclosure and the market for charitable contributions. Presented at the 2009 Annual meeting of the Association for Research on
Nonprofit Organizations and Voluntary Action, November 19-21, Cleveland, OH.
Shivdasani, A. and D. Yermack (1999). CEO involvement in the selection of new board members.
Journal of Finance, 54, 1829-1854.
Shleifer, Andrei and Robert W. Vishny (1986). Large shareholders and corporate control. The Journal
of Political Economy, 94 (3-1), Jun., 461-488.
Tinkelman, Dan (1998). Differences in sensitivity of financial statement users to joint cost
allocations: The case of nonprofit organizations. Journal of Accounting, Auditing, and Finance, 13 (4), 377-393.
Tinkelman, D. (1999), Factors affecting the relation between donations to not-for-profit
organizations and an efficiency ratio. Research in Governmental and Nonprofit Accounting, 10, 135–61.
Tinkelman, D.and K. Mankaney (2007). When is administrative efficiency associated with charitable Donations? Nonprofit and Voluntary Sector Quarterly, 36 (1), 41–64.
Trussel, John M. and Linda M. Parsons (2008). Financial reporting factors affecting donations to charitable not-for-profit organizations. Advances in Accounting, 23, 263–285.
Weisbach, M. (1988). Outside directors and CEO turnover. Journal of Financial Economics, 20, 431-460.
Weisbrod, B.A., and N. D. Dominguez (1986). Demand for collective goods in private nonprofit markets: can fundraising expenditures help overcome free-rider behavior? Journal of Public
Economics, 30 (1), 83–95.
Weninger, Q. (2003). Estimating multiproduct costs when some outputs are not produced. Empirical
Economics, 28(4), 753–765.
Yermack, David, (1996). Higher market valuation of companies with a small board of directors.
23
Yermack, D. 1997. Good timing: CEO stock option awards and company news announcements.
Journal of Finance, 52, 449-476.
Yetman, R. (2007). Borrowing and Debt. in Financing Nonprofits: Putting Theory Into Practice. Edited by Dennis Young. Lanham, Md.: AltaMira Press, 243-268.
Young, G.. R. I. Beekun, and G. O. Ginn (1992). Governing board structure, business strategy, and performance of acute care hospitals: a contingency perspective. Nonprofit and Voluntary Sector
24
Table 1: Statistics Description
Variable N Mean Standard
deviation Minimum Maximum
ln (Donation revenue) 347 8.5150 4.4152 -4.6052 14.9968 Donation revenue (1,000 NTD) 347 83,863 263,481 0 3,258,617 percentage of donation 347 0.0362 0.0839 0.0000 0.6980 Board size 347 11.3487 2.3439 7.0000 15.0000 Outside member 347 0.8508 0.1921 0.0909 1.0000 Executive on board (0/1) 347 0.3775 0.4855 0.0000 1.0000 Small board (0/1) 347 0.3919 0.4889 0.0000 1.0000
Number of board meeting 347 4.3396 2.5930 1.0000 18.0000
Donation price 347 1.1023 0.1326 1.0000 2.7501
Fixed expense ration 347 0.0299 0.0379 0.0000 0.2963
Program service revenues (1,000 NTD) 347 3,706,357 6,781,257 28,922 44,900,000
Age 347 33.4928 18.6537 4.0000 102.0000
Annual available wealth 347 1.1982 1.0222 0.0451 7.0667
Total assets (thousand NTD) 347 8,593,589 28,700,000 6,785 334,000,000
Debt ratio 347 0.3831 0.2513 0.0213 1.0605
Note:
Donation revenue: donation revenue in 1,000 NTD; ln(donation) = ln(donation revenue);
Percentage of donation = donation revenue/ total revenue; Board size: number of members.
Outsider member = number of outside members/ board size.
Executive on board = 1 if executive also board member; 0 otherwise. Small board: number of member less than 9.
Donation price = Total expense /Program service expense; Fixed expense ratio = Fixed cost/Total expense;
Program service revenues = Revenues of medial care service (thousand NTD); Age= Data year –funding year;
Annual available wealth = Net asset/ Total expense;
Total assets = Sum of total assets at the end of the year ((thousand NTD); Debt Ratio = Total Debt /Total Assets