Electrothermo-optical effect in liquid crystals and its applications
Yu-Cheng Hsiao and Wei Lee*
Institute of Imaging and Biomedical Photonics, College of Photonics, National Chiao Tung
University, Guiren Dist., Tainan 71150, Taiwan
ABSTRACT
Electro-optical effects in liquid crystals (LCs) have been widely utilized in many optical components and photonic devices, thanks to the anisotropic media that can be easily manipulated by an electric field to modulate the light. In general, dielectric heating in LC applications is negligible because their orientational dielectric relaxations occur at high frequencies. Here we focus on a dual-frequency LC characterized by its much lower relaxation frequency. The field-induced heat strongly affects the LC ordering and optical properties. The electrothermo-optical effect reveals an unusual behavior compared with the well-known electro-optical effect in regular LCs. Based on the electrothermo-optical effect, some applications such as optical modulators or tunable optical shutters are demonstrated.
Keywords: cholesteric liquid crystals, dielectric heating effect, photonic devices 1. INTRODUCTION
In recent decades, technological revolutions have changed our society and transformed daily life. Some remarkable innovations have been carried out on the basis of the improved ability of manipulating light. In particular, the intensity of light through a liquid crystal (LC) can be managed by an electric field in different LC modes. Such a change in the optical properties in response to the field is known as the electro-optical (EO) effect. Accordingly, a wide variety of commercial LC displays have been developed. Although the utilization of LCs in displays or other devices began in the 1960s, the effects of magnetic and electric fields on the birefringence of nematic LCs have been investigated for a whole century. The first practical flat-panel LC display as a switchable light-valve device was reported by Heilmeier et al.1,2
However, comparing with EO effect, the electric field also can induce heat and affects the arrangement of LC molecule. The electromagnetic field induced heat can be classified as dielectric and Ohmic heating. The most important is that dielectric heating is more obviously than Ohmic heating in LCs. The dielectric heating is related with dielectric relaxation of LC materials. In general, the dielectric relaxation frequency of LC is located in the high frequency range about 10 ns in both long and short axis of LCs. The dielectric heating isn’t obvious. However, heat can be easily generated in a type of special anisotropic materials, known as dual-frequency (DF) LCs, under operation. In a typical DF nematic LC (DFNLC), the orientational relaxation of the dielectric component parallel to the molecular axis, ε||, occurs in the frequency range between 10 and 100 kHz. Consequently, the dielectric anisotropy Δε reverses its sign from positive to negative at a certain frequency called the crossover frequency fc.3–5 Furthermore, DF cholesteric LCs (DFCLCs) formed by mixing DFNLCs and chiral dopants have also been studied.6–10 No matter DFNLCs or DFCLCs, the dielectric
heating effect may become significant in operation because of their relatively low frequency of the orientational dielectric relaxation along the molecular axis. The thermodielectric behaviors in DFNLCs and DFCLCs have been documented in the literature.11–14 Based on the DF mesophase, here we explore the joint thermodielectric and EO effects
as a unique electrothermo-optical (ETO) effect, which, to our best knowledge, has never been demonstrated in the LC research area. In comparison with the well-known EO characteristics of LCs, The ETO effect results in distinctive optical features, making them attractive for photonic applications such as in light modulators, notch filters and many other optical elements.
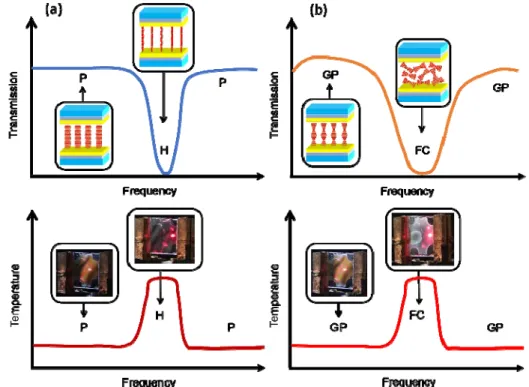
Figure 1 schematically shows the ETO behavior and the corresponding temperature variation as a function of the applied frequency in DFLC cells. Although the planar (P) and hoemotropic (H) structures in the ETO-DFNLC cell are both transparent and hardly distinguished, they can be identified through crossed polarizers, revealing the bright P and dark H states. On the other hand, the optical states of interest in the ETO-DFCLC system are the Grandjean planar (GP) and focal conic (FC) states, which can be easily differentiated in that the former is transparent and the latter appears
Emerging Liquid Crystal Technologies XII, edited by Liang-Chy Chien, Proc. of SPIE Vol. 10125, 1012516 · © 2017 SPIE · CCC code: 0277-786X/17/$18 · doi: 10.1117/12.2251440
Proc. of SPIE Vol. 10125 1012516-1
a. 4-0
..w
W!iftflUWl 1
laRilae441l
M4GKrokiel
opaque caused by light scattering. Note that the ETO effect becomes pronounced only in a certain frequency range, generating a sharp notch in the transmission spectrum.
2. EXPERIMENTAL
The DFNLC host material used is HEF951800-100 (HCCH) with fc = 14 kHz at 25°C. For comparison, the typical nematic host E7 (Merck) was also employed for making regular CLCs. To prepare CLCs, the chiral dopant S811 (DIC) was chosen at the concentrations c of 19.0, 21.6, and 25.6 wt%. The helical twisting power (HTP) of S811 is ca. −14 μm−1 and it varies slightly in different hosts. The resulting (DF)CLC materials with various helical pitches of ~(HTP⋅c)−1 were injected into 5.1-μm-thick planar-alignment cells by capillary action in isotropic phase. The planar alignment layer was exhibited in the uniformity P or GP states initially. In order to examine the frequency-dependent transmission property, a probe beam derived from a He–Ne laser source operating at the wavelength of 632.8 nm was exploited. Both the crossed-polarizer and no-polarizer schemes were adopted in the electro-optical measurement for NLCs and CLCs, respectively. An arbitrary function generator (Tektronix AFG-3022B) was used to supply various frequency-modulated square-wave voltages.
Figure 1. Schematics of the ETO behavior and the induced temperature varying with the frequency of an AC voltage applied across (a) a DFNLC cell between crossed polarizers and (b) a polarizer-free DFCLC cell.
3. RESULTS AND DISCUSSION
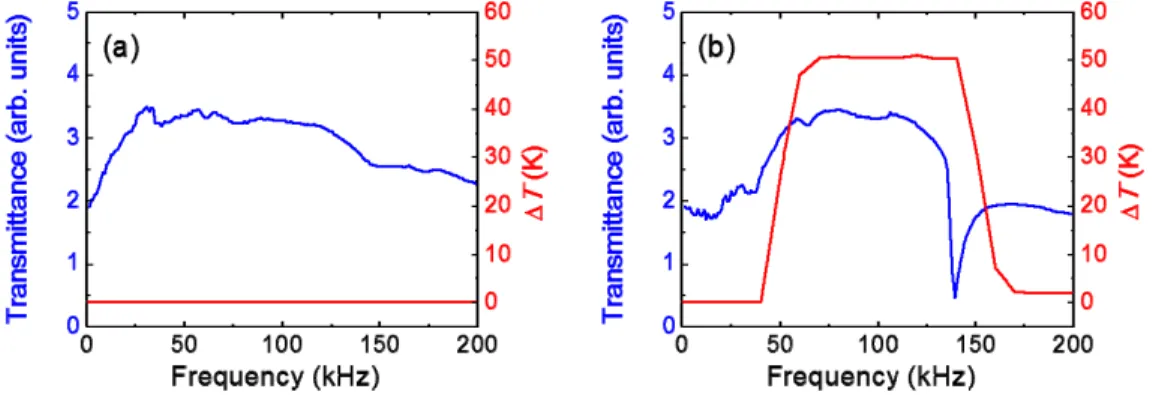
Figures 2(a) and (b) demonstrate the typical EO effect and the ETO effect in CLC cells with the chiral-dopant concentration of 21.6 wt%, respectively. Figure 2(a) shows that the transparency of typical CLCs are less frequency-sensitive. However, the dominant ETO effect in DFCLCs dramatically lowers the optical transmission within a narrow bandwidth (Fig. 2(b)). The dielectric dispersion in DFLCs, including DFNLCs and DFCLCs, can cause a remarkable increase in temperature because of the dielectric loss in association with the long axis. The applied frequency-dependent increasing temperature is the step-liked behavior. The electrohydrodynamic (EHD) is shown when we operated the low electrical frequency. AC-driven EHD convection instability that occurs in LCs has been studied.15,16 This instability
gives rise to a rich variety of EHD patterns, causing the transmittance to drop a little based on our previous research.17
From Figs. 2(a) and (b), one can see that, in the initial low-frequency range, the transmission is lower because of EHD scattering.
Proc. of SPIE Vol. 10125 1012516-2
5 4
£
ta..
3 2 1 E (a) 60 50 40 30-2-V
20 t
10 E b 40 302
V
20 t
10 50 100 150 Frequency(kHz) 200 50 100 150 200 Frequency(kHz) 5 4 3 2 1 5 4 3e
21I
5 4 3I- 2
1 TOV-3ß V
-2ß V
0 50 100 Frequency (kHz) 150 (a) 5 4 3 2"
5 1 4 3..
e 1 raV -QCV 200 0 50 100 Frequency (kHz) 150 (b) 200Figure 3 illustrates the ETO spectra of a DFNLC and a DFCLC containing 21.6-wt% chiral dopant at various applied voltages. Here the thermodielectric effect in DF mesogenic substances plays an important role in the understanding of the spectral feature. The thermodielectric effect, which is particularly noteworthy at higher frequencies, arises from the efficient absorption of electromagnetic energy by the dielectric molecules through reorientation of dipoles. This effect generates heat, leading to the increase in fc.In other words, Δε reverts to a positive at frequencies beyond, but not too far away from, the original fc value when the dielectric heating takes place to induce the ETO effect.14 In Fig. 3(a), the cell is initially in the P state. When a lower voltage at a lower frequency is applied, Δε is
positive and the cell remains in the P state. When the applied frequency is increasing over the fc, theΔε is negative and P state is still maintained. Note that the transmittance is decreasing when applied frequency is lower than 25 kHz. Because the LC molecule will shake and vibrate with AC field leading to EHD effect. Keeping increasing the frequency induces appreciable dielectric heating, allowing fc to elevate over the applied frequency and Δε to eventually become positive so that the P state transforms to the H state. The intensity decrease obviously and approach to zero in NLCs. When the applied frequency increasing over the fc again, negative dielectric force lets the H state back to the P state. Note that the scanning time used is 10 sec in this study. As shown in Fig. 3(b), a similar spectral profile is disclosed in the DFCLC, with its characteristic states GP and FC instead of P and H in the DFNLC counterpart, respectively. Compared with that in DFNLCs, the ETO effect in DFCLCs is more complicated. The chiral-dopant concentration is determinant to produce a notch spectrum.
Figure 2. Optical transmission at 633 nm and temperature plotted against the applied frequency in a (a) CLC and (b) DFCLC at 70 V. The chiral-dopant concentration is 21.6 wt%.
Figure 3.ETO behaviors in (a) a DFNLC cell and (b) a DFCLC cell at various applied voltages.
Proc. of SPIE Vol. 10125 1012516-3
5 4 50 160 150 Frequency (kHz 100 E 75 60 26 200 4ßQ 660 Wavelength (nm) (a) 800 2 Q 5ß 9ßß 950 200 Frequency (kHzj 5
4
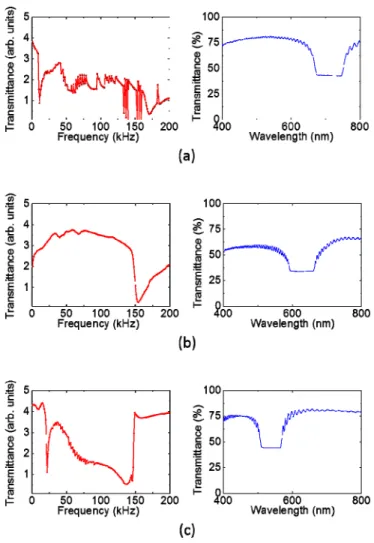
f10 100 75 60 25 e 50 100 1SQ 2ßß 400 Frequency (kHz) Wavelength (rtm) 800 (c) Wavelértgth (ran) 800Figure 4. Visible spectra of various DFCLCs in the stable GP state and the corresponding ETO behaviors at 70 V. The chiral-dopant concentrations are (a) 19.0, (b) 21.6, and (c) 25.6 wt%.
Figure 4 shows the transmission spectra of three DFCLC samples in the initial GP state and their ETO behaviors probed by a laser beam of 633 nm in wavelength. Note that these spectra have a common feature assigned to the Bragg reflection whose central wavelength is determined by the concentration of the given chiral dopant S811. According to our previous study,14 the dielectric heating power is related with the concentrations of chiral dopant. The higher chiral
dopant concentration is easily to generate the thermodielectric effect in CLCs.14From Fig. 4(a), We can observe that the
suitable concentrations of chiral dopant can induced the notch-liked spectrum behavior. The too higher and lower concentrations of chiral dopant are hard to produce this behavior. In the lower concentration as 19 wt%, the thermodielectric power is a little weak. When the speed of thermodielectric induced fc shifting and applied frequency increasing is about the same time, the zigzag curve will carry out as shown in Fig. 4(a). In contrast, a higher dopant concentration results in higher heating power, causing fc to shift to a higher frequency range and allowing Δε to remain positive. One can see from Fig. 4(c) that the transmitted intensity drops sharply at 22 kHz because the applied frequency close to fc makes the GP state change to the FC state. However, the fc shift fast after 22 kHz. The Δε changes to negative and the GP state is demonstrated. The heating rate is fast and make the GP back to the FC again. Thus, it owns two peaks in 25.6 wt%. Figure 4(b) presents an extinction band in the plot of the transmission vs. the frequency of an applied voltage at 70 Vrms. It is easy to form one deep near 21.6 wt% The scanning time used is 5 sec in the three CLC devices.
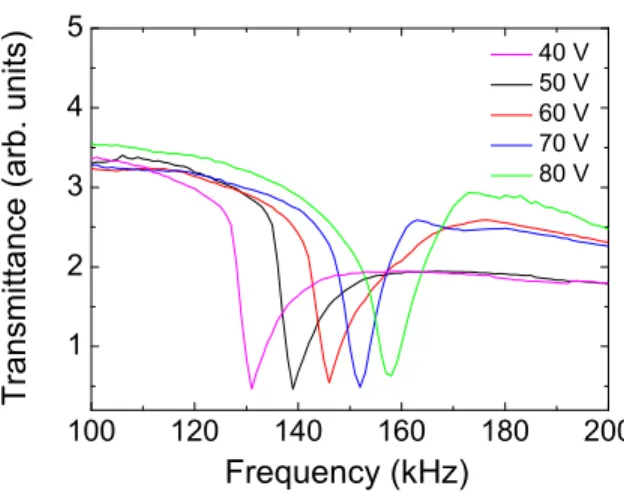
Figure 5 depicts the voltage-dependent ETO effect in a DFCLC with a chiral-dopant concentration of 21.6 wt%. A higher applied voltage yields a higher heating power, which results in a greater thermoinduced shift of fc and, in turn, gives rise to the blueshift of the extinction band due to the scattering FC state. In this study the tunable range of frequency for the spectral notch is about 19 kHz.
Proc. of SPIE Vol. 10125 1012516-4
100 120 140 160 180 200 1 2 3 4 5 T rans mittan ce (a rb. units ) Frequency (kHz) 40 V 50 V 60 V 70 V 80 V
Figure 5.Tunable optical notch based on the ETO effect with different operation voltages. The chiral-dopant concentration is 21.6 wt%.
4. CONCLUSION
In summary, an electrical-induced thermodielectric affecting optical property in LCs system was first investigated. By using the ETO effects in LCs, a tunable optical device can be achieved. Comparing with the old EO effect of LCs, the ETO effect propose a lot of interesting physics and spectra behavior. Based on this special ETO effect, the electrical tuning spectra device represents an astonishing and important step towards the modern optics.
5. ACKNOWLEDGMENTS
The authors gratefully acknowledge support from the Ministry of Science and Technology, Taiwan, through Grant No. 104-2112-M-009-008-MY3.
REFERENCES
[1] Heilmeier, G. H., Zanoni, L. A., and Barton, L. A., “Dynamic scattering: A new electrooptic effect in certain classes of nematic liquid crystals,” Proc. IEEE 56, 1162–1171 (1968).
[2] Heilmeier, G. H., “Liquid crystal displays: An experiment in interdisciplinary research that worked,” IEEE Trans. Electron. 23, 780–785 (1976).
[3] Golovin, Andrii B., Sergij V. Shiyanovskii and Lavrentovich O. D., “Fast switching dual-frequency liquid crystal optical retarder, driven by an amplitude and frequency modulated voltage,” Appl. Phys. Lett. 83, 3864– 3866 (2003).
[4] Lin, P. T., Liang, X., Ren, H., and Wu, S. T., “Tunable diffraction grating using ultraviolet-light-induced spatial phase modulation in dual-frequency liquid crystal,” Appl. Phys. Lett. 85, 1131–1133 (2004).
[5] Xianyu, H., Wu, S. T., and Lin, C. L., “Dual frequency liquid crystals: a review,” Liq. Cryst. 36, 717–726 (2009).
[6] Hsiao, Y. C., Wu, C. Y., Chen, C. H., Zyryanov, V. Y., and Lee, W., “Electro-optical device based on photonic structure with a dual-frequency cholesteric liquid crystal,” Opt. Lett. 36, 2632–2634 (2011).
[7] Hsiao, Y.-C., Hou, C.-T., Zyryanov, V. Ya., and Lee, W., “Multichannel photonic devices based on tristable polymer-stabilized cholesteric textures,” Opt. Express 19, 23952–23957 (2011).
[8] Hsiao, Y.-C., Zou, Y.-H., Timofeev, I. V., Zyryanov, V. Ya. and Lee, W., “Spectral modulation of a bistable liquid crystal photonic structure by the polarization effect,” Opt. Mater. Express 3, 821–828 (2013).
[9] Hsiao, Y.-C., Tang, C.-Y., and Lee, W., “Fast-switching bistable cholesteric intensity modulator,” Opt. Express 19, 9744–9749 (2011).
[10] Hsiao, Y. C., Wang, H. T., and Lee, W, “Thermodielectric generation of defect modes in a photonic liquid crystal,” Opt. Express 22, 3593-3599 (2014).
Proc. of SPIE Vol. 10125 1012516-5
[11] Wen, C. H., and Wu, S. T., “Dielectric heating effects of dual-frequency liquid crystals,” Appl. Phys. Lett. 86, 231104 (2005).
[12] Yin, Y., Shiyanovskii, S. V., Golovin, A. B. and Lavrentovich, O. D., “Dielectric torque and orientation dynamics of liquid crystals with dielectric dispersion,” Phys. Rev. Lett. 95, 087801 (2005).
[13] Yin, Y., Shiyanovskii, S. V., and Lavrentovich, O. D., “Electric heating effects in nematic liquid crystals,” J. Appl. Phys. 100, 024906 (2006).
[14] Hsiao, Y. C., and Lee, W., “Lower operation voltage in dual-frequency cholesteric liquid crystals based on the thermodielectric effect,” Opt. Express 21, 23927 (2013).
[15] Kramer, L., and Pesch, W., “Convection instabilities in nematic liquid crystals,” Annu. Rev. Fluid Mech. 27, 515 (1995).
[16] Kai, S., and Zimmermann, W., “Pattern dynamics in the electrohydrodynamics of nematic liquid crystals, “Prog. Theor. Phys. Suppl. 99, 458 (1989).
[17] Hsiao, Y. C., and Lee, W., “Polymer stabilization of electrohydrodynamic instability in non-iridescent cholesteric thin films,” Opt. Express 23, 22636 (2015).
Proc. of SPIE Vol. 10125 1012516-6