行政院國家科學委員會專題研究計畫 成果報告
盈餘屬性與會計師任期
計畫類別: 個別型計畫 計畫編號: NSC94-2416-H-004-036- 執行期間: 94 年 08 月 01 日至 95 年 07 月 31 日 執行單位: 國立政治大學會計學系 計畫主持人: 戚務君 報告類型: 精簡報告 報告附件: 出席國際會議研究心得報告及發表論文 處理方式: 本計畫可公開查詢中 華 民 國 95 年 10 月 17 日
General Knowledge, Client-Specific Knowledge and Audit Quality: An Audit Partner Based Investigation
Wuchun Chi Department of Accounting National Chengchi University
Taipei, Taiwan Email: [email protected]
Linda A. Myers Department of Accounting
Texas A&M University College Station, Texas 77843 Email: [email protected]
Thomas C. Omer Department of Accounting
Texas A&M University College Station, Texas 77843 Email: [email protected]
Hong Xie
Department of Accountancy University of Illinois at Urbana-Champaign
Champaign, Illinois 61820 Email: [email protected]
October 2006
<Please do not quote without permission>
Comments welcome. Professor Chi gratefully acknowledges the financial support from National Science Council (Project No. NSC 94-2416-H-004-036).
General Knowledge, Client-Specific Knowledge and Audit Quality: An Audit Partner Based Investigation
Abstract:
This study distinguishes three kinds of audit partner experiences: general, industry-specific, and client-specific knowledge to explore whether, and how, different knowledge affects audit quality. Three measures to evaluate audit quality are abnormal accruals, cost of borrowings from bank, and perceived audit quality. We find strong evidence to support that client-specific knowledge has significant effect on promoting high quality of audit, and there can find weak evidence to claim that general knowledge and industry specific also have a role in audit quality. However, when we investigate a very particular sample – a brand new audit engagement of an audit firm, i.e., there has no client-specific knowledge before that engagement (the audit firm tenure and the audit partner tenure are both equal to one), we find no role in general and industry-specific knowledge on affecting audit quality. These findings suggest that in an audit partner rotation regime, choosing an experienced successive audit partner with more general knowledge and industry experience at the first year right after the required rotation may be a substitute for the incumbent audit partner in order to ease the cost of mandatory auditor rotation. But that effect is not as strong as the conventional wisdom expects based on our findings.
1. Introduction
We examine whether audit quality, measured by abnormal accruals, cost of debt, and market perception, is better as the audit partner’ general knowledge, industry-specific knowledge, and client-specific knowledge increases. Considering several potential downsides (e.g., removing the whole of experienced audit firm’s cumulative knowledge if audit-firm rotation is implemented), Congress adopts a less costly decisions, i.e., tightening the audit partner rotation rules rather than approving an audit firm rotation. However, it does not mean that there exists no cost related to lack-of-experience in the audit partner rotation regime.
It is well known that auditor must understand the client’s business to audit it effectively, and, in fact, many articles also find evidence to support that knowledge cumulated and built up over tenure is vital for providing high quality audit (e.g., Chi et al. 2006, Ghosh and Moon 2005, Johnson et al. 2002, Myers et al. 2003). However, an unanswered question is that whether, and how, auditors’ non client-specific experience and knowledge can play an active role in prompting audit quality. If the level of non client-specific skill has significant role to discriminate audit quality, the successive audit partner after rotation having more general knowledge and industry experience could be a substitute of the incumbent audit partner. Therefore, a deliberately assigned successive audit partner can significantly alleviate (or even perfectly resolve) the drawbacks of mandatory rotation regime. If not the case, on contrary, supposing evidence shows that idiosyncratically client-specific experience dominates that from general and/or industry specific knowledge, then the benefit of audit partner rotation providing a fresh look must be leveraged for the cost on hurting audit quality. Three constructs we use in study are abnormal accruals, creditor perspective, and equity market perceptions. Our findings provide strong evidence that client specific knowledge and experience plays the most important factors for auditors to providing high quality audit. Regarding the role on general knowledge and industry specific knowledge on promoting audit quality, we can find weak several evidences to support that they have an effect.
Individual experience effect can be seen on the studies related to security analyst forecast (e.g., Mikhail et al. 1997 and Mikhail et al. 2003). Our results consist with client-specific experience, but not non client-client-specific knowledge, improve audit quality. Said another way, auditor with general knowledge and industry-specific experience are not likely to a completely substitutive effect on client-specific knowledge.
We caution that the implications of our study are not to claim general knowledge and industry-specific knowledge are useless. Because each audit partner must already have many working experience (from junior, senior, manager to an audit partner) to be a partner, it maybe the reason that “incremental” general knowledge and experience measured in this study are not beneficial.
The remainder of the paper is organized as follows. Section 2 reviews the literature and develops hypotheses. Section 3 describes data and sample selection. We present our empirical models and findings in Section 4 and conclude in Section 5.
2. Literature Review
The task of auditing is a professional job, which means that books and guides can help auditors conduct their professional judgments; however, the best place to get knowledge should be from their experiences directly. MMO (2003) find that client specific experience and knowledge plays an important role to enhance audit quality, but they trace auditor tenure only at the audit firm level. Carey and Simnett (2006) examine the association between audit partner tenure and audit quality, but they do not discriminate different dimensions of knowledge and experience – general, industry-specific, and client specific knowledge. As our best knowledge, this is the first empirical work to investigate whether, and how, firm tenure and various kinds of audit-partner experience and tenure affect audit quality.
If auditor’s general knowledge has beneficial effect; we would expect that knowledge unattached on client specific experience have positive effect on audit quality. However, if client-specific knowledge is very critical on enhancing audit quality, we will see evidence that non idiosyncratic experience has little role on improving audit quality. Supposing that is the case, we can indirectly claim that audit partner rotation, even rotated to an “experienced” audit partner, will not enhance audit quality, because client specific experience is vital. To achieve this purpose, this study provides observations on audit partners’ general knowledge and client specific knowledge and audit quality.
To explore how different kinds of auditor experience and knowledge affect earnings (audit) quality, this study measures four types of tenure: (1) general knowledge (hereafter GK),1 the number of years which the audit partner has signed an audit report, (2) industry-specific knowledge (hereafter IK), the number of years which the audit partner has provided audit service at the same industry, (3) client-specific knowledge (hereafter CS),2 the number of years of the audit partner’s client-specific tenure, and (4) audit-firm
tenure (hereafter FT).
While the Big N audit firms are treated as a homogenous group of auditors that provide higher quality audits than the non-Big N audit firms (DeAngelo 1981, Palmrose 1988), recent articles provide evidence that audit quality within the Big N audit firms are not the same (e.g., Craswell et al. 1995 and Ferguson et al. 2003 examine audit fee premium). This paper further explores this related issue but focus on audit partner level. Different form those studies, we (i) measure a given audit partner’s prior industry-specific experience before providing the audit service for an engagement, and (ii) focus on audit partner level instead of audit firm level.
Because all experience, general, industry-specific and client-specific, is acquired through experience working with individual clients in specific industries and should reside in the unique personnel of the audit firm, we argue that it is worth to explore how different kinds of experience affect audit quality at the audit-partner level.
1 Clement (1999) define general experience as the tenure of the analysts, i.e., years of analyst work experience.
2 Mikhail et al. (1997) use firm-specific experience, the number of prior quarters an analyst issues quarterly earnings forecast for a specific firm.
Owhoso et al. (2002) find that audit seniors (managers) detect more mechanical (conceptual) errors than managers (seniors) holds only when auditors are working in their industry specializations. They use the job on work paper review of a superior team member. Godfrey and Hamilton (2005) find that specialist auditor choice is associated with R&D, a particular discretionary expenditure. While many articles have found that the industry-specialist provide higher quality of service, it does not mean that they will fit in the auditing context, because the most foci of the task of auditors are client-specific oriented.
3. Research Design
We use three measures to address this issue: (1) abnormal accruals (MMO), (2) cost of debt (Francis et al. 2005), and (3) earnings response coefficients (Ghosh and Moon 2005).
Abnormal Accruals
Similar to MMO (2003, page 789), we first calculate extreme accruals by modified Jones model, and then run the following regression model:
ε BigN b CashFlow b owth IndustryGr b Assets b FirmAge b Tenure b b Accruals 6 5 4 3 2 1 0 + + + + + + + = (1) where
Accruals = modified Jones abnormal accruals, measured in absolute, positive and negative values;
Tenure = various tenure or experience (i.e., GK, IK, CS, and FT) traced back to 1983;
FirmAge = number of years since the company was setup;
Assets = natural logarithm of total assets at the beginning of the year t; IndustryGrowth = industry growth =
∑
∑
= −= N i t i N i t i SALES SALES 1 1 , 1
, / by the TEJ industry
classification;
CashFlow = cash from operations from the statement of cash flows of year t scaled by total assets at the beginning of the year t;
BigN = a dummy variable equal to 1 if the auditor is from a Big 4 or Big 5 audit firm, and equal to 0 otherwise;3
Because GK ≥ IK, IK ≥ CS, and, in normal cases, FT ≥ CS,4 we also perform the
following regression model to investigate the incremental effect for GK, IK, and FT.
ε BigN b CashFlow b owth IndustryGr b Size b FirmAge b CS) (FT b CS b CS) (IK b IK) (GK b b Accruals 9 8 7 6 5 4 3 2 1 0 + + + + + + − + + − + − + = (2) The coefficients, in equation (2),b1, b2, b3, and b4 reports the incremental effect of GK, IK,
CS, and FT on extreme accruals, respectively.
Finally, a choreographed sample, the observations whose audit firm tenure equals one, is chosen because this sample whose client-specific knowledge, both audit firm and audit partner, are both empty. This particular sample provides us a unique environment to examine whether non idiosyncratic experience has a role to improve audit quality. We will use this particular sample to rerun equation (1) where CS and FT will be dropped.
Cost of Debt
Following Francis et al (2005), we run the following regression.
ε IntCov b ROA b σ(NIBE) b Leverage b Size b RankAQ b Tenure b b COD 7 6 5 4 3 2 i 1 0 + + + + + + + + = (3) where
COD = current period’s cost of borrowing from banks;5
RankAQ = using each firm’s rolling ten year windows to regress current accruals (divided by total assets) on lagged, current and future cash flows from operations (divided by total assets), then, gauging the ten firm- and year-specific residuals to calculate the standard deviation of the firm’s estimated residuals, finally, deciles it into the range of one to ten;6 Leverage = interest-bearing debt to total assets;
)
σ(NIBE = rolling 10-year standard deviation of individual firm’s net income before extraordinary item, scaled by total assets ;
ROA = return on assets;
4 However, it can be possible that the CS > FT when an audit-partner works for another new audit-firm and his client(s) also chooses to switch to that new audit firm. We will delete these observations in this study. 5 Taiwanese public firms must disclosure the information on their bank loans, both short-term and long term. So, we use the new lends from banks during year t to calculate cost of borrowings form banks for each firm in each year.
IntCov = operating income to interest expense
Based on the similar reason mentioned above, we also rerun equation (3) for the auditees whose audit firm tenure equals one.
Perceived Audit Quality
To examine whether the various tenures affect perceived audit quality, following Chi et al. (2006) and Ghosh and Moon (2005), we perform the fowling regressions.
e Leverage b Size b Beta b Volatility b e Persistenc b Growth b FirmAge b ΔETenure b ETenure b Tenure b ELoss b Loss b ΔE b E b b CAR 14 13 12 11 10 9 8 7 6 5 4 3 2 1 0 + + + + + + + + + + + + + + + = (4) where:
CAR = cumulative value-weighted market-adjusted abnormal returns over 16 months from January;7
E = income from continuing operations of year t, scaled by the market value of equity at the beginning of year t;
ΔE = The difference between income before extraordinary items deflated by market value of equity the beginning of the year;
Loss = A dummy variable equal to 1 if E < 0, and equal to 0 otherwise; ELoss = E × Loss, the interaction between E and Loss;
Tenure = various tenure, GK, IK, CS, and FT, traced back to 1983; ETenure = E × Tenure, the interaction between E and Tenure; ΔETenure = ΔE × Tenure, the interaction between ΔE and Tenure;
FirmAge = the number years that the firm is setup;
Growth = the sum of the market value of equity and the book value of debt scaled by the book value of total assets;
7 Observations our samples all have calendar year companies. Since Taiwanese regulations require public companies to release annual reports within four months after the end of the annual period, our return accumulation periods end in next year’s April to ensure that semi-annual reports are released to the market and reflected in returns.
Persistence = the first-order autocorrelation of income before extraordinary items per share for the past 16 quarters;
Volatility = the standard deviation of income before extraordinary items per share for the past 16 quarters;
Beta = the systematic risk computed using the past 36 monthly stock returns; Size = the logarithmic transformation of the beginning-of-year market value of
equity; and
Leverage = the ratio of total debt to total assets.
4. Empirical Findings
Accruals Analysis
Starting from 1983, an audit report in Taiwan has to be signed by two auditors. In practice, the one sign first (second) is the lead (concurrent) audit partner. We calculate all partner-related tenure (i.e., GK, IK, and CS) for this lead audit partner. All experience (tenure) is traced back to 1983 and our research sample consists of all firm-years from 1990 to 2004. The reason we start from 1990 because, in Taiwan, statements of cash flows are available since that year. In addition, we treat audit firms merger as a continuation of audit firm tenure. All firms are listed in Taiwan Stock Exchange Corporation (TSEC) and Gretai Securities Market (GTSM), two main stock exchanges in Taiwan. They are analogous to NYSE and NASDAQ in the U.S.
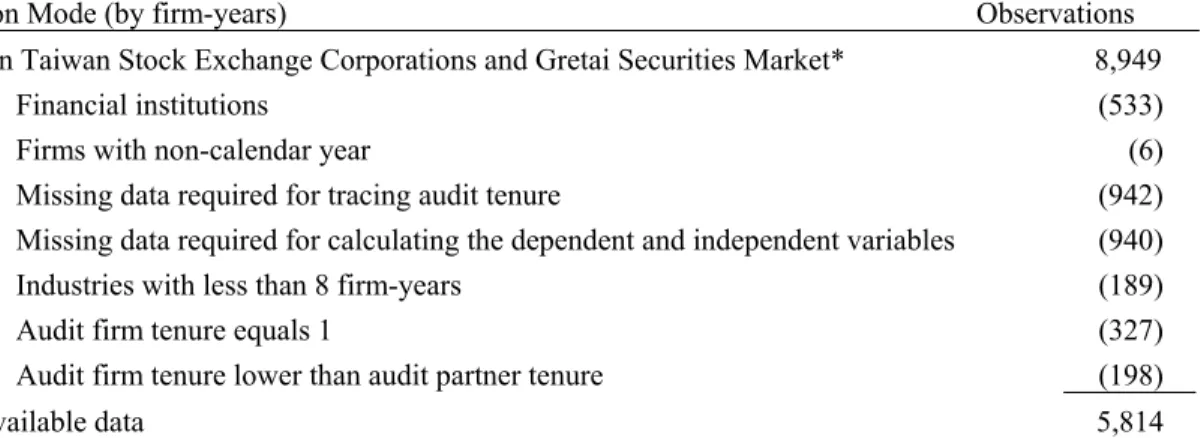
In addition, The ultimate data we use should be satisfy with the following requirements: (1) each industry-year must have observations larger than eight, (2) all variables, dependent and independent, are not missing, (3) audit firm tenure is not equal to one, and (4) audit-firm tenure is no less than audit-partner tenure (see footnote 1). Table 1 reports the sample selection process. This process results in a final sample of 5,814 Taiwanese listed companies.
[Insert Table 1 here]
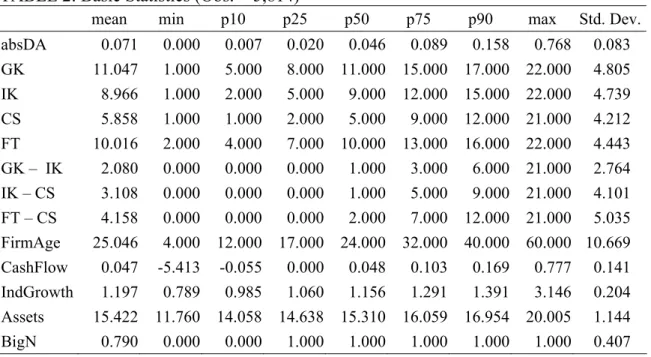
Table 2 reports the basic statistics of all variables used in our equations (1) and (2). The mean absDA is 0.071, and the averages of each kind of experience are: GK (11.0447), IK (8.966), CS (5.858), FT (10.016), and GK – IK (2.080), IK – CS (3.108), and FT – CS (4.158). Turning to control variables, the average FirmAge, the years since the company was setup, of these observations is 25.046 years; mean of CashFlow, IndGrowth, and Assets are 0.047, 1.197, and 15.422, respectively. The portion of the auditee being Big N’s clients is 0.790. .
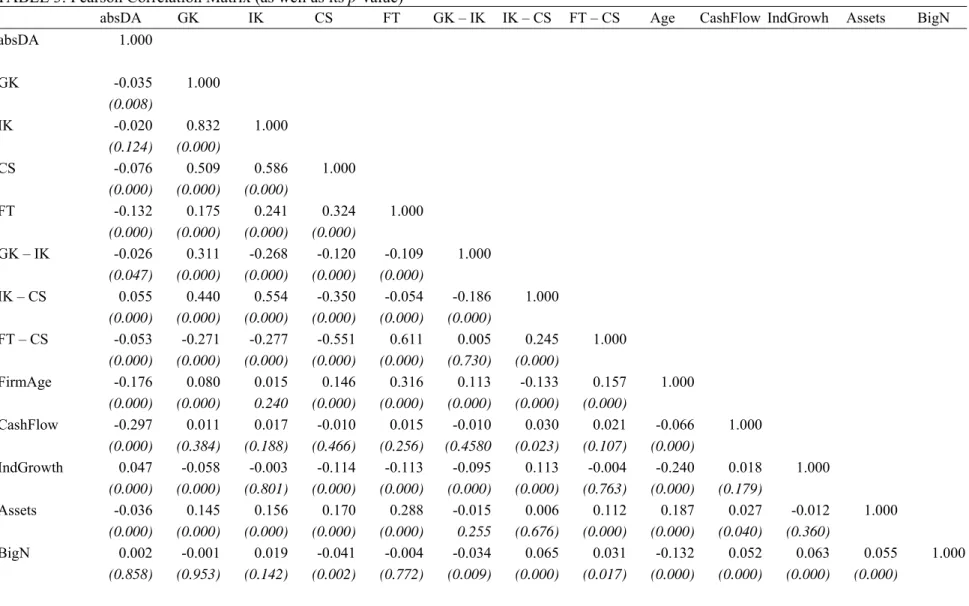
Table 3 documents the Pearson correlation matrix. Except for IK – CS, all experience-related variables are negative correlated with absDA. In addition, all tenure-related variables are positively cortenure-related with each other.
[Insert Table 3 here]
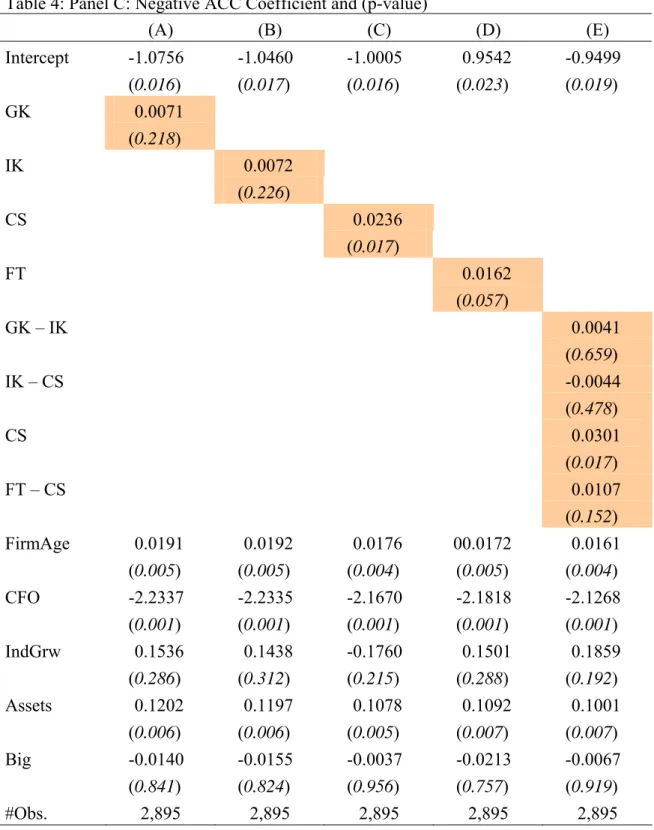
Table 4 documents the regression results. When examining Panel A, absolute value of abnormal accruals: (1) column C shows that client specific knowledge has a significant role on enhancing audit quality, (2) column D shows that audit firm tenure also has a significant role on enhancing audit quality, (3) column E shows that even control for other kinds of experience, client specific knowledge still has its role, (4) column E shows that incremental audit firm tenure as well positively affect audit quality, and (5) there exists no role on general knowledge or industry-specific knowledge has an active role on promoting high quality of audit, either the two kinds of knowledge stand alone (column A and B) or their incremental knowledge (column E).
The same collusions can be made if we examine the findings reported on Panel B; however, the incremental audit firm tenure effect disappeared if we look at column E of Panel C.
[Insert Table 4 here]
We further examine a particular sample in which audit firm tenure are all equal to one. This particular sample provides us a unique environment to examine whether non idiosyncratic experience has a role to improve audit quality, because this sample whose client-specific knowledge, both audit firm and audit partner, are both empty. Table 5 documents the findings.
[Insert Table 5 here]
Consistent with Table 4, we find no evidence to claim that different level of general knowledge and industry-specific knowledge have dissimilar role on affecting audit quality. It should be noticed that we do not mean that these experiences are not important, but our accruals-based evidence cannot tell the different by way of them.
Cost of Debt Analysis
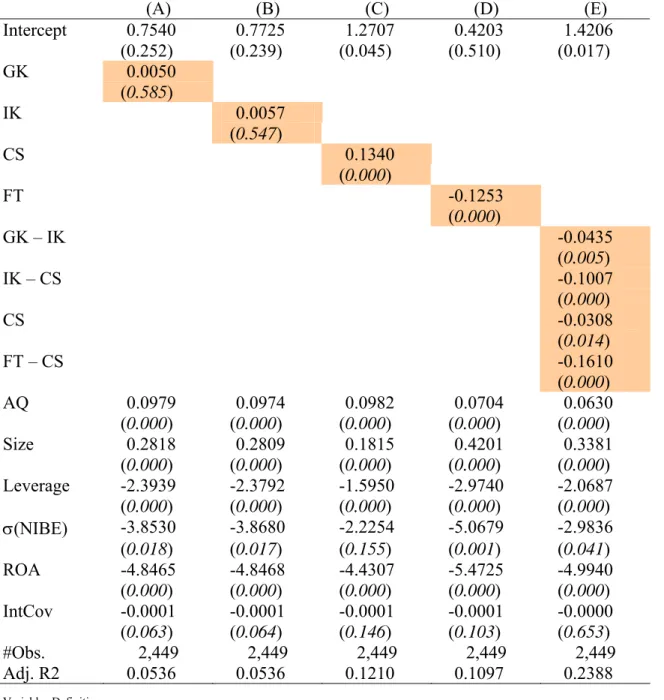
Table 6 reports the findings on how various tenure and experience affect cost of debt. Most finding are consistent with those appeared on the accruals based evidence. First, there is no role on general knowledge and industry specific on promoting audit quality (columns A and B). Second, there exists strong evidence to claim that client specific tenure, both audit-partner tenure (column C) and audit-firm tenure (column D), have vital role on promoting high quality audit. Third, after control other experiences (column E) both client specific and incremental audit firm tenure still hold the role. Only one exception is that, examining column E, we can find the role of incremental general knowledge and industry specific knowledge are significant.
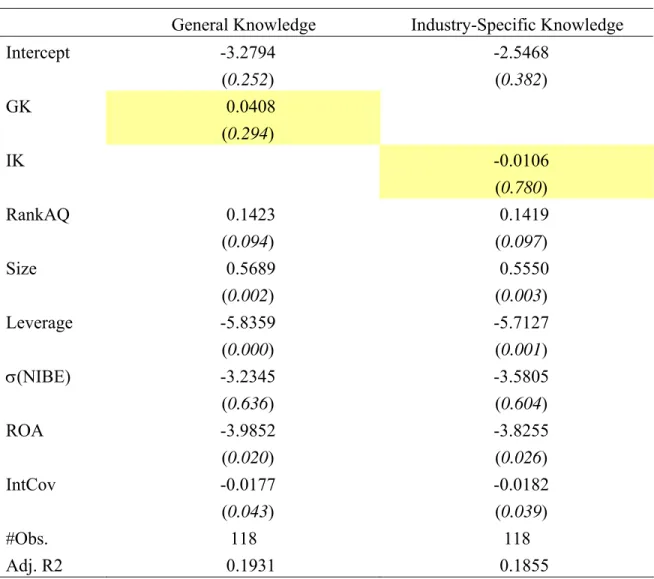
We also inspect that a particular sample, a sample whose audit firm tenure are all equal to one, to re-examine the effect of general knowledge and industry-specific knowledge. Again, we find no active role on GK and IK.
[Insert Table 7 here]
Earnings Response Coefficients
Table 8 (audit firm tenure = 1 is excluded) and Table 9 (only incorporate audit firm tenure = 1), respectively, reports the how various knowledge and experience affects perceived audit quality on various tenures. We first look at Table 8.
[Insert Table 8 here] [Insert Table 9 here]
Column A shows that the coefficient on E and ΔE are all positive, and sum of them, 0.1885 (p-value < 5%), reveals the ERC is significantly positive. Column B adding an indicator variable, loss or not (Loss), and the level of loss (Loss × E) shows that both Loss and Loss × E have a significant role in explaining CAR. To control for the potential loss effect we use column B as our base model to explore the perceived audit quality effect. Although the coefficient on ΔE becomes negative, the sum of the coefficients of E and ΔE (1.5660) is still significantly positive. In fact, the row b1 + b2, the main ERC
effect in this study, are all statistically positive.
When we examine each experience effect individually (i.e., columns C ~ F), our previous findings are all sustained. Specifically, there is no effect on general knowledge (column C) and industry-specific knowledge (column D), on the contrary, there role of audit partner (column E) and audit firm tenure (column F) are both positive. However, when we control for all kinds of experiences (column G), none of them is significant. While the coefficient on CS is insignificant at the conventional significance level, however, its p-value, 0.123, has already closed to an acceptable level.
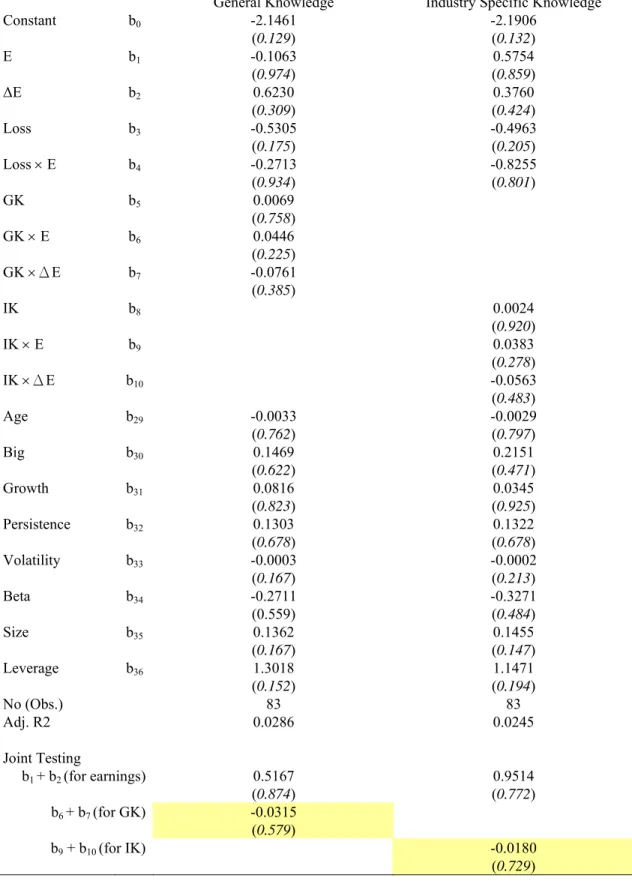
Finally, we also use the FT =1 sample to explore how GK and IK affects audit quality and report the results in Table 9. Again, there is no significant finding on GK or IK.
5. Conclusions
Myers et al. (2003) investigate the relation between earnings quality proxies and the length of the auditor-client relationship (audit firm tenure). They find that tenure is negatively associated with the absolute value of discretionary accruals and conclude that earnings quality appears to improve the longer the auditor-client relationship. They suggest that earnings quality can proxy for audit quality because auditors can influence the earnings numbers reported by management. They interpret the negative association between tenure and discretionary accruals as consistent with the notion that it takes
auditors time to develop client-specific expertise (which is necessary to constrain extreme management choices).
However, the role of auditor tenure in constraining managers’ extreme accrual decisions should be further decomposed into different concepts. In this study, we examine whether audit quality, measured by abnormal accruals, cost of debt, and market perception, is better as the audit partner’ general knowledge, industry-specific knowledge, and client-specific knowledge increases.
We find strong evidence to support that client-specific knowledge has significant effect on promoting high quality of audit, and there can find weak evidence to claim that general knowledge and industry specific also have a role in audit quality. However, when we investigate a very particular sample – a brand new audit engagement of an audit firm, i.e., there has no client-specific knowledge before that engagement (the audit firm tenure and the audit partner tenure are both equal to one), we find no role in general and
industry-specific knowledge on affecting audit quality. These findings suggest that in an audit partner rotation regime, choosing an experienced successive audit partner with more general knowledge and industry experience at the first year right after the required
rotation may be a substitute for the incumbent audit partner in order to ease the cost of mandatory auditor rotation. But that effect is not as strong as the conventional wisdom expects based on our findings
References
Carey, P., and R. Simnett. 2006. Audit partner tenure and audit quality. The Accounting Review 81 (3): 653-676.
Clement, M. B. 1999. Analyst forecast accuracy: Do ability, resources, and portfolio complexity matter? Journal of Accounting and Economics 27: 285-303.
Chi, W., H. Huang, Y. Liao, and H. Xie. 2006. Mandatory Audit-Partner Rotation, Audit Quality and Market Perception: Evidence from Taiwan. Working Paper.
Francis, J., R. LaFond, P. Olsson, and K. Schipper. 2005. The market pricing of accruals quality. Journal of Accounting and Economics 39: 295-327.
Ghosh, A., and D. Moon. 2005. Auditor tenure and perceptions of audit quality. The Accounting Review 80 (2): 585-612.
Godfrey, J. M., and J. Hamilton. 2005. The impact of R&D intensity on demand for specialist auditor services. Contemporary Accounting Research 22 (1): 55-93. Johnson, V., I. Khurana, and J. Reynolds. 2002. Audit-firm tenure and the quality of
financial reports. Contemporary Accounting Research 19 (4): 637-660.
Mikhail, M. B., B. R. Walther, and R. H. Willis. 1997. Do security analysts improve their performance with experience? Journal of Accounting Research 35: 131-157.
Mikhail, M. B., B. R. Walther, and R. H. Willis. 2003. The effect of experience on security analyst underreaction. Journal of Accounting and Economics 35: 101-116. Myers, J., L. Myers, and T. Omer. 2003. Exploring the term of auditor-client relationship
and the quality of earnings: A case for mandatory auditor rotation? The Accounting Review 78 (3): 779-799.
Owhoso, V. E., W. F. Messier, JR., and J. G. Lynch, JR. 2002. Error detection by industry-specialization teams during sequential audit review. Journal of Accounting Research 40 (3): 883-900.
TABLE 1: Sample Selection (1990 to 2004)
Selection Mode (by firm-years) Observations
Listed in Taiwan Stock Exchange Corporations and Gretai Securities Market* 8,949
Less: Financial institutions (533)
Firms with non-calendar year (6)
Missing data required for tracing audit tenure (942) Missing data required for calculating the dependent and independent variables (940)
Industries with less than 8 firm-years (189)
Audit firm tenure equals 1 (327)
Audit firm tenure lower than audit partner tenure (198)
Total available data 5,814
* Taiwan Stock Exchange Corporation (TSEC) and Gretai Securities Market (GTSM) are two main stock exchanges in Taiwan. They are analogous to NYSE and NASDAQ in the U.S.
TABLE 2: Basic Statistics (Obs. = 5,814)
mean min p10 p25 p50 p75 p90 max Std. Dev.
absDA 0.071 0.000 0.007 0.020 0.046 0.089 0.158 0.768 0.083 GK 11.047 1.000 5.000 8.000 11.000 15.000 17.000 22.000 4.805 IK 8.966 1.000 2.000 5.000 9.000 12.000 15.000 22.000 4.739 CS 5.858 1.000 1.000 2.000 5.000 9.000 12.000 21.000 4.212 FT 10.016 2.000 4.000 7.000 10.000 13.000 16.000 22.000 4.443 GK – IK 2.080 0.000 0.000 0.000 1.000 3.000 6.000 21.000 2.764 IK – CS 3.108 0.000 0.000 0.000 1.000 5.000 9.000 21.000 4.101 FT – CS 4.158 0.000 0.000 0.000 2.000 7.000 12.000 21.000 5.035 FirmAge 25.046 4.000 12.000 17.000 24.000 32.000 40.000 60.000 10.669 CashFlow 0.047 -5.413 -0.055 0.000 0.048 0.103 0.169 0.777 0.141 IndGrowth 1.197 0.789 0.985 1.060 1.156 1.291 1.391 3.146 0.204 Assets 15.422 11.760 14.058 14.638 15.310 16.059 16.954 20.005 1.144 BigN 0.790 0.000 0.000 1.000 1.000 1.000 1.000 1.000 0.407 Variables Definitions:
absDA = The absolute value of modified Jones abnormal accruals, measured in absolute, positive and negative values;
Tenure = various tenure or experience (i.e., GK, IK, CS, and FT) traced back to 1983; FirmAge = number of years since the company was setup;
Assets = natural logarithm of total assets at the beginning of the year t; IndustryGrowth = industry growth =
∑
∑
= − = N i t i N i t i SALES SALES 1 1 , 1
, / by the TEJ industry classification;
CashFlow = cash from operations from the statement of cash flows of year t scaled by total assets at the beginning of the year t;
BigN = a dummy variable equal to 1 if the auditor is from a Big 4 or Big 5 audit firm, and equal to 0 otherwise;
TABLE 3: Pearson Correlation Matrix (as well as its p-value)
absDA GK IK CS FT GK – IK IK – CS FT – CS Age CashFlow IndGrowh Assets BigN
absDA 1.000 GK -0.035 1.000 (0.008) IK -0.020 0.832 1.000 (0.124) (0.000) CS -0.076 0.509 0.586 1.000 (0.000) (0.000) (0.000) FT -0.132 0.175 0.241 0.324 1.000 (0.000) (0.000) (0.000) (0.000) GK – IK -0.026 0.311 -0.268 -0.120 -0.109 1.000 (0.047) (0.000) (0.000) (0.000) (0.000) IK – CS 0.055 0.440 0.554 -0.350 -0.054 -0.186 1.000 (0.000) (0.000) (0.000) (0.000) (0.000) (0.000) FT – CS -0.053 -0.271 -0.277 -0.551 0.611 0.005 0.245 1.000 (0.000) (0.000) (0.000) (0.000) (0.000) (0.730) (0.000) FirmAge -0.176 0.080 0.015 0.146 0.316 0.113 -0.133 0.157 1.000 (0.000) (0.000) 0.240 (0.000) (0.000) (0.000) (0.000) (0.000) CashFlow -0.297 0.011 0.017 -0.010 0.015 -0.010 0.030 0.021 -0.066 1.000 (0.000) (0.384) (0.188) (0.466) (0.256) (0.4580 (0.023) (0.107) (0.000) IndGrowth 0.047 -0.058 -0.003 -0.114 -0.113 -0.095 0.113 -0.004 -0.240 0.018 1.000 (0.000) (0.000) (0.801) (0.000) (0.000) (0.000) (0.000) (0.763) (0.000) (0.179) Assets -0.036 0.145 0.156 0.170 0.288 -0.015 0.006 0.112 0.187 0.027 -0.012 1.000 (0.000) (0.000) (0.000) (0.000) (0.000) 0.255 (0.676) (0.000) (0.000) (0.040) (0.360) BigN 0.002 -0.001 0.019 -0.041 -0.004 -0.034 0.065 0.031 -0.132 0.052 0.063 0.055 1.000 (0.858) (0.953) (0.142) (0.002) (0.772) (0.009) (0.000) (0.017) (0.000) (0.000) (0.000) (0.000)
Table 4: Regression Results – Abnormal Accruals ε BigN b CashFlow b owth IndustryGr b Assets b FirmAge b Tenure b b Accruals 6 5 4 3 2 1 0 + + + + + + + =
Panel A: |ACC| Coefficient and (p-value)
(A) (B) (C) (D) (E) Intercept 0.1062 0.1051 0.1039 0.0966 0.0982 (0.000) (0.000) (0.000) (0.000) (0.000) GK -0.0003 (0.168) IK -0.0002 (0.276) CS -0.0011 (0.000) FT -0.0015 (0.000) GK – IK -0.0005 (0.187) IK – CS 0.0005 (0.069) CS -0.0020 (0.000) FT – CS -0.0014 (0.000) FirmAge -0.0015 -0.0015 -0.0015 -0.0014 -0.0013 (0.000) (0.000) (0.000) (0.000) (0.000) CFO -0.1828 -0.1828 -0.1831 -0.1817 -0.182 (0.000) (0.000) (0.000) (0.000) (0.000) IndGrw 0.0018 0.0021 0.0002 0.0006 -0.0017 (0.728) (0.686) (0.974) (0.914) (0.741) Assets 0.0009 0.0009 0.0013 0.0021 0.0023 (0.325) (0.335) (0.145) (0.025) (0.017) Big -0.0017 -0.0017 -0.0021 -0.0014 -0.0019 (0.493) (0.500) (0.409) (0.576) (0.453) Adj. R2 0.1257 0.1256 0.1291 0.1308 0.1325 #Obs. 5,814 5,814 5,814 5,814 5,814
Panel B: Positive ACC Coefficient and (p-value) (by truncated regression model) (A) (B) (C) (D) (E) Intercept -0.5895 -0.6064 -0.6460 -0.7161 -0.7078 (0.002) (0.001) (0.001) (0.000) (0.000) GK -0.0037 (0.128) IK -0.0039 (0.121) CS -0.0142 (0.000) FT -0.0248 (0.000) GK – IK -0.0049 (0.280) IK – CS 0.0030 (0.320) CS -0.0297 (0.000) FT – CS -0.0226 (0.000) FirmAge -0.0156 -0.0156 -0.0150 -0.0133 -0.0129 (0.000) (0.000) (0.000) (0.000) (0.000) CFO -0.7211 -0.7226 -0.7328 -0.7176 -0.7212 (0.000) (0.000) (0.000) (0.000) (0.000) IndGrw 0.0779 0.0810 0.0747 0.0581 0.0509 (0.130) (0.115) (0.160) (0.283) (0.357) Assets 0.0345 0.0350 0.0398 0.0516 0.0525 (0.002) (0.002) (0.000) (0.000) (0.000) Big -0.1103 -0.1093 -0.1169 -0.1080 -0.1150 (0.000) (0.000) (0.000) (0.000) (0.000) #Obs. 2,919 2,919 2,919 2,919 2,919
Table 4: Panel C: Negative ACC Coefficient and (p-value) (A) (B) (C) (D) (E) Intercept -1.0756 -1.0460 -1.0005 0.9542 -0.9499 (0.016) (0.017) (0.016) (0.023) (0.019) GK 0.0071 (0.218) IK 0.0072 (0.226) CS 0.0236 (0.017) FT 0.0162 (0.057) GK – IK 0.0041 (0.659) IK – CS -0.0044 (0.478) CS 0.0301 (0.017) FT – CS 0.0107 (0.152) FirmAge 0.0191 0.0192 0.0176 00.0172 0.0161 (0.005) (0.005) (0.004) (0.005) (0.004) CFO -2.2337 -2.2335 -2.1670 -2.1818 -2.1268 (0.001) (0.001) (0.001) (0.001) (0.001) IndGrw 0.1536 0.1438 -0.1760 0.1501 0.1859 (0.286) (0.312) (0.215) (0.288) (0.192) Assets 0.1202 0.1197 0.1078 0.1092 0.1001 (0.006) (0.006) (0.005) (0.007) (0.007) Big -0.0140 -0.0155 -0.0037 -0.0213 -0.0067 (0.841) (0.824) (0.956) (0.757) (0.919) #Obs. 2,895 2,895 2,895 2,895 2,895
Table 5: A Further Analysis on Abnormal Accruals for the sample with FT = 1. Tenure = GK Tenure = IK
|ACC| Pos. ACC Neg. ACC |ACC| Pos. ACC Neg. ACC Intercept -0.0308 -2.8992 -0.1511 -0.0397 -2.8812 -0.0052 (0.717) (0.050) (0.813) (0.639) (0.052) (0.994) Tenure -0.0012 0.0055 0.0120 0.0001 0.0086 -0.0016 (0.297) (0.678) (0.239) (0.919) (0.517) (0.860) Age -0.0013 -0.0039 0.0111 -0.0013 -0.0045 0.0121 (0.039) (0.520) (0.098) (0.035) (0.455) (0.100) CFO -0.2476 -1.0180 -0.0766 -0.2502 -1.0339 -0.0156 (0.000) (0.001) (0.852) (0.000) (0.001) (0.971) IndGrw 0.0545 0.8239 0.2975 0.0549 0.8536 0.3015 (0.080) (0.020) (0.308) (0.079) (0.022) (0.328) Size 0.0091 0.0965 -0.0240 0.0089 0.0934 -0.0266 (0.089) (0.187) (0.532) (0.098) (0.203) (0.508) Big -0.0329 -0.3118 0.2070 -0.0333 -0.3152 0.2262 (0.009) (0.066) (0.101) (0.009) (0.063) (0.102) #Obs. 327 137 190 327 137 190
Table 6: Regression Results – Cost of Debt (mean of COD = 4.8117) ε IntCov b ROA b σ(NIBE) b Leverage b Size b RankAQ b Tenure b b COD 7 6 5 4 3 2 i 1 0 + + + + + + + + = (A) (B) (C) (D) (E) Intercept 0.7540 0.7725 1.2707 0.4203 1.4206 (0.252) (0.239) (0.045) (0.510) (0.017) GK 0.0050 (0.585) IK 0.0057 (0.547) CS 0.1340 (0.000) FT -0.1253 (0.000) GK – IK -0.0435 (0.005) IK – CS -0.1007 (0.000) CS -0.0308 (0.014) FT – CS -0.1610 (0.000) AQ 0.0979 0.0974 0.0982 0.0704 0.0630 (0.000) (0.000) (0.000) (0.000) (0.000) Size 0.2818 0.2809 0.1815 0.4201 0.3381 (0.000) (0.000) (0.000) (0.000) (0.000) Leverage -2.3939 -2.3792 -1.5950 -2.9740 -2.0687 (0.000) (0.000) (0.000) (0.000) (0.000) σ(NIBE) -3.8530 -3.8680 -2.2254 -5.0679 -2.9836 (0.018) (0.017) (0.155) (0.001) (0.041) ROA -4.8465 -4.8468 -4.4307 -5.4725 -4.9940 (0.000) (0.000) (0.000) (0.000) (0.000) IntCov -0.0001 -0.0001 -0.0001 -0.0001 -0.0000 (0.063) (0.064) (0.146) (0.103) (0.653) #Obs. 2,449 2,449 2,449 2,449 2,449 Adj. R2 0.0536 0.0536 0.1210 0.1097 0.2388 Variables Definition:
COD = current period’s cost of borrowing from banks;
RankAQ = using each firm’s rolling ten year windows to regress current accruals (divided by total assets) on lagged, current and future cash flows from operations (divided by total assets), then, gauging the ten firm- and year-specific residuals to calculate the standard deviation of the firm’s estimated residuals, finally, deciles it into the range of one to ten;
Leverage = interest-bearing debt to total assets;
σ(NIBE) = rolling 10-year standard deviation of individual firm’s net income before extraordinary item, scaled by total assets ;
ROA = return on assets;
Table 7: A Further Analysis on Cost of Debt for the sample with FT = 1. ε IntCov b ROA b σ(NIBE) b Leverage b Size b RankAQ b Tenure b b COD 7 6 5 4 3 2 i 1 0 + + + + + + + + =
General Knowledge Industry-Specific Knowledge
Intercept -3.2794 -2.5468 (0.252) (0.382) GK 0.0408 (0.294) IK -0.0106 (0.780) RankAQ 0.1423 0.1419 (0.094) (0.097) Size 0.5689 0.5550 (0.002) (0.003) Leverage -5.8359 -5.7127 (0.000) (0.001) σ(NIBE) -3.2345 -3.5805 (0.636) (0.604) ROA -3.9852 -3.8255 (0.020) (0.026) IntCov -0.0177 -0.0182 (0.043) (0.039) #Obs. 118 118 Adj. R2 0.1931 0.1855
Table 8: Analysis on Perceived Audit Quality e Leverage b Size b Beta b Volatility b e Persistenc b Growth b FirmAge b ΔETenure b ETenure b Tenure b ELoss b Loss b ΔE b E b b CAR 14 13 12 11 10 9 8 7 6 5 4 3 2 1 0 + + + + + + + + + + + + + + + = (A) (B) (C) (D) (E) (F) (G) Constant b0 -0.2070 -0.0706 0.0509 -0.0401 -0.0751 -0.0992 -0.1141 (0.326) (0.743) (0.813) (0.852) (0.727) (0.647) (0.598) E b1 0.1213 1.6172 2.2529 2.1725 1.9307 2.0348 2.6835 (0.054) (0.000) (0.000) (0.000) (0.000) (0.000) (0.000) ΔE b2 0.0672 -0.0512 -0.9883 -0.7032 -0.6333 -0.7871 -1.3939 (0.595) (0.684) (0.014) (0.055) (0.007) (0.030) (0.009) Loss b3 -0.1726 -0.1628 -0.1595 -0.1672 -0.1616 -0.1480 (0.000) (0.001) (0.001) (0.000) (0.001) (0.002) Loss × E b4 -1.5598 -1.5581 -1.5450 -1.6011 -1.7374 -1.8108 (0.000) (0.000) (0.000) (0.000) (0.000) (0.000) GK b5 -0.0032 (0.323) GK × E b6 -0.0475 (0.004) GK ×ΔE b7 0.0704 (0.019) IK b8 -0.0021 (0.500) IK × E b9 -0.0494 (0.006) IK ×ΔE b10 0.0549 (0.115) CS b11 -0.0106 (0.001) CS × E b12 -0.0419 (0.002) CS ×ΔE b13 0.0887 (0.004) FT b14 0.0004 (0.918) FT × E b15 -0.0206 (0.115) FT × ΔE b16 0.0626 (0.030) (GK – IK) b17 -0.0038 (0.534) (GK – IK) × E b18 -0.0310 (0.360) (GK – IK) × ΔE b19 0.0822 (0.247) (IK – CS) b20 0.0064 (0.125) (IK – CS) × E b21 -0.0351 (0.111)
(IK – CS) × ΔE b22 0.0009 (0.983) CS b23 -0.0073 (0.137) CS × E b24 -0.0722 (0.001) CS × ΔE b25 0.1182 (0.009) (FT – CS) b26 0.0016 (0.682) (FT – CS) × E b27 -0.0128 (0.345) (FT – CS) ×ΔE b28 0.0382 (0.213) Age b29 -0.0044 -0.0041 -0.0040 -0.0041 -0.0035 -0.0041 -0.0031 (0.009) (0.012) (0.018) (0.013) (0.036) (0.016) (0.065) Big b30 -0.0346 -0.0379 -0.0353 -0.0376 -0.0403 -0.0388 -0.0358 (0.395) (0.345) (0.340) (0.349) (0.314) (0.334) (0.371) Growth b31 0.2532 0.2431 0.2435 0.2448 0.2426 0.2437 0.2495 (0.000) (0.000) (0.000) (0.000) (0.000) (0.000) (0.000) Persistence b32 0.2295 0.2403 0.2451 0.2286 0.2590 0.2397 0.2615 (0.000) (0.000) (0.000) (0.000) (0.000) (0.000) (0.000) Volatility b33 0.0000 0.0000 0.0000 0.0000 0.0000 0.0000 0.0000 (0.155) (0.394) (0.376) (0.323) (0.353) (0.408) (0.391) Beta b34 0.0227 0.1155 0.1157 0.1186 0.0955 0.1210 0.0799 (0.732) (0.082) (0.081) (0.074) (0.150) (0.068) (0.233) Size b35 -0.0223 -0.0393 -0.0390 -0.0410 -0.0347 -0.0388 -0.0373 (0.156) (0.013) (0.015) (0.010) (0.029) (0.015) (0.021) Leverage b36 0.3658 0.4372 0.4422 0.4586 0.4123 0.4344 0.4356 (0.001) (0.000) (0.000) (0.000) (0.000) (0.000) (0.000) No (Obs.) 2,308 2,308 2,308 2,308 2,308 2,308 2,308 Adj. R2 0.0588 0.0841 0.0867 0.0870 0.0922 0.0849 0.0954 Joint Testing b1 + b2 (for earnings) 0.1885 1.5660 1.2646 1.4693 1.2974 1.2477 1.2896 (0.030) (0.000) (0.001) (0.000) (0.000) (0.000) (0.004) b6 + b7 (for GK) 0.0229 (0.204) b9 + b10 (for IK) 0.0055 (0.802) b12 + b13 (for CS) 0.0469 (0.025) b15 + b16 (for FT) 0.0420 (0.024) b18 + b19 (for GK – IK) 0.0512 (0.262) b21 + b22 (for IK –CIK) -0.0342 (0.233) b24 + b25 (for CS) 0.046 (0.123) b27 + b28 (for FT – CS) 0.0254 (0.206)
Variables Definitions:
CAR = cumulative value-weighted market-adjusted abnormal returns over 16 months from January; E = income from continuing operations of year t, scaled by the market value of equity at the beginning of
year t;
ΔE = The difference between income before extraordinary items deflated by market value of equity the beginning of the year;
Loss = A dummy variable equal to 1 if E < 0, and equal to 0 otherwise; ELoss = E × Loss, the interaction between E and Loss;
Tenure = various tenure, GK, IK, CS, and FT, traced back to 1983; ETenure = E × Tenure, the interaction between E and Tenure; ΔETenure = ΔE × Tenure, the interaction between ΔE and Tenure;
FirmAge = the number years that the firm is setup;
Growth = the sum of the market value of equity and the book value of debt scaled by the book value of total assets;
Persistence = the first-order autocorrelation of income before extraordinary items per share for the past 16 quarters; Volatility = the standard deviation of income before extraordinary items per share for the past 16 quarters;
Beta = the systematic risk computed using the past 36 monthly stock returns;
Size = the logarithmic transformation of the beginning-of-year market value of equity; and Leverage = the ratio of total debt to total assets.
Table 9: A Further Analysis on Perceived Audit Quality for the sample with FT = 1.
General Knowledge Industry Specific Knowledge
Constant b0 -2.1461 -2.1906 (0.129) (0.132) E b1 -0.1063 0.5754 (0.974) (0.859) ΔE b2 0.6230 0.3760 (0.309) (0.424) Loss b3 -0.5305 -0.4963 (0.175) (0.205) Loss × E b4 -0.2713 -0.8255 (0.934) (0.801) GK b5 0.0069 (0.758) GK × E b6 0.0446 (0.225) GK ×ΔE b7 -0.0761 (0.385) IK b8 0.0024 (0.920) IK × E b9 0.0383 (0.278) IK ×ΔE b10 -0.0563 (0.483) Age b29 -0.0033 -0.0029 (0.762) (0.797) Big b30 0.1469 0.2151 (0.622) (0.471) Growth b31 0.0816 0.0345 (0.823) (0.925) Persistence b32 0.1303 0.1322 (0.678) (0.678) Volatility b33 -0.0003 -0.0002 (0.167) (0.213) Beta b34 -0.2711 -0.3271 (0.559) (0.484) Size b35 0.1362 0.1455 (0.167) (0.147) Leverage b36 1.3018 1.1471 (0.152) (0.194) No (Obs.) 83 83 Adj. R2 0.0286 0.0245 Joint Testing b1 + b2 (for earnings) 0.5167 0.9514 (0.874) (0.772) b6 + b7 (for GK) -0.0315 (0.579) b9 + b10 (for IK) -0.0180 (0.729)