Characterization of
gS-Crystallin Isoforms from a Catfish:
Evolutionary Comparison of Various
g-, gS-,
and
b-Crystallins
1
Shyh-Horng Chiou,*
,†
,2Fu-Ming Pan,† Hsuan-Wan Peng,*
Yen-Kai Chao,* and Wen-Chang Chang*
,†
*Institute of Biochemical Sciences, National Taiwan University and †Institute of Biological Chemistry,
P.O. Box 23-106, Academia Sinica, Taipei, Taiwan
Received August 3, 1998
gS-Crystallin from catfish eye lenses, formerly
des-ignatedbs-crystallin in mammalian lenses, is struc-turally characterized in this study by cDNA cloning and sequencing. To facilitate sequence characteriza-tion ofgS-crystallin with structural properties lying between b- and g-crystallins, a cDNA mixture was constructed from the poly(A)1mRNA isolated from catfish eye lenses, and amplification by polymerase chain reaction (PCR) was carried out to obtain nu-cleotide segments encoding multiple gS-crystallin isoforms. Sequencing several positive clones re-vealed that at least two distinct isoforms exist in the
gS-crystallin class of this teleostean fish, similar to
the authentic g-crystallin family characterized pre-viously in species of the piscine class. Comparison of protein sequences encoded by two representative catfish gS1 and gS2 cDNAs with the published se-quences ofb-, g-, and gS-crystallins from shark, carp, bullfrog, bovine, and human lenses indicates that there is about 20 –50% sequence homology between catfish gS-crystallins and various members of the related b/g-crystallin superfamily from different evolutionary classes, with a higher sequence simi-larity being found between catfishgS- and mamma-lian g-crystallins than between catfish gS- and bo-vine or carp gS-crystallins. Phylogenetic trees constructed on the basis of the nucleotide and pro-tein sequence divergence among variousb-, g-, and
gS-crystallins corroborate the closer relatedness of
catfish gS- to authentic g-crystallin than to bovine and carpgS-crystallins. The results suggest that evo-lution of catfish gS-crystallins follows a different path from that of bovine and carpgS-crystallins and may represent a more ancient offshoot from the
an-cestral g/gS coding gene than carp and bovine
gS-crystallins. © 1998 Academic Press
Fish represents the oldest and most diverse group of
vertebrates (1,2). The modern fishes comprise two
ma-jor classes of piscine species, i.e. Osteichthyes or
te-leostean (bony) fishes, and Chondrichthyes or
cartilag-inous fishes (sharks and skates). The study of lens
crystallins from the piscine class is of special interest
from the evolutionary point of view because they
con-stitute the early protein forms of vertebrates and are
thought to have been ancestral to those of land
verte-brates. It is especially noteworthy that the abundant
presence of various common and specific classes of
structurally conserved proteins (crystallins) in eye
lenses of different species of vertebrates constitutes a
good model system to unravel the complex process of
evolution in structurally homologous proteins (3-5).
Most previous studies on the characterization of
crystallins were concerned with various species of
higher vertebrates with relatively fewer reports on the
lens crystallins from lower aquatic vertebrates, i.e.
var-ied classes of fish. In this report we characterize two
major
gS-crystallin isoforms with structural properties
lying between the well-known
b- and g-crystallins.
This class of crystallin, formerly called
bS and now
renamed
gS crystallin (6,7), exists as a monomeric
protein which is similar to the major authentic
g-crystallins. However unlike g-crystallins which
pos-sess a free N-terminal amino-acid residue,
gS-crystallin has a blocked amino terminus as most
mem-bers of
b-crystallin family.
In this report we have for the first time cloned and
sequenced
gS-crystallins from one teleostean species,
i.e. the catfish, which is commonly raised in local
fresh-water aquacultures of Taiwan. Most catfishes are
mostly nocturnal scavengers with atrophied eyes,
cast-1The sequence data for the cDNAs of catfishgS-crystallins have been deposited with the EMBL Data Library under the Accession Nos. X81458 and X81459 forgS1 and gS2, respectively.
2To whom correspondence should be addressed. Fax: (886)-2-23635038. E-mail: [email protected].
ARTICLE NO. RC989657
412 0006-291X/98 $25.00
ing some great interest to study the evolutionary
ef-fects of atrophied eye lenses on the constituting
lens-specific crystallins and their corresponding genes. The
characterization of catfish crystallins would be of
spe-cial interest to us in light of the recent elucidation of
the complete sequences of
g-crystallins from several
species of teleostean fishes (8-10) and
gS-crystallins
from the cartilaginous fish of shark (11). We have
am-plified cDNAs constructed from the lenses of catfishes
using PCR methodology to aid in the structural
anal-ysis of multiple isoforms of
gS-crystallins.
MATERIALS AND METHODS
Catfish classification and description. Catfish (Clarias batra-chus), one species of the common edible fishes, belongs to one of the teleostean fishes of the order or suborder Nematognathi (or Siluroi-dei). Most of catfishes are nocturnal scavengers and inhabit under fresh water. It is characterized by barbels around the mouth and has a very small atrophied eye lens as compared to that of bony fishes such as common carps. It spends some of its life cycle under the mud all-year around. The catfish of Southeast Asia such as the species studied here is sometimes called “walking catfish” due to its ability of moving across land (between bodies of water) by a slithering motion combined with a thrashing of its tail.
Isolation of mRNA from catfish lenses. The walking catfishes of less than 1-year-old were obtained from a local aquarium shop under a special contract for scientific research. Lenses were removed and stored in liquid-nitrogen container immediately after they were dis-sected and before the processing for mRNA isolation. Two deep-frozen lenses from one catfish were homogenized and RNA was extracted according to the standard cloning manual of Maniatis et al. (12). To obtain a full-length crystallin cDNA, poly(A)1RNA was purified using QuickPrep mRNA preparation kit (Pharmacia, Upp-sala, Sweden) and then subjected to the synthesis of cDNA mixture by cDNA Synthesis System/Plus kit (Amersham, England).
PCR amplification, cloning, and sequencing ofgS-crystallin iso-forms. Two oligonucleotide primers of sense and antisense orienta-tions, covering 59- and 39-nucleotide coding regions for N- and C-terminal 4-6 amino-acid segments of the previously determined cDNA sequence for one carp gS-crystallin (13), with the forward sequence, 59-CATGGGCAAG(A/G)TCA(T/C)CTT(C/T)-39 (19-mer) and the reverse sequence, 59-CATCACGCCA(T/C)(C/A)ATGCG-39 (17-mer) (with slant lines indicating use of degenerate codons in the primers) were synthesized. The conditions for PCR reactions were similar to the previous reports for cDNA amplification of teleostean and shark lenses (9-11), i.e. subjecting to 40 cycles of heat denatur-ation at 94 °C for 2.5 min, annealing the primers to the DNAs at 48 °C for 1 min and 20 sec and running DNA chain extension with Taq polymerase at 72 °C for 3 min, followed by a final extension at 72 °C for 10 min. Products were treated with Klenow Fragment and T4 polynucleotide kinase, and separated on a 1.2 % agarose gel and electroeluted according to standard procedures. The DNA fragments were subcloned into pUC18 previously digested with SmaI/BAP, and then transformed into E. coli strain JM 109. Plasmids purified from positive clones were prepared for nucleotide sequencing by dideoxynucleotide chain-termination method (14). The DNA se-quences were determined by automatic fluorescence-based ing of templates amplified by PCR using model 373A DNA sequenc-ing System (Applied Biosystems Inc., CA, USA) with a Taq DyeDeoxy terminator cycle sequencing kit (Applied Biosystems Inc.). Sequence comparison of catfishgS-crystallins and other crystal-lins. A commercially available software (DNASTAR Inc., Madison, WI, U.S.A.) was used for the estimation of DNA and protein sequence homology based on percent sequence identity (9).
Hydropathy profile analysis. A computer-based program analysis of the overall surface distribution of hydrophilic amino acids in five gS- and g-crystallins, based on the Kyte-Doolittle hydropathy scale (15) was performed using the MacVector sequence analysis software (International Biotechnologies, Inc., New Haven, CT). The signs of the values have been reversed in order to plot the hydrophilicity instead of hydrophobicity profile. A window of size N57 was run along the amino-acid sequence length of each crystallin; for each window, the hydropathy values of the 7 amino acids were summed and divided by 7 to obtain the average hydrophilicity per residue for the window. Values above the axis denote hydrophilic regions which may be exposed on the outside of the protein molecule whereas those values below the axis indicate hydrophobic regions which tend to be buried inside the protein.
Construction of a phylogenetic tree forb-, g-, and gS-crystallins. A software package of LaserGene for the Apple Macintosh computer from DNASTAR, Inc. was used for the estimation of sequence ho-mology based on percent similarity and divergence among different cDNA and protein sequences ofb-, g- and gS-crystallins. Percent divergence is calculated by comparing sequence pairs in relation to the phylogenetic tree. On the other hand the percent similarity is estimated by comparing sequences directly without accounting for phylogenetic relationships. Phylogenetic tree was then constructed using the algorithm of Hein (16), which was included in the MegAlign programs of the package. It is a multiple-sequence align-ment program that builds trees as it aligns DNA or protein se-quences using a combination of distance matrix and approximate parsimony methods. This method constructs multiple-alignment by imposing restrictions based on evolutionary relatedness of the aligned sequences, which is useful to align highly evolved gene families that have clear evolutionary relationships.
RESULTS AND DISCUSSION
Understanding the mechanism for the evolution of
functionally related proteins from different species
re-mains a major theme of current research in protein
chemistry and molecular biology. The structural and
genetic basis for the generation of multiple
gS-crystallin isoforms in the shark lens (11) contrasting
with only one
gS-crystallin found in most mammalian
class is of significant interest, which provides the
mo-tivation to study and compare the primary structure of
this unique crystallin class from one teleostean fish we
previously characterized (10), i.e. catfish. Especially
noteworthy is our recent findings that catfishes with
atrophied eye lenses appear to possess several mutated
or different crystallin isoforms from the homologous
crystallin class found in varied species of the
mamma-lian class. Therefore a more extensive characterization
from an evolutionarily or developmentally unique
an-imal species such as the catfish presented here may
eventually provide some insight into the phenomenon
of species diversification and the accompanying
molec-ular origin of various crystallins.
Characterization of
gS-Crystallins from a Catfish
of the Teleostean Class
Previous studies have suggested the distinct difference
in structural characteristics between shark
g-crystallin
(17,18) and those homologous crystallins obtained from
Vol. 252, No. 2, 1998 BIOCHEMICAL AND BIOPHYSICAL RESEARCH COMMUNICATIONS
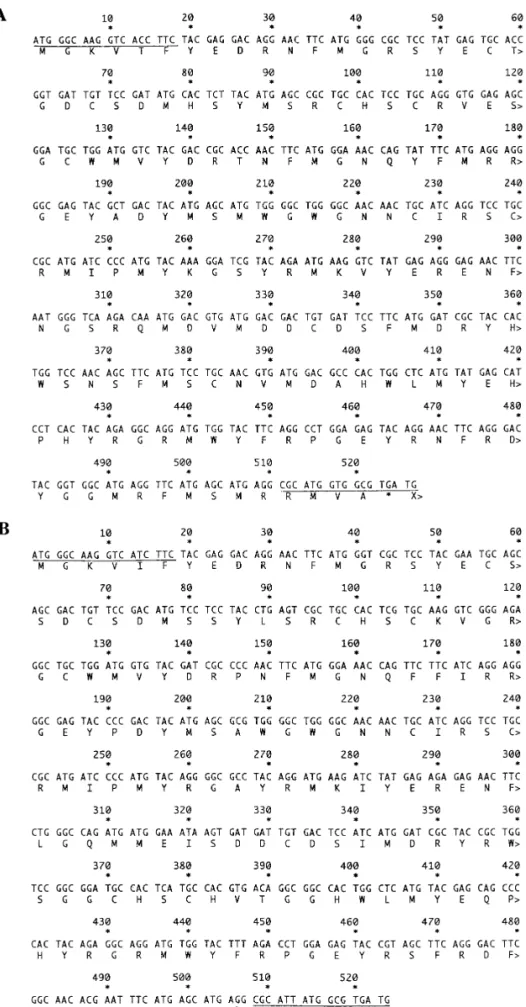
FIG. 1. Nucleotide and deduced protein sequences of catfishgS-1 (A) and catfish gS-2 (B) crystallins. In (A) the nucleotide sequence of 527 bp is shown above the amino acid sequence of 174 residues, including the translation initiation methionine. In (B) the nucleotide sequence comprises 524 bp encoding a protein sequence of 173 amino acids. Asterisks (*) are indicated in every 10-nt segment for easy tracing of sequence contents. Amino acids are denoted by one-letter symbols. The 59 and 39 nucleotide segments used as primers for PCR reactions are underlined.
lenses of teleostean fishes such as carp (8,13). The
struc-tural analysis of shark cDNAs encoding
g-crystallins by
means of PCR technique has also revealed two cDNAs
encoding two
g-crystallins supposedly to be uniquely
ex-pressed only in teleostean or mammalian classes alone
(19). Especially interesting is the finding that the amino
acid compositions of
g-crystallins seem to lack the unique
characteristic of high methionine content (
. 10%) as
commonly observed for that of teleostean fishes (9,10).
Shark
g-crystallin showed a much more complex pattern
in the multiplicity of isoforms (17,20) than that of
te-leostean crystallins. Similarly
gS-crystallin of shark lens
was also found to be present in multiple isoforms (11).
We question whether such multiplicity of isoforms for
shark
gS-crystallin may be also present in catfish lenses,
which is a favored species for us to study the evolutionary
effects of atrophied eye lenses on their lens-specific
crys-tallin gene expression. We have hence used the recent
rapid method of cloning and sequencing by means of PCR
methodology for the determination of cDNA sequences of
catfish
gS-crystallin(s). PCR amplification of total lens
cDNA mixtures prepared from lenses of at least five
cat-fishes with the designed and degenerate primers based
on partial DNA coding sequences of carp
gS-crystallin
(13) achieved the isolation of one major PCR fragment
corresponding to the complete open reading frame
encod-ing
gS-crystallin isoforms from catfish lenses. The size
determination of PCR-amplified cDNA coding for
gS
crys-tallin was estimated to be about 520 bp, similar to that of
shark
gS-crystallin and in agreement with protein
spe-cies of about 170-180 amino-acid residues for mammalian
g- and gS-crystallins.
Sequence Analysis of cDNA Encoding Catfish
gS-Crystallins
Several positive clones have been identified, with
their 5
9 and 39 nucleotide sequences being determined
to be essentially identical to those predicted by
degen-erate primers, indicative of the existence of multiple
isoforms for catfish
gS-crystallin, which is similar to
shark and in contrast to bovine (6,7) and human (21)
gS-crystallins with only one sequence being identified.
The deduced protein sequences together with their
ge-netic coding sequences of two clones, designated as
catfish
gS-1 and gS-2 are shown in Fig. 1A and 1B.
The cDNA sequences encoding catfish
gS-1 and gS-2
were both found to consist of 522 and 519 nucleotides
respectively, each of which covering a full-length
pro-tein of 174 and 173 amino-acid residues including the
initiating methionine. They are close to carp
gS (174
a.a.) and slightly lower than bovine
gS (177 a.a.). In
order to avoid sequencing errors, sequence accuracy
was doubly checked and confirmed by automatic
fluorescence-based DNA sequencing technique. The
only uncertainty may lie in the first and last few
nu-cleotides present in the 5
9 and 39 region of the PCR
fragment even though we have used some degenerate
codons in the primers. Recently we have used 3
9- and
5
9-RACE (Rapid Amplification of cDNA Ends) protocols
of PCR to further validate these ambiguous short
seg-ments with comfort and gratification.
Sequence Alignment and Comparison of
b-, g-, and
gS-Crystallins
In the pair-wise sequence homology comparison of
various nucleotide (Fig. 2A) and deduced amino-acid
sequences (Fig. 2B) from species of different classes
using commercial software package (DNASTAR
pro-gram), it is found that catfish
gS-1 and gS-2 crystallins
show 50-53% and 41-47% DNA and protein sequence
homology
to
bovine
gII crystallins respectively
whereas only 44-45% and 30-35% DNA and protein
sequence homology respectively are found between
cat-fish and bovine
gS-crystallins, indicating that catfish
gS is evolutionarily more related to authentic
mamma-lian
g- than gS-crystallins and may represent an
“off-shoot” crystallin form from the divergent evolution of
ancient
g-crystallin gene family. On the other hand, it
FIG. 2. Pair-wise comparison of nucleotide (A) and protein (B) sequence homology between two catfishgS-crystallins and various b-, g-, andgS-crystallins from species of different vertebrate classes. Analysis of sequence homology was carried out using the software package (DNASTAR Inc., Madison, WI) on the published sequences of carpgS (13), bovine gS (6), bullfrog b2 (28), bovine b2 (30), bovine gII (31), and humang5 (32) crystallins.
Vol. 252, No. 2, 1998 BIOCHEMICAL AND BIOPHYSICAL RESEARCH COMMUNICATIONS
is of surprise to find that catfish
gS-crystallins show
only 44-48% and 35-38% DNA and protein sequence
homology to carp
gS respectively, underlining the
dis-tinct differences of
gS-crystallins present in these two
teleostean
fishes.
Contradictorily,
catfish
gS-crystallins show a higher sequence homology to shark
than carp
gS-crystallins.
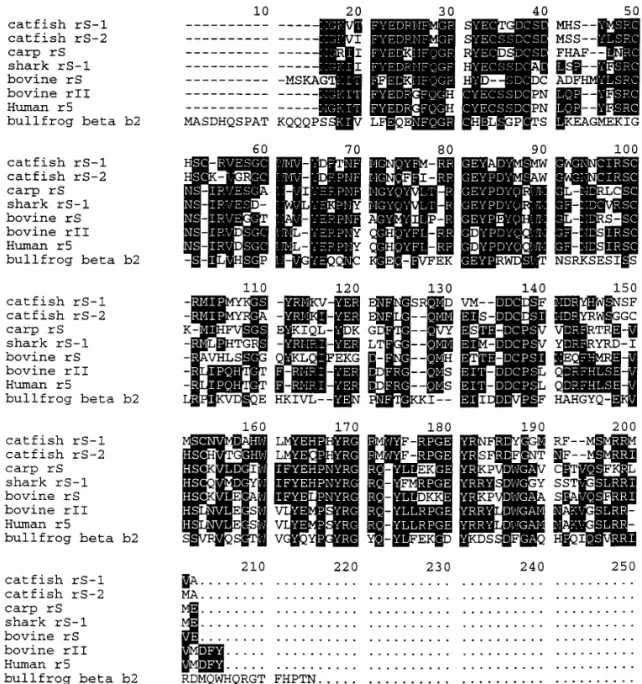
Figure 3 aligns eight sequences encompassing
rep-resentative
b-, g- and gS-crystallins from published
crystallin sequences of the major classes in
verte-brates. It is noteworthy that there is only about 20-48%
sequence identity between catfish
gS crystallins and
structurally related
b-, g- and gS-crystallins from
dif-ferent evolutionary classes. However one salient
fea-ture is that some of the key residues (such as Tyr-6,
Glu-7, Phe-11, Gly-13 and Ser-34 based on bovine
gII
sequence numbering) for the maintenance of stability
in
g-crystallins (22-24) are mostly retained and
con-served in all
b-, g- and gS-sequences even from species
of distantly related classes, attesting to the
conserva-tive structural aspects of
b/g superfamily. It is also of
interest to find that N- and C-terminal regions of these
crystallins are more conserved than the middle regions
of the sequences (residues 70-130).
Hydropathy Profile Comparison of
g- and
gS-Crystallins
In Fig. 4 the hydropathy profiles for three
gS-crystallins and one authentic
gII crystallin from catfish
FIG. 3. Multiple sequence alignment and comparison of eight crystallin sequences from species of different vertebrate classes. Identical amino acid residues among various sequences based on the first one (catfishgS-1) are expressed in white letters against black background blocks. The gaps were introduced for optimal alignment and maximum homology for the aligned sequences. Note that the middle region (residues 70 –130 based on bovinegII sequence numbering) shows a greater sequence variation than the N- and C-terminal regions among the compared sequences. Amino acid residues are denoted by one-letter symbols.
and calf are aligned jointly for structural comparison.
It is noteworthy that the overall hydropathy profiles
along the full length of primary sequences for catfish
gS-1 and gS-2 crystallins (Fig. 4A, 4B) are very similar,
which are also fairly similar to that of bovine
gII (Fig.
4C) and in great contrast with the dissimilar pattern
for bovine
gS-crystallin (Fig. 4D). These profiles
exem-plify very similar surface distributions of hydrophilic
amino-acids in the two catfish
gS-1 and gS-2
crystal-lins and may suggest a resemblance in the secondary
structure between the two crystallins. It appears that
distinct difference found in the distribution of polar or
hydrophobic amino-acid residues is somewhat greater
between catfish
gS and bovine gS than that of catfish
gS and bovine gII crystallins, which is also reflective of
the difference found in the pair-wise comparison of
sequence homology between these crystallins.
Construction of Phylogenetic Trees
In our systematic pair-wise sequence comparison of
crystallin genes and their deduced protein sequences
from varied species of vertebrates, higher sequence
homology is generally found between cDNA sequences
than their deduced protein sequences. Two
phyloge-netic trees based on nucleotide (Fig. 5A) or protein
(Fig. 5B) sequence alignment of eight
b-, g- and
gS-crystallins are constructed using a combination of
dis-FIG. 4. Hydropathy profile prediction patterns of catfishgS-1 (A), catfish gS-2 (B), bovine gII (C), and bovine gS (D) crystallins based on primary amino acid sequences. The analysis of the distribution of surface hydrophilicity along each full sequence was based on the method of Kyte and Doolittle (15). It is noteworthy that the patterns for two catfishgS-crystallins and bovine gII are very similar, while that of bovine gS shows a distinct difference from the other three at the N-terminal region (residues 1–40) and the middle region (residues 90–120).
Vol. 252, No. 2, 1998 BIOCHEMICAL AND BIOPHYSICAL RESEARCH COMMUNICATIONS
tance matrix and approximate parsimony methods
(16). Similar to our previous phylogenetic analysis of
various crystallins from invertebrate and vertebrate
species (25-29), the overall patterns of the mutual
phy-logenetic interrelationship among these crystallins are
fairly similar, attesting to the general applicability of
the tree construction based on cDNA or protein
se-quence comparison. However detection of sese-quence
di-vergence based on protein sequences rather than
cDNA sequences appears be more sensitive when
com-paring highly homologous protein families such as
b/g
crystallins shown here. It is noteworthy that the
phy-logenetic tree based on the sequence divergence among
these protein sequences indeed exemplifies the close
relatedness of catfish and shark
gS-crystallins to
g-crystallins from bovine and human lenses. On the
other hand, carp
gS-crystallin is grouped with bovine
gS-crystallin, in agreement with the percent homology
shown in Fig. 2. Especially notable is the observation
that
b2-crystallin sequence from bullfrog is correctly
placed at a different branching point of the tree from
that of
g- and gS-crystallins, indicative of two distinct
evolutionary pathways leading to
b- and g/gS
crystal-lins from the ancestral
b/g protein family.
CONCLUSION
The abundant presence of various common and
spe-cific classes of structural proteins, i.e. lens crystallins,
in different species of vertebrates constitutes a good
model system to unravel the complex process of
evolu-tion in structurally homologous proteins (3-5).
Exten-sive protein and cDNA sequence data on various lens
crystallins have been obtained from various species of
vertebrates, allowing evolutionary relationships of
these highly evolved and related crystallin families to
be derived. The present sequence characterization of
catfish
gS crystallins and phylogenetic comparison of
various
b-, g- and gS-crystallins suggest that evolution
of catfish
gS-crystallins follows a different path from
that of bovine and carp
gS crystallins and may
repre-sent a more ancient offshoot from the ancestral
g/gS
gene than carp /bovine
gS-crystallins.
ACKNOWLEDGMENTS
This work was supported by Academia Sinica and the National Science Council (NSC Grants 83-0203-B-001-086, 83-0418-B-001-020BA, 84-2311-B-001-050-BA, and 86-2311-B-002-031-B15), Taipei, Taiwan.
REFERENCES
1. Keeton, W. T. (1972) in Biological Science, 2nd ed., W. W. Norton & Company, New York.
2. Powers, D. A. (1989) Science 246, 352–358.
3. de Jong, W. W. (1981) in Molecular and Cellular Biology of the Eye Lens (Bloemendal, H., Ed.), pp. 221–278, John Wiley & Sons, New York.
4. de Jong, W. W., and Hendriks, W. (1986) J. Mol. Evol. 24, 121–129.
5. Chiou, S.-H. (1986) FEBS Lett. 201, 69 –73.
FIG. 5. Construction of phylogenetic trees of eight b-, g-, and gS-crystallins from species of different vertebrate classes based on nucleotide (A) and protein (B) sequences. Analysis of sequence data was carried out using the software package LaserGene on an Apple Macintosh computer (DNASTAR Inc., Madison, WI). Percentage divergence is calculated by comparing sequence pairs in relation to the relative positions in the phylogenetic tree, in contrast to the percentage similarity, which is estimated by comparing percentage sequence identity directly without accounting for phylogenetic relationships. A phylogenetic tree was then constructed based on the percentage divergence between nucleotide and protein sequences using a combination of distance matrix and approximate parsimony methods using the phylogeny generation program of Hein (16). This algorithm carries out multiple alignment by imposing restrictions based on evolutionary relatedness of the aligned sequence pairs. The tree was built using the clustal method and weighted residue-weight table. The length of each pair of branches represents the sequence distance between aligned pairs. The scale beneath the tree measures the distance between sequences (in millions of years). The dotted lines shown in (A) illustrate the fact that the sequence distance based on cDNA comparison is not proportional to the scale.
6. Quax-Jeuken, Y., Driessen, H. P. C., Leunissen, J., Quax, W., de Jong, W., and Bloemendal, H. (1985) EMBO J. 4, 2597– 2602.
7. van Rens, G. L. M., Raats, J. M. H., Driessen, H. P. C., Olden-burg, M., Wijnen, J. T., Khan, P. M., de Jong, W. W., and Bloemendal, H. (1989) Gene 78, 225–233.
8. Chang, T., Jiang, Y.-J., Chiou, S.-H., and Chang, W.-C. (1988) Biochim. Biophys. Acta 951, 226 –229.
9. Pan, F.-M., Chang, W.-C., Chao, Y.-K., and Chiou, S.-H. (1994) Biochem. Biophys. Res. Commun. 202, 527–534.
10. Pan, F.-M., Chang, W.-C., Lin, C.-H., Hsu, A.-L., and Chiou, S.-H. (1995) Biochem. Mol. Biol. Int. 35, 725–732.
11. Pan, F.-M., Chuang, M.-H., and Chiou, S.-H. (1997) Biochem. Biophys. Res. Commun. 240, 51–56.
12. Maniatis, T., Fritsch, E. F., and Sambrook, J. (1989) in Molecu-lar Cloning: A Laboratory Manual, Cold Spring Harbor Labora-tory Press, Cold Spring Harbor, NY.
13. Chang, T., and Chang, W.-C. (1987) Biochim. Biophys. Acta 910, 89 –92.
14. Sanger, F., Nicklen, S., and Coulson, A. R. (1977) Proc. Natl. Acad. Sci. USA 74, 5463–5467.
15. Kyte, J., and Doolittle, R. F. (1982) J. Mol. Biol. 157, 105–132. 16. Hein, J. (1990) Methods Enzymol. 183, 626 – 645.
17. Chiou, S.-H. (1989) FEBS Lett. 250, 25–29.
18. Chiou, S.-H., Chen, S.-W., Itoh, T., Kaji, H., and Samejima, T. (1990) FEBS Lett. 275, 111–113.
19. Chuang, M.-H., Pan, F.-M., and Chiou, S.-H. (1997) J. Protein Chem. 16, 299 –307.
20. Siezen, R. J., Hom, C., Kaplan, E. D., Thomson, J. A., and Benedek, G. B. (1988) Exp. Eye Res. 46, 81–93.
21. Smith, J. B., Yang, Z., Lin, P., Zaidi, Z., Abbasi, A., and Russell, P. (1995) Biochem. J. 307, 407– 410.
22. Blundell, T., Lindley, P., Miller, L., Moss, D., Slingsby, C., Tickle, I., Turnell, B., and Wistow, G. (1981) Nature 289, 771– 777.
23. Wistow, G., Turnell, B., Summers, L., Slingsby, C., Moss, D., Miller, L., Lindley, P., and Blundell, T. (1983) J. Mol. Biol. 170, 175–202.
24. Liaw, Y.-C., Chiou, S.-H., Lin, C.-W., Chang, T., and Chang, W.-C. (1992) J. Biochem. 112, 341–345.
25. Chiou, S.-H., Yu, C.-W., Lin, C.-W., Pan, F.-M., Lu, S.-F., Lee, H.-J., and Chang, G.-G. (1995) Biochem. J. 309, 793– 800. 26. Lu, S.-F., Pan, F.-M., and Chiou, S.-H. (1995) Biochem. Biophys.
Res. Commun. 214, 1079 –1088.
27. Lu, S.-F., Pan, F.-M., and Chiou, S.-H. (1995) Biochem. Biophys. Res. Commun. 216, 881– 891.
28. Pan, F.-M., Chang, W.-C., Lu, S.-F., Hsu, A.-L., and Chiou, S.-H. (1995) Biochem. Biophys. Res. Commun. 217, 940 –949. 29. Lu, S.-F., Pan, F.-M., and Chiou, S.-H. (1996) J. Protein Chem.
15, 103–113.
30. Hogg, D., Gorin, M. B., Heinzmann, C., Zollman, S., Mohandas, T. K., Klisak, I. J., Sparkes, R. S., Breitman, M. L., Tsui, L.-C., and Horwitz, J. (1987) Curr. Eye Res. 6, 1335–1341.
31. Bhat, S. P., and Spector, A. (1984) DNA 3, 287–295.
32. Meakin, S. O., Du, R. P., Tsui, L.-C., and Breitman, M. L. (1987) Mol. Cell. Biol. 7, 2671–2679.
Vol. 252, No. 2, 1998 BIOCHEMICAL AND BIOPHYSICAL RESEARCH COMMUNICATIONS