Identified single-nucleotide polymorphisms and haplotypes at 16q22.1 increase diabetic nephropathy risk in Han Chinese population
Li-Na Liao#,1, Ching-Chu Chen#,2,3, Fang-Yang Wu1, Cheng-Chieh Lin4,5, Chwen-Tzuei Chang2, Sharon L.R. Kardia6, Tsai-Chung Li*,7,8, Fuu-Jen Tsai*,3,9,10
1Department of Public Health, College of Public Health, China Medical University, Taichung, Taiwan
2Division of Endocrinology and Metabolism, Department of Medicine, China Medical University Hospital, Taichung, Taiwan
3School of Chinese Medicine, College of Chinese Medicine, China Medical University, Taichung, Taiwan
4Department of Family Medicine, China Medical University Hospital, Taichung, Taiwan 5School of Medicine, College of Medicine, China Medical University, Taichung, Taiwan 6Department of Epidemiology, University of Michigan, Ann Arbor, Michigan, USA
7Graduate Institute of Biostatistics, College of Management, China Medical University, Taichung, Taiwan
8Department of Healthcare Administration, College of Health Science, Asia University, Taichung, Taiwan
9Department of Medical Genetics, Pediatrics and Medical Research, China Medical University Hospital, Taichung, Taiwan
10Department of Biotechnology and Bioinformatics, Asia University, Taichung, Taiwan #Equal contribution as the first author
*Corresponding authors: Fuu-Jen Tsai and Tsai-Chung Li; correspondence to Tsai-Chung Li, China Medical University, No. 91 Hsueh-Shih Road, Taichung, 40402, Taiwan, Tel: 886-4-22053366 ext. 6605, Fax: 886-4-22078539, e-mail: [email protected].
Text: 2,934 words; abstract: 229 words; 40 references; 3 tables; 2 figures. 1 2 3 4 5 6 7 8 9 10 11 12 13 14 15 16 17 18 19 20 21 22 23 24 25 26
Abstract
Objective. Diabetic nephropathy (DN) has become one of the most common causes of end-stage
renal disease (ESRD) in many countries, such as 44.5% in Taiwan. Previous studies have shown that there is a genetic component to ESRD. Studies attempting to determine which genetic variants are related to DN in Han Chinese are limited.
Methods. A case-control study was conducted to identify DN susceptibility variants in Han Chinese
patients with type 2 diabetes. We included 574 unrelated type 2 diabetes patients (217 DN cases and 357 controls), who were genotyped using Illumina HumanHap550-Duo BeadChip. Single-SNP association tests, using an additive-effect disease model, were performed. Haplotype-based association analysis was conducted to detect haplotype effects.
Results. The significant SNPs rs11647932, rs11645214, and rs6499323 located at 16q22.1 under
the additive-effect disease model were associated with an approximately 2-fold increased risk of DN. In haplotype association tests, identified haplotypes located in the chromosome 16q22.1 region (containing ST3GAL2, COG4, SF3B3, and IL34 genes) raised DN risk. The strongest association was found with haplotype H3 (C-C-G) (adjusted OR (95% CI): 1.93 (1.83-2.03), p=5.0610-7), followed
by H7 (A-G-C-C-G) (adjusted OR (95% CI): 1.90 (1.80-2.00), p=8.9110-7).
Conclusions. Our results demonstrate that the novel SNPs and haplotypes located at the 16q22.1
region may involve in the biological pathways of DN in Han Chinese patients with type 2 diabetes. This study can provide new insights into the etiology of DN.
Keywords: diabetic nephropathy; single-nucleotide polymorphism; haplotype; Han Chinese. Abbreviations: DN, Diabetic nephropathy; ESRD, End-stage renal disease; CKD, Chronic kidney disease; eGFR, estimated glomerular filtration rate; HDL-C, Hhigh-density lipoprotein cholesteroll; LDL-C, Low-density lipoprotein cholesterol; BUN, Blood urea nitrogen; MDS, Multidimensional scaling; LD, Linkage disequilibrium.
27 28 29 30 31 32 33 34 35 36 37 38 39 40 41 42 43 44 45 46 47 48 49 50 51
Introduction
Diabetic nephropathy (DN) has become one of the most common causes of end-stage renal disease (ESRD) in many countries. In Taiwan, diabetes accounted for 44.5% of all new cases of ESRD, based on the USRDS 2011 Annual Data Report [1]. Most DN patients had type 2 diabetes, and diabetic ESRD patients had worse survival than non-diabetic ESRD patients [2].
It has been reported that genetic predisposition is one of the main risk factors for the development of DN [3]. Numerous familial aggregation studies have suggested that genetic susceptibility plays an important role in the development and progression of DN [4,5]. Epidemiologic studies have shown that 35% of patients with diabetes develop nephropathy, irrespective of glycemic control [6,7].
Mooyaart et al. performed a meta-analysis to evaluate the pooled effect of each genetic variant reproducibly associated with DN [8]. They reported that 21 of 34 replicated genetic variants remained significantly associated with DN. These 34 variants were in or near the following genes: ACE, ELMO1, PPARG, etc. Recently, several genome-wide association studies (GWASs) have attempted to detect genetic variants associated with the risk of DN or diabetic ESRD in those of Japanese [9], Pima Indian [10], African American [11], Caucasian [12], and European ancestry [13].
Studies attempting to determine which genetic variants are related to DN in Han Chinese patients with type 2 diabetes are limited. In the present genetic association study, a case-control study was carried out to identify DN susceptibility variants in Han Chinese patients with type 2 diabetes, which can provide new insights into the etiology of DN.
Methods Study subjects 52 53 54 55 56 57 58 59 60 61 62 63 64 65 66 67 68 69 70 71 72 73 74 75
Individuals with type 2 diabetes and aged over 20 years were recruited using the American Diabetes Association (ICD-9-CM, Diagnosis code 250) criteria for diagnosis of type 2 diabetes. Individuals with type 1 diabetes, gestational diabetes, and maturity-onset diabetes of the young were excluded. The dataset used is part of the whole dataset for the published paper titled “A Genome-wide Association Study Identifies Susceptibility Variants for Type 2 Diabetes in Han Chinese” [14]. A total of 995 type 2 diabetes subjects recruited from China Medical University Hospital were included in the current study. All patients with type 2 diabetes were of Han Chinese origin, including Minnan, Hakka, and Mainland Chinese. Individuals with significant aboriginal ancestry were excluded by using self-administered questionnaires with six items regarding the ancestral origin of their parents and grandparents. Chronic kidney disease (CKD) was determined by estimated glomerular filtration rate (eGFR) and urine protein. Diabetic patients with eGFR <60 mL/min/1.73 m2 or with proteinuria determined by a spot urine dipstick of >1+ were defined as DN cases. A total of 217 DN cases were eligible for the study. To increase comparability between DN cases and controls, 357 controls were randomly selected based on frequency-matching of their age and durations of diabetes. This study was approved by the Human Research Committee of China Medical University Hospital. All patients signed informed consent forms.
Measurements
Blood samples were collected in the morning after a 12-h overnight fast and were sent for analysis within 4-h of collection. Spot morning urine samples were collected. Triglycerides, total cholesterol, high-density lipoprotein cholesterol (HDL-C), low-density lipoprotein cholesterol (LDL-C), creatinine, blood urea nitrogen (BUN), and uric acid were measured by a biochemical autoanalyser (Beckman Coulter, Synchron LX20, Fullerton, CA, USA). Renal function was evaluated by eGFR, which was estimated by using the Modification of Diet in Renal Disease Study equation for Taiwanese: eGFR (ml/min/1.73 m2) = 175 × (serum 76 77 78 79 80 81 82 83 84 85 86 87 88 89 90 91 92 93 94 95 96 97 98 99 100
creatinine (mg/dL)−1.154 × (age)−0.203 × (0.742 if female) × 0.945 [15]. We also used the Chronic Kidney Disease Epidemiology Collaboration equation to obtain eGFR [16]. The proportions of eGFR <60 mL/min/1.73 m2 by using above two equations were similar. A spot urine dipstick test was used for detecting proteinuria. Patients with a positive dipstick test (>1+) were classified as with proteinuria [17]. The sociodemographic and lifestyle characteristics and the reported health status for each subject were recorded using self-administered questionnaires.
Genotyping and quality control
Genomic DNA from peripheral blood was prepared using the Puregene DNA isolation kit (Gentra Systems, Minneapolis, MN, USA). Our samples were genotyped using Illumina HumanHap550-Duo BeadChip, which was performed by deCODE Genetics (Reykjavík, Iceland). Genotypes were called using the standard procedure in BeadStudio (Illumina, Inc., San Diego, CA, USA), with the default parameters recommended by the platform manufacturer. The genotyping quality control procedures used to identify and remove poor-quality data were described previously [14]. Individual SNPs were excluded if they had a total call rate <95% across all individuals, a minor allele frequency <5% and a total call rate <99%, or had significant deviation from Hardy-Weinberg disequilibrium (p <10-7) in these subjects. Further details of genotyping quality control procedures are available in the published study [14]. After SNPs quality control, 429,018 SNPs were used and their total call rate was 99.9%. We also examined population stratification by using multidimensional scaling (MDS) analysis as implemented in PLINK. The results of MDS analysis showed that there was no evidence for population stratification.
Statistical analysis
To identify the DN susceptibility variants, single-SNP association tests using Cochran-Armitage trend test were performed. Then, multiple logistic regression analysis using an 101 102 103 104 105 106 107 108 109 110 111 112 113 114 115 116 117 118 119 120 121 122 123 124 125
additive-effect disease model (an ordinal genotype model: 0, 1 and 2 of a minor allele) was performed for each SNP with adjustment of the subject's sex, age and durations of diabetes. The Bonferroni correction was used to adjust for multiple comparisons. According to previously published studies, as well as the results of single-SNP association tests and the Manhattan plot in our current study, potential susceptibility regions for DN were selected to perform haplotype analysis. In haplotype-based association analysis, the sliding window approach was adopted to detect haplotype effects. The window sizes of 3-SNP and 5-SNP haplotypes were used. The frequency of each haplotype with a prevalence >0.05 in this population was analyzed. Odds ratios (ORs) and their corresponding 95% confidence intervals (CIs) were calculated to estimate the effect sizes of the identified SNPs and haplotypes. In addition, the linkage disequilibrium (LD) structures of the identified contiguous SNPs were examined. For power calculation of our case-control study (217 DN cases and 357 controls), Quanto software [18] was used. Under an additive effect disease model with a prevalence of 10% for DN (from our dataset), given a genetic relative risk of 1.85 and a disease allele frequency of 0.25-0.45, the power of our study was 0.76-0.86 at an alpha level of 10-4. All analyses were carried out using Haploview (v4.2), PLINK (v1.07) (http://pngu.mgh.harvard.edu/purcell/plink), and SAS (v9.3, SAS Institute Inc, Cary, NC, USA) software.
Results
Clinical characteristics of study samples
A total of 574 type 2 diabetes study participants, comprising 217 cases of DN and 357 type 2 diabetes patients without DN controls, were included in the analysis. The mean age of the participants was about 62 years for both groups and their mean HbA1c at enrollment was 8.2 ± 1.7% for the cases and 7.9 ± 1.4% for the controls. The mean durations of diabetes were 11.1 ± 7.7 years for the cases and 10.2 ± 7.3 years for the controls (Table 1).
126 127 128 129 130 131 132 133 134 135 136 137 138 139 140 141 142 143 144 145 146 147 148 149 150
The graphical summary plot and single-SNP association tests
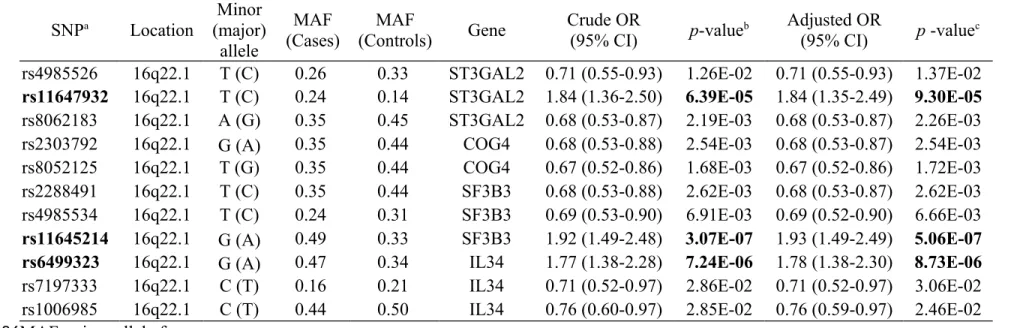
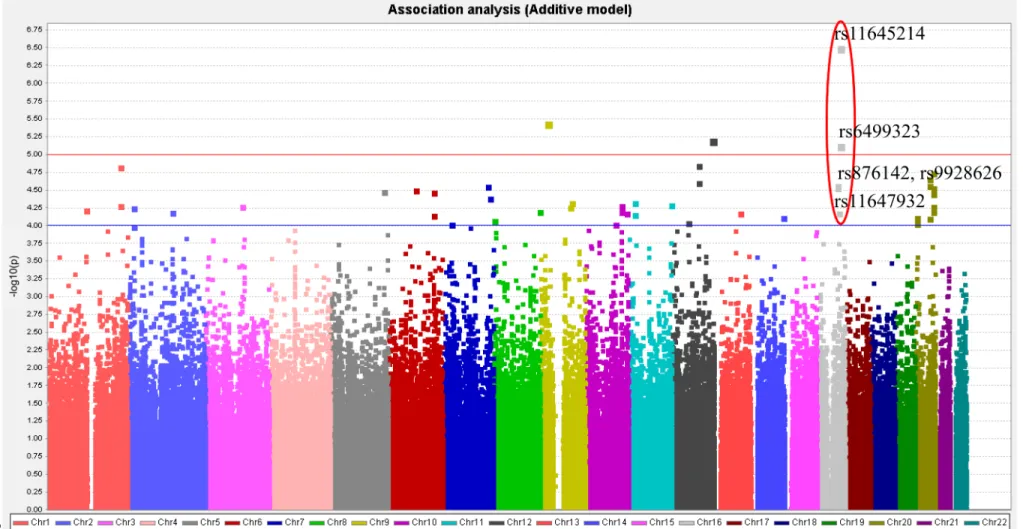
The graphical summary plot of DN in single-SNP association analysis under additive-effect disease model is shown in Figure 1. A signal (rs876142, rs9928626, rs11647932, rs11645214, and rs6499323) on chromosome 16 (16q21-16q22.1 regions) was observed, indicating the SNPs around this area may be potential susceptibility variants for DN. In addition, a previous study reviewed in a meta-analysis by Mooyaart et al. showed that the Hp 1/2 variant in the HP gene (located at 16q22.2) was associated with DN. Therefore, a total of 383 genotyped SNPs at the 16q22.1-16q22.2 regions were selected for this study. Significant SNPs (p < 10-4) identified from single-SNP association analysis, along with the other 8 SNPs identified from haplotype association analysis, are presented in Table 2. The SNP with the lowest p-value (5.06 × 10⁻⁷) was rs11645214 located on chromosome 16q22.1. This SNP, with a higher risk of DN (adjusted OR [95% CI]: 1.93 [1.49-2.49]), is inside the SF3B3 gene. Two other SNPs that showed a significant association with DN, each with an additive-effect, were rs11647932 (ST3GAL2) and rs6499323 (IL34) on chromosome 16q22.1. No significant variants were detected for DN at the 16q22.2 region.
The LD structures and haplotypic association tests
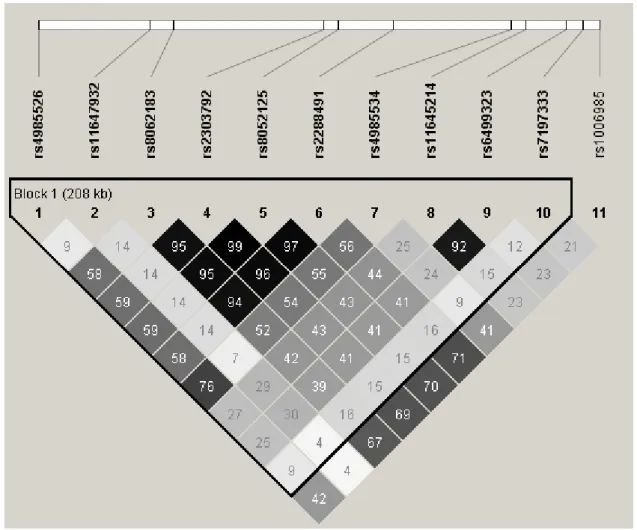
Pairwise LD and correlation coefficients (r2) among the 11 SNPs located at 16q22.1 region are shown in Figure 2. SNPs rs8062183 in ST3GAL2, rs2303792 and rs8052125 in COG4, and rs2288491 in SF3B3 had a stronger correlation with one another (r2 >0.94). In addition, SNP rs11645214 in SF3B3 was highly correlated with rs6499323 in IL34 (r2 =0.92). Nevertheless, SNP rs11647932 and other SNPs were poorly correlated with r2 values ranging from 0.04 to 0.30.
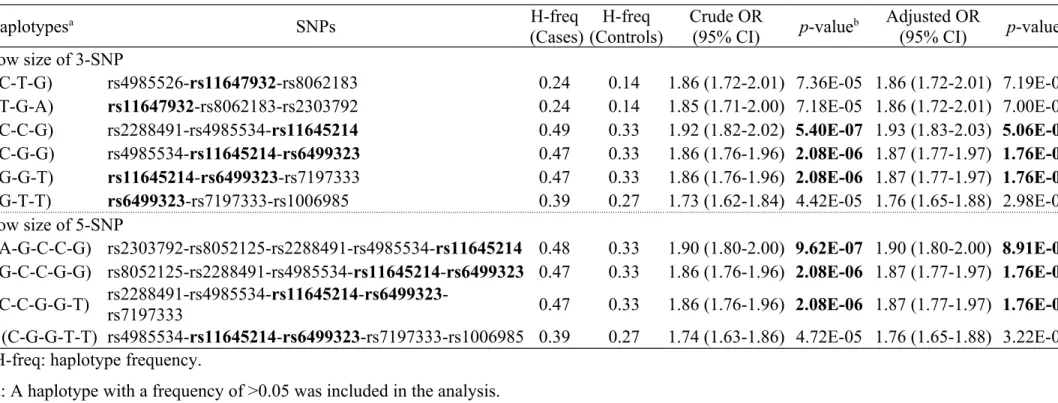
Genotyped SNPs at the 16q22.1-16q22.2 regions were selected for the haplotypic association tests in this study. The window sizes of 3-SNP and 5-SNP haplotypes were used to detect haplotype effects on DN, and a frequency of >0.05 was analyzed. The haplotypes 151 152 153 154 155 156 157 158 159 160 161 162 163 164 165 166 167 168 169 170 171 172 173 174 175
with a p-value <10-4 are listed in Table 3. The data indicates that 3-SNP haplotypes C-C-G, C-G-G and G-G-T, as well as 5-SNP haplotypes A-G-C-C-G, G-C-C-G-G and C-C-G-G-T were significantly associated with DN in this sample. In particular, haplotypes C-C-G (p =5.06 × 10⁻⁷) and A-G-C-C-G (p =8.91 × 10⁻⁷) seems to be associated with a higher risk of DN (adjusted OR [95% CI]: 1.93 [1.83-2.03] and 1.90 [1.80-2.00]). We also found that SNP combinations directly including alleles with significant single-SNP associations resulted in remarkably different haplotype effects on DN.
Discussion
There is very limited evidence that any of genetic variants contribute to DN in Han Chinese populations. In this study, we expand on the previous investigation by Tsai et al. [14], which described compelling evidence of an association of type 2 diabetes with polymorphisms. We identified 11 SNPs in four loci that were associated with DN in a Han Chinese population. As a consequence, we were able to identify novel loci specifically associated with DN. Two SNPs of two loci with p-values in the 10-5 to 10-7 range were identified for DN. These include SNPs rs11645214 (SF3B3) and rs6499323 (IL34), with about a 2-fold increased risk of DN. In the haplotype association analysis, 10 haplotypes, including these three SNPs (rs11647932, rs11645214, and rs6499323), carried an approximately 2-fold increased risk of DN, which further confirmed the findings of the single-SNP association tests.
Previous studies using GWAS approach on DN in different racial groups have been conducted [9-13]. These studies showed that different polymorphisms in or near genes may be related to DN susceptibility, for example, intron 18+9170 (ELMO1) in Japanese [9]; rs2720709 (PVT1) and rs2648875 (PVT1) in Pima Indians [10]; rs6930576 (SASH1), rs7769051 (near RPS12), rs9493454 (RPS12), rs7735506 (AUH), rs2358944 (near MSRB3~HMGA2), rs2106294 (LIMK2), rs4820043 (LIMK2), and rs5749286 (SFI1) in 176 177 178 179 180 181 182 183 184 185 186 187 188 189 190 191 192 193 194 195 196 197 198 199 200
African Americans [11]; rs1888747 (near FRMD3), rs10868025 (near FRMD3), rs739401 (CARS), and rs451041 (CARS) in Caucasians [12]; and rs7583877 (AFF3), rs12437854 (near RGMA~MCTP2), and rs7588550 (ERBB4) in those of European ancestry [13]. The susceptibility variants for DN varied widely among different population groups, which may be due to racial differences and genetic backgrounds. In this study, we found that polymorphisms in the ST3GAL2, COG4, SF3B3, and IL34 genes may contribute to DN susceptibility in Han Chinese residing in Taiwan. The proportions of minor alleles of SNPs rs11647932 and rs6499323 among Taiwanese (14% and 34%, respectively) were similar to those of Han Chinese in China (CHB: 14% and 36%), but higher than those of Japanese (JPT: 12% and 28%), Europeans (CEU: 12% and 20%), and Africans (YRI: 0% and 12%) [19].
Many plausible mechanisms have been hypothesized to be involved in the association between DN and identified SNPs. First, the protein encoded by the ST3GAL2 gene mapped on chromosome 16q22.1 catalyzes the transfer of sialic acid from CMP-sialic acid to galactose-containing substrates [20]. Sialic acid is one of the inflammatory biomarkers of the acute-phase response and is a possible risk factor for cardiovascular disease [21]. Sialic acid was synthesized as a result of cytokines released by inflammatory cells and damaged endothelia due to angiopathy-associated tissue injury [21]. This cytokine response could directly result in vasculopathy in diabetes through atherosclerosis [21]. Moreover, cross-sectional and longitudinal studies have shown that elevated serum sialic acid concentrations are related to diabetic microvascular complications (including DN) in type 2 diabetes [22,23] or type 1 diabetes [24,25]. A strong association between increased serum sialic acid concentrations and macrovascular complications (coronary heart disease; CHD) in type 2 diabetes was also observed [26]. In addition, a 7-year prospective cohort study revealed that a raised serum sialic acid concentration is associated with CHD in type 1 diabetes [27].
201 202 203 204 205 206 207 208 209 210 211 212 213 214 215 216 217 218 219 220 221 222 223 224
Second, the protein encoded by the COG4 (a component of oligomeric golgi complex 4) gene, including COG4, is critical for the structure and function of the Golgi apparatus and can influence intracellular membrane trafficking, including the addition and processing of carbohydrates (glycosylation) in the rough endoplasmic reticulum and Golgi [28,29]. Mutations in COG4 may lead to abnormal functioning in the Golgi apparatus, resulting in an excessive amount of glucose circulating in the blood plasma. Diabetes mellitus is characterized by chronic hyperglycaemia. A number of studies have examined the relationship of hyperglycaemia, classified according to mean levels of HbA1c [30-32] or fasting plasma glucose [33,34], with diabetic complications.
Third, the IL34 (interleukin 34) gene maps on chromosome 16q22.1. Interleukin 34 is a cytokine that promotes the differentiation and viability of monocytes and macrophages through the colony-stimulating factor-1 receptor (CSF1R) [35], and the causative role of macrophages and/or monocytes in DN has been demonstrated by cell depletion studies in animal models [36,37]. Many studies have shown that inflammatory cytokines such as IL-1, IL-6, IL-18, and TNF-α are important in the pathogenesis of diabetic microvascular complications (including DN) [38]. Furthermore, previous studies have revealed that cytokine gene polymorphisms such as IL-1, IL-6, and TNF-α are related to DN [39]. Variants in IL34 may play a role in the pathogenesis of DN because of the highly correlated cytokine network, although there is no direct evidence for the association between IL34 gene polymorphisms and DN.
The subjects in this study were a portion of the cohort studied in a published GWAS paper [14]. Although the sample size in this study was limited, the DN cases and the controls were much more homogeneous in terms of gender, age, durations of diabetes, and HbA1c level after excluding subjects with extreme characteristics and matching their age and durations of diabetes. A previous study found that the Han Chinese residing in Taiwan were 225 226 227 228 229 230 231 232 233 234 235 236 237 238 239 240 241 242 243 244 245 246 247 248 249
relatively homogenous in genetic background, spread among the three major ethnic groups of Minnan, Hakka, and Mainland Chinese [40], which is consistent with the results of our population stratification analysis. Therefore, the impact of population stratification on our genetic association study is small.
We identified novel SNPs (rs11647932, rs11645214, and rs6499323) and haplotypes (H3 G), H4 (C-G-G), H5 (G-G-T), H7 (A-G-C-C-G), H8 (G-C-C-G-G), and H9 (C-C-G-G-T)), located at the 16q22.1 region, that are susceptibility variants of DN in a Han Chinese population in Taiwan. The findings reveal that the susceptibility variants located at the 16q22.1 region may involve in the biological pathways of DN in Han Chinese patients with type 2 diabetes. Our results can provide new insights into the etiology of DN.
Author contributions
LNLiao, CCChen, CCLin, CTChang, SLRKardia, TCLi, and FJTsai carried out the conception and design, acquisition of data, and analysis and interpretation of data. LNLiao, FYWu, and TCLi drafted the article or revised it critically for important intellectual content.
All authors read and approved the final manuscript.
Acknowledgements
We would like to thank all of the patients and study personnel who participated in this study. We also thank the Academia Sinica for technical support. This study was supported by the Academia Sinica (BM102010130) and the Taiwan Department of Health Clinical Trial and Research Center of Excellence (DOH102-TD-B-111-004).
Conflict of interest
The authors have declared that no competing interests exist. 250 251 252 253 254 255 256 257 258 259 260 261 262 263 264 265 266 267 268 269 270 271 272
References
1. Collins AJ, Foley RN, Chavers B, Gilbertson D, Herzog C, et al. (2012) United States Renal Data System 2011 Annual Data Report: Atlas of chronic kidney disease & end-stage renal disease in the United States. Am J Kidney Dis 59: A7, e1-420.
2. Yang WC, Hwang SJ (2008) Incidence, prevalence and mortality trends of dialysis end-stage renal disease in Taiwan from 1990 to 2001: the impact of national health insurance. Nephrol Dial Transplant 23: 3977-3982.
3. Gross JL, de Azevedo MJ, Silveiro SP, Canani LH, Caramori ML, et al. (2005) Diabetic nephropathy: diagnosis, prevention, and treatment. Diabetes Care 28: 164-176.
4. Seaquist ER, Goetz FC, Rich S, Barbosa J (1989) Familial clustering of diabetic kidney disease. Evidence for genetic susceptibility to diabetic nephropathy. N Engl J Med 320: 1161-1165.
5. Imperatore G, Knowler WC, Pettitt DJ, Kobes S, Bennett PH, et al. (2000) Segregation analysis of diabetic nephropathy in Pima Indians. Diabetes 49: 1049-1056.
6. Andersen AR, Christiansen JS, Andersen JK, Kreiner S, Deckert T (1983) Diabetic nephropathy in Type 1 (insulin-dependent) diabetes: an epidemiological study. Diabetologia 25: 496-501.
7. Krolewski AS, Warram JH, Christlieb AR, Busick EJ, Kahn CR (1985) The changing natural history of nephropathy in type I diabetes. Am J Med 78: 785-794.
8. Mooyaart AL, Valk EJ, van Es LA, Bruijn JA, de Heer E, et al. (2011) Genetic associations in diabetic nephropathy: a meta-analysis. Diabetologia 54: 544-553. 9. Shimazaki A, Kawamura Y, Kanazawa A, Sekine A, Saito S, et al. (2005) Genetic
variations in the gene encoding ELMO1 are associated with susceptibility to diabetic nephropathy. Diabetes 54: 1171-1178.
10. Hanson RL, Craig DW, Millis MP, Yeatts KA, Kobes S, et al. (2007) Identification of PVT1 as a candidate gene for end-stage renal disease in type 2 diabetes using a pooling-based genome-wide single nucleotide polymorphism association study. Diabetes 56: 975-983.
11. McDonough CW, Palmer ND, Hicks PJ, Roh BH, An SS, et al. (2011) A genome-wide association study for diabetic nephropathy genes in African Americans. Kidney Int 79: 563-572.
12. Pezzolesi MG, Poznik GD, Mychaleckyj JC, Paterson AD, Barati MT, et al. (2009) Genome-wide association scan for diabetic nephropathy susceptibility genes in type 1 diabetes. Diabetes 58: 1403-1410.
13. Sandholm N, Salem RM, McKnight AJ, Brennan EP, Forsblom C, et al. (2012) New susceptibility loci associated with kidney disease in type 1 diabetes. PLoS Genet 8: e1002921. 273 274 275 276 277 278 279 280 281 282 283 284 285 286 287 288 289 290 291 292 293 294 295 296 297 298 299 300 301 302 303 304 305 306 307 308 309
14. Tsai FJ, Yang CF, Chen CC, Chuang LM, Lu CH, et al. (2010) A genome-wide association study identifies susceptibility variants for type 2 diabetes in Han Chinese. PLoS Genet 6: e1000847.
15. DOH (2011) The Report of Chronic Kidney Disease Prevention, 2011 [in Chinese]. Department of Health, Republic of China (Taiwan).
16. Levey AS, Stevens LA, Schmid CH, Zhang YL, Castro AF, 3rd, et al. (2009) A new equation to estimate glomerular filtration rate. Ann Intern Med 150: 604-612.
17. NKF (2002) K/DOQI clinical practice guidelines for chronic kidney disease: evaluation, classification, and stratification. Am J Kidney Dis 39: S1-266.
18. Gauderman WJ, Morrison JM (2006) QUANTO 1.1: A computer program for power and sample size calculations for genetic-epidemiology studies, http://hydra.usc.edu/gxe. 19. HapMap. Data Rel 27 Phase II+III, Feb 09. International HapMap Consortium.
http://hapmap.ncbi.nlm.nih.gov. Accessed May 21, 2013.
20. NCBI. ST3GAL2: ST3 beta-galactoside alpha-2,3-sialyltransferase 2. National Center for Biotechnology Information. http://www.ncbi.nlm.nih.gov/gene/6483. Accessed May 21, 2013.
21. Gopaul KP, Crook MA (2006) Sialic acid: a novel marker of cardiovascular disease? Clin Biochem 39: 667-681.
22. Chen J, Gall MA, Yokoyama H, Jensen JS, Deckert M, et al. (1996) Raised serum sialic acid concentration in NIDDM patients with and without diabetic nephropathy. Diabetes Care 19: 130-134.
23. Nayak BS, Roberts L (2006) Relationship between inflammatory markers, metabolic and anthropometric variables in the Caribbean type 2 diabetic patients with and without microvascular complications. J Inflamm (Lond) 3: 17.
24. Crook MA, Pickup JC, Lumb PJ, Giorgino F, Webb DJ, et al. (2001) Relationship between plasma sialic acid concentration and microvascular and macrovascular complications in type 1 diabetes: the EURODIAB Complications Study. Diabetes Care 24: 316-322.
25. Yokoyama H, Jensen JS, Myrup B, Mathiesen ER, Ronn B, et al. (1996) Raised serum sialic acid concentration precedes onset of microalbuminuria in IDDM. A 10-year follow-up study. Diabetes Care 19: 435-440.
26. Pickup JC, Mattock MB, Crook MA, Chusney GD, Burt D, et al. (1995) Serum sialic acid concentration and coronary heart disease in NIDDM. Diabetes Care 18: 1100-1103. 27. Soedamah-Muthu SS, Chaturvedi N, Pickup JC, Fuller JH, Group EPCS (2008)
Relationship between plasma sialic acid and fibrinogen concentration and incident micro- and macrovascular complications in type 1 diabetes. The EURODIAB Prospective Complications Study (PCS). Diabetologia 51: 493-501.
28. Lodish H, Berk A, Matsudaira P, Kaiser CA, Krieger M, et al. (2004) Molecular Cell 310 311 312 313 314 315 316 317 318 319 320 321 322 323 324 325 326 327 328 329 330 331 332 333 334 335 336 337 338 339 340 341 342 343 344 345 346 347
Biology. New York: W.H. Freeman and Company. 673 p.
29. Ungar D, Oka T, Brittle EE, Vasile E, Lupashin VV, et al. (2002) Characterization of a mammalian Golgi-localized protein complex, COG, that is required for normal Golgi morphology and function. J Cell Biol 157: 405-415.
30. Hemmingsen B, Lund SS, Gluud C, Vaag A, Almdal T, et al. (2011) Intensive glycaemic control for patients with type 2 diabetes: systematic review with meta-analysis and trial sequential analysis of randomised clinical trials. BMJ 343: d6898.
31. Tu ST, Chang SJ, Chen JF, Tien KJ, Hsiao JY, et al. (2010) Prevention of diabetic nephropathy by tight target control in an asian population with type 2 diabetes mellitus: a 4-year prospective analysis. Arch Intern Med 170: 155-161.
32. UKPDS (1998) Intensive blood-glucose control with sulphonylureas or insulin compared with conventional treatment and risk of complications in patients with type 2 diabetes (UKPDS 33). UK Prospective Diabetes Study (UKPDS) Group. Lancet 352: 837-853. 33. Lawes CM, Parag V, Bennett DA, Suh I, Lam TH, et al. (2004) Blood glucose and risk of
cardiovascular disease in the Asia Pacific region. Diabetes Care 27: 2836-2842. 34. Sorkin JD, Muller DC, Fleg JL, Andres R (2005) The relation of fasting and 2-h
postchallenge plasma glucose concentrations to mortality: data from the Baltimore Longitudinal Study of Aging with a critical review of the literature. Diabetes Care 28: 2626-2632.
35. Lin H, Lee E, Hestir K, Leo C, Huang M, et al. (2008) Discovery of a cytokine and its receptor by functional screening of the extracellular proteome. Science 320: 807-811. 36. Shikata K, Makino H (2001) Role of macrophages in the pathogenesis of diabetic
nephropathy. Contrib Nephrol: 46-54.
37. Tesch GH (2007) Role of macrophages in complications of type 2 diabetes. Clin Exp Pharmacol Physiol 34: 1016-1019.
38. Navarro-Gonzalez JF, Mora-Fernandez C, Muros de Fuentes M, Garcia-Perez J (2011) Inflammatory molecules and pathways in the pathogenesis of diabetic nephropathy. Nat Rev Nephrol 7: 327-340.
39. Navarro-Gonzalez JF, Mora-Fernandez C (2008) The role of inflammatory cytokines in diabetic nephropathy. J Am Soc Nephrol 19: 433-442.
40. Yang HC, Lin CH, Hsu CL, Hung SI, Wu JY, et al. (2006) A comparison of major histocompatibility complex SNPs in Han Chinese residing in Taiwan and Caucasians. J Biomed Sci 13: 489-498. 348 349 350 351 352 353 354 355 356 357 358 359 360 361 362 363 364 365 366 367 368 369 370 371 372 373 374 375 376 377 378 379 380
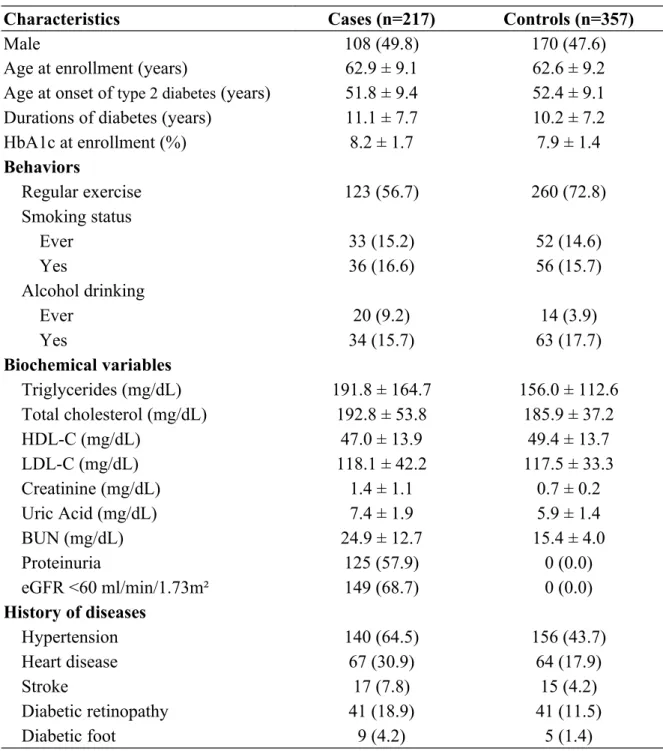
Table 1. Clinical characteristics of study samples.
Characteristics Cases (n=217) Controls (n=357)
Male 108 (49.8) 170 (47.6)
Age at enrollment (years) 62.9 ± 9.1 62.6 ± 9.2
Age at onset of type 2 diabetes (years) 51.8 ± 9.4 52.4 ± 9.1
Durations of diabetes (years) 11.1 ± 7.7 10.2 ± 7.2
HbA1c at enrollment (%) 8.2 ± 1.7 7.9 ± 1.4 Behaviors Regular exercise 123 (56.7) 260 (72.8) Smoking status Ever 33 (15.2) 52 (14.6) Yes 36 (16.6) 56 (15.7) Alcohol drinking Ever 20 (9.2) 14 (3.9) Yes 34 (15.7) 63 (17.7) Biochemical variables Triglycerides (mg/dL) 191.8 ± 164.7 156.0 ± 112.6 Total cholesterol (mg/dL) 192.8 ± 53.8 185.9 ± 37.2 HDL-C (mg/dL) 47.0 ± 13.9 49.4 ± 13.7 LDL-C (mg/dL) 118.1 ± 42.2 117.5 ± 33.3 Creatinine (mg/dL) 1.4 ± 1.1 0.7 ± 0.2 Uric Acid (mg/dL) 7.4 ± 1.9 5.9 ± 1.4 BUN (mg/dL) 24.9 ± 12.7 15.4 ± 4.0 Proteinuria 125 (57.9) 0 (0.0) eGFR <60 ml/min/1.73m² 149 (68.7) 0 (0.0) History of diseases Hypertension 140 (64.5) 156 (43.7) Heart disease 67 (30.9) 64 (17.9) Stroke 17 (7.8) 15 (4.2) Diabetic retinopathy 41 (18.9) 41 (11.5) Diabetic foot 9 (4.2) 5 (1.4)
Data were presented as mean±SD for continuous variables or n (%) for categorical variables. eGFR: estimated glomerular filtration rate; BUN: blood urea nitrogen.
381
382 383 384
Table 2. Single-SNP association analysis for DN under the additive model. SNPa Location Minor (major) allele MAF (Cases) MAF (Controls) Gene Crude OR (95% CI) p-valueb Adjusted OR (95% CI) p -valuec rs4985526 16q22.1 T (C) 0.26 0.33 ST3GAL2 0.71 (0.55-0.93) 1.26E-02 0.71 (0.55-0.93) 1.37E-02 rs11647932 16q22.1 T (C) 0.24 0.14 ST3GAL2 1.84 (1.36-2.50) 6.39E-05 1.84 (1.35-2.49) 9.30E-05 rs8062183 16q22.1 A (G) 0.35 0.45 ST3GAL2 0.68 (0.53-0.87) 2.19E-03 0.68 (0.53-0.87) 2.26E-03
rs2303792 16q22.1 G (A) 0.35 0.44 COG4 0.68 (0.53-0.88) 2.54E-03 0.68 (0.53-0.87) 2.54E-03
rs8052125 16q22.1 T (G) 0.35 0.44 COG4 0.67 (0.52-0.86) 1.68E-03 0.67 (0.52-0.86) 1.72E-03
rs2288491 16q22.1 T (C) 0.35 0.44 SF3B3 0.68 (0.53-0.88) 2.62E-03 0.68 (0.53-0.87) 2.62E-03 rs4985534 16q22.1 T (C) 0.24 0.31 SF3B3 0.69 (0.53-0.90) 6.91E-03 0.69 (0.52-0.90) 6.66E-03 rs11645214 16q22.1 G (A) 0.49 0.33 SF3B3 1.92 (1.49-2.48) 3.07E-07 1.93 (1.49-2.49) 5.06E-07 rs6499323 16q22.1 G (A) 0.47 0.34 IL34 1.77 (1.38-2.28) 7.24E-06 1.78 (1.38-2.30) 8.73E-06
rs7197333 16q22.1 C (T) 0.16 0.21 IL34 0.71 (0.52-0.97) 2.86E-02 0.71 (0.52-0.97) 3.06E-02
rs1006985 16q22.1 C (T) 0.44 0.50 IL34 0.76 (0.60-0.97) 2.85E-02 0.76 (0.59-0.97) 2.46E-02
MAF: minor allele frequency.
a: The 11 SNPs were all inside a gene.
b: p-value from Chi-square test (Cochran-Armitage trend test).
c: p-value from logistic regression under an additive model (an ordinal genotype model: 0, 1 and 2 of a minor allele) after adjustment of subject's sex, age and durations of diabetes.
385 386 387 388 389 390
Table 3. Haplotypic association tests for DN at the 16q22.1-16q22.2 regions.
Haplotypesa SNPs H-freq
(Cases) (Controls)H-freq Crude OR(95% CI) p-valueb Adjusted OR(95% CI) p-valuec Window size of 3-SNP
H1 (C-T-G) rs4985526-rs11647932-rs8062183 0.24 0.14 1.86 (1.72-2.01) 7.36E-05 1.86 (1.72-2.01) 7.19E-05
H2 (T-G-A) rs11647932-rs8062183-rs2303792 0.24 0.14 1.85 (1.71-2.00) 7.18E-05 1.86 (1.72-2.01) 7.00E-05
H3 (C-C-G) rs2288491-rs4985534-rs11645214 0.49 0.33 1.92 (1.82-2.02) 5.40E-07 1.93 (1.83-2.03) 5.06E-07
H4 (C-G-G) rs4985534-rs11645214-rs6499323 0.47 0.33 1.86 (1.76-1.96) 2.08E-06 1.87 (1.77-1.97) 1.76E-06
H5 (G-G-T) rs11645214-rs6499323-rs7197333 0.47 0.33 1.86 (1.76-1.96) 2.08E-06 1.87 (1.77-1.97) 1.76E-06
H6 (G-T-T) rs6499323-rs7197333-rs1006985 0.39 0.27 1.73 (1.62-1.84) 4.42E-05 1.76 (1.65-1.88) 2.98E-05
Window size of 5-SNP
H7 (A-G-C-C-G) rs2303792-rs8052125-rs2288491-rs4985534-rs11645214 0.48 0.33 1.90 (1.80-2.00) 9.62E-07 1.90 (1.80-2.00) 8.91E-07 H8 (G-C-C-G-G) rs8052125-rs2288491-rs4985534-rs11645214-rs6499323 0.47 0.33 1.86 (1.76-1.96) 2.08E-06 1.87 (1.77-1.97) 1.76E-06 H9 (C-C-G-G-T) rs2288491-rs4985534-rs11645214-rs6499323-rs7197333 0.47 0.33 1.86 (1.76-1.96) 2.08E-06 1.87 (1.77-1.97) 1.76E-06 H10 (C-G-G-T-T) rs4985534-rs11645214-rs6499323-rs7197333-rs1006985 0.39 0.27 1.74 (1.63-1.86) 4.72E-05 1.76 (1.65-1.88) 3.22E-05
H-freq: haplotype frequency.
a: A haplotype with a frequency of >0.05 was included in the analysis.
b: p-value from logistic regression under an additive model (an ordinal genotype model: 0, 1 and 2 of a minor allele). c: p-value from logistic regression under an additive model after adjustment of subject's sex, age and durations of diabetes. 391 392 393 394 395 396
Figure legends
Figure 1. Graphical summary of DN in single-SNP association analysis under additive-effect disease model.
Figure 2. Pairwise linkage disequilibrium (LD) and correlation coefficients (r2) among the 11 SNPs located at 16q22.1 region.
397 398 399 400 401
Figure 1. Graphical summary of DN in single-SNP association analysis under additive-effect disease model. 402
Figure 2. Pairwise linkage disequilibrium (LD) and correlation coefficients (r2) among the 11 SNPs located at 16q22.1 region.
404 405 406