1624
q 2005 SETAC Printed in the USA 0730-7268/05 $12.001 .00
DEVELOPMENT AND TESTING OF A GREEN FLUORESCENT PROTEIN–BASED
BACTERIAL BIOSENSOR FOR MEASURING BIOAVAILABLE ARSENIC IN
CONTAMINATED GROUNDWATER SAMPLES
V
IVIANH
SIU-C
HUANL
IAO* and K
UN-L
INO
UDepartment of Bioenvironmental Systems Engineering, National Taiwan University, Taipei 106, Taiwan, Republic of China (Received 6 October 2004; Accepted 13 January 2005)
Abstract—A green fluorescent protein (GFP)–based bacterial biosensor for the detection of bioavailable As(III), As(V), and Sb(III)
was developed and characterized. The biosensor strainEscherichia coli DH5a (pVLAS1) was developed based on the expression ofgfp under the control of the ars promoter and the arsR gene of Staphylococcus aureus plasmid pI258. Strain DH5a (pVLAS1) responded mainly to As(III), As(V), and Sb(III), with the lowest detectable concentrations being 0.4, 1, and 0.75mM, respectively, during a 2-h exposure and 0.1mM for all three metal ions with an 8-h induction period. To assess its applicability for analyzing environmentally relevant samples, the biosensor was field-tested on shallow-well groundwater for which contaminant levels were known. Our results demonstrate that the nonpathogenic bacterial biosensor developed in the present study is useful and applicable in determining the bioavailability of arsenic with high sensitivity in contaminated groundwater samples, and they suggest a potential for its inexpensive application in field-ready tests.
Keywords—Green fluorescent protein Bacterial biosensor Bioavailable arsenic Contaminated groundwater
INTRODUCTION
Concern is growing about the potential effects of environ-mental metal pollution on human health and the environment. With this awareness, a need for sensitive and effective methods that can efficiently monitor and determine the presence and amount of hazardous metals in the environment is being rec-ognized. Among metals and metalloids, arsenic toxicity is con-sidered to be an important issue of current public health. Ar-senic, a known human carcinogen, is widely distributed in food, water, soil, and air. It is released into the environment from both natural and human activities [1]. It was ranked first on the Comprehensive Environmental Response, Compensa-tion, and Liability Act priority list of hazardous substances in 2003 (http://www.atsdr.cdc.gov/clist.html). Arsenic is intro-duced into water through the dissolution of minerals and ores. In addition, arsenic can accumulate in groundwater and well water in some areas as a result of erosion or leaching from local rocks. Moreover, industrial effluents, combustion of fossil fuels, and arsenic pesticides all contribute to arsenic contam-ination in freshwater systems [1]. Exposure to arsenic in drink-ing water represents a significant health problem for people around the world. Epidemiologic studies in Taiwan, Chile, Bangladesh, and India have shown that arsenic exposure is associated with skin, liver, lung, bladder, and other cancers [2–4].
Several different types of organic and inorganic arsenic exist. The inorganic arsenics, including arsenite (As(III)) and arsenate (As(V)), can be methylated to form monomethylar-sonic acid and dimethylarsinic acid in vivo [5]. The toxico-logical effects of arsenic highly depend on its oxidation state, chemical composition, and bioavailability [6]. The trivalent
* To whom correspondence may be addressed ([email protected]).
form of arsenic appears to be the most toxic, regardless of its being inorganic or organic form [7].
In contrast to arsenic, antimony is less widely distributed in the environment. Nevertheless, it was found to be an en-vironmental contaminant because of anthropogenic activities. Mining and smelting operations are the greatest emission source of antimony into the environment [8]. Additionally, antimony is used in semiconductors for making infrared de-tectors, diodes, and Hall-effect devices [9]. Antimony trioxide is used primarily as a flame-proof retardant of textiles, plastics, paint pigments, adhesives, and paper [9]. Antimony potassium tartrate has been used worldwide as an antishistosomal drug. Pentavalent antimony compounds are used widely in the treat-ment of leishmaniasis [10].
Antimony has no known biological function, and like ar-senic, it is toxic. Little work has been done regarding the toxicology of antimony, because it is less widely present in the environment. Therefore, little information about antimony is available for evaluating its toxicology and accurately de-termining its impact on the environment and human health. As with arsenic, antimony bioavailability and toxicity are de-pendent on speciation [11,12].
Certain microorganisms have evolved and contain the nec-essary genetic components that confer a variety of resistance mechanisms that allow them to survive and grow in environ-ments containing levels of metals that would be toxic to most organisms. Resistance to As(III), As(V), and Sb(III) is found in both Gram-negative and Gram-positive bacteria [13]. High-level resistance to arsenic is conferred by thears operon. Bac-terialars systems confer arsenic resistance primarily by en-coding a specific efflux pump that exports As(III) from the cytoplasm, thus lowering the intracellular concentration of the toxic arsenic [14,15]. The arsenic resistance ars operon in Escherichia coli has both plasmid [16] and chromosomal [17] determinants. The well-characterized plasmid-borne ars
op-eron of E. coli is composed of two regulatory genes (arsR andarsD) and three structural genes (arsA, arsB, and arsC) [18,19]. In contrast, thears operon in plasmid pI258 of Staph-ylococcus aureus contains only one regulatory gene, arsR, as well as two structural genes,arsB and arsC [20]. In the absence of As(III), thearsR repressor binds to its operator/promoter site within the operon and, therefore, prevents the expression of the structural genes [20]. In the presence of As(III), it in-teracts with the repressor, leading to a conformational change that results in the dissociation ofarsR repressor from its op-erator/promoter site [20]. Consequently, the downstreamars genes express, and detoxification occurs.
Because of the precise regulation of the resistance gene expression, the regulatory element can then be coupled to a reporter gene through a gene fusion that, upon expression, produces a readily measurable signal in response to toxic met-als and metalloids. Several bacterial biosensors based on tran-scriptional fusions between arsenic-inducible promoters and reporter systems have been described [21–24]. These bio-sensing systems are based mostly on the resistance mechanism that is encoded by thears operon found on the E. coli plasmid R773 [21–23]. In contrast, Tauriainen et al. [24] employed a different regulatory unit that was derived from thears operon of plasmid pI258 fromS. aureus. Various reporter genes, such aslacZ, luxAB, and luc, were used in the transcriptional fusion constructs in their studies [21–24]. Although the colorimetric enzyme assay and bioluminescence have been very successful as a reporter for arsenic detection in their studies, these de-tection methods require addition of exogenous substrates or cofactors for signal production. The gene for green fluorescent protein (GFP) from the jellyfishAequoria victoria [25] is in-creasingly used as a reporter gene, although it has not been used extensively as a reporter for measuring biologically rel-evant concentrations of pollutants. Green fluorescent protein fluorescence is stable and can be monitored noninvasively in living cells. Green fluorescent protein also is an attractive re-porter system, because it is easy to use and does not require any exogenous substrates or cofactors. The use of GFP as a reporter protein in the bacterial biosensing system therefore can obviate centrifugation, cell lysis, pH adjustment, and sub-sequently, kinetic enzyme activity measurements. Recently, Stocker et al. [23] developed a set of sensors that employed the regulatory units derived from thears operon of E. coli plasmid R773 by fusing three reporter genes:lacZ, luxAB, or gfp. In their study, the GFP fluorescence levels in single cells were determined by epifluorescence microscopy, a procedure that was relatively time-consuming and might have hindered the biosensors from rapid detection and quantitation of arsenic. In the present study, we describe the construction of a non-pathogenic E. coli whole-cell biosensor for the detection of bioavailable As(III), As(V), and Sb(III) by employing red-shifted GFP (rs-GFP) as a reporter protein. The sensor plasmid is based on the expression ofrs-GFP under the control of the ars promoter and the arsR gene of the S. aureus plasmid pI258 [20]. In the absence of As(III), As(V), and Sb(III), the ex-pression ofgfp gene is repressed. In the designed sensor plas-mid, arsR regulates the expression of gfp gene in a manner that is dependent on the concentration of As(III), As(V), and Sb(III) in the sample. Therefore, the fluorescence emitted by GFP is correlated to the concentration of As(III), As(V), and Sb(III) in the samples. Moreover, the levels of GFP fluores-cence can be measured both rapidly and easily using fluorom-etry for assessing the bioavailability of As(III), As(V), and
Sb(III). Finally, although the biosensors described by others have been used successfully to detect arsenic, most of these biosensors often are not applied outside the research labora-tory. Therefore, the feasibility of the bacterial biosensor for measuring bioavailable arsenic in environmental samples has not been well tested. To demonstrate the usability of the bio-sensor, we describe the use of the sensor to measure bioavail-able concentrations of arsenic in arsenic-contaminated ground-water samples obtained from the blackfoot disease region in Taiwan. The feasibility of using such a strain to analyze the bioavailability of pollutants in the environment is also dis-cussed.
MATERIALS AND METHODS
Materials
Sodium m-arsenite, sodium arsenate, cadmium chloride, cu-pric sulfate, cobalt chloride, mercuric chloride, manganese chloride, nickel chloride, ferrous sulfate, zinc chloride, sodium selenite, sodium selenate, potassium chromate, potassium per-manganate, and potassium hexahydroxoantimonate were pur-chased from Sigma (St. Louis, MO, USA). Lead nitrate and potassium antimonyl L-tartrate hydrate were obtained from Sigma-Aldrich (St. Louis, MO, USA). All chemicals used were of analytical reagent grade or better. All media and buffer solutions were prepared using deionized (Barnstead, Dubuque, IA, USA) distilled water. Restriction endonucleases and T4 DNA ligase were supplied from New England Biolabs (Bev-erly, MA, USA). The DNA polymerase used in polymerase chain reaction (PCR) was from Qiagen (Hilden, Germany). Construction of biosensor plasmid
Transcriptional fusions were constructed by directional cloning of the PCR-amplified promoter region DNA from plas-mid pI258 into the multiple cloning site of the promoterless rs-GFP plasmid pPROBE-NT9 [26]. Plasmid pI258 isolated from S. aureus (NCTC 50581; National Collection of Type Cultures, Colindale, London, UK) was used as a template for PCR to generate the DNA fragment consisting of the promoter/ operator of thearsR operon and arsR gene. The PCR primers were designed with eitherEcoRI (forward primer) or BamHI (reverse primer) recognition sequence extensions (underlined). Sequences of PCR primers were as follows: Forward, 5 9-CCGGAATTCTAAAATAACATAGACAATAATCT-39; and reverse, 59-CGCGGATCCCATCAACAGTCACCTGATT-39. The size of the target amplicon was 380 base pairs. The DNA amplification was carried out in an automated thermal cycler (Eppendorf, Hamburg, Germany) with a 5-min denaturation step at 948C, followed by 30 cycles of denaturation at 948C for 1 min, annealing at 558C for 1 min, and extension at 728C for 90 s. After 30 cycles, a final extension was performed at 728C for 15 min followed by a 48C incubation. The amplified PCR product was purified using a QIAquick PCR purification kit (Qiagen). The purified PCR-amplified DNA fragment was digested with EcoRI and BamHI and was purified from an agarose gel by QIAII gel extraction kit (Qiagen). Subsequently, the fragment was cloned into theEcoRI and BamHI sites of pPROBE-NT9. The resulting recombinant plasmid, pVLAS1 (Fig. 1), was transformed into E. coli DH5a by the CaCl2
competent cell method.
Cultivation of bacteria and induction of GFP fluorescence by effectors
A single colony ofE. coli harboring pVLAS1 was grown overnight in Luria-Bertani (LB) medium supplemented with
Fig. 1. Schematic organization of the biosensor plasmid pVLAS1. Plasmid harbors genes required for replication (rep) and mobilization (mob). The diagram is not drawn to scale. kmr 5 gene encoding
kanamycin resistance; T15 Escherichia coli rrnB rRNA T1 termi-nator; gfp5 green fluorescent protein.
50 mg/ml of kanamycin at 378C. The overnight culture was diluted 100-fold in fresh LB medium supplemented with 50
mg/ml of kanamycin and incubated at 378C in an orbital shaker
at 225 rpm until the optical density at 600 nm reached 0.6. Various concentrations of As(III), As(V), or Sb(III) were added to 20-ml aliquots of bacterial cultures. Optical density of cul-tures at 600 nm and the fluorescent intensity produced by the bacteria were measured. At least three independent experi-ments were performed for each effector.
Measurement of GFP fluorescence in culture
The transcriptional activity of the biosensor was estimated by the measurement of the GFP fluorescence of cells grown in LB medium containing a range of different metal ions. Cell growth was monitored by the measurement of optical density at 600 nm with a spectrophotometer (Eppendorf). The fluo-rescence of GFP-producing cells that were grown in culture was measured using a VersaFluor Fluorometer (Bio-Rad, Her-cules, CA, USA). The excitation wavelength of the fluorometer was set at 490/10 nm, and the emission wavelength was set at 510/10 nm.Escherichia coli DH5a carrying pPROBE-NT9 without the promoter/operator of the arsR operon and arsR gene was used as the baseline sample to zero the instrument. Raw fluorescence values were expressed in the instrument’s arbitrary relative fluorescent units. The specific fluorescence intensity (SFI) is defined as the raw fluorescence intensity expressed in relative fluorescence units divided by the optical density at 600 nm measured at each time point. At least trip-licate measurements were obtained for each sample.
Microscopic detection of biosensors
The fluorescence of the bacterial cells cultured in LB me-dium containing metal ions was visualized by analysis of dig-ital images captured with a Leica model DMIRB/E microscope (Leica Microsystems, Wetzlar, Germany) equipped for epifluo-rescence. The GFP fluorescence was detected with a GFP
En-dow filter set (Chroma Technology, Brattleboro, VT, USA) fitted with excitation (4806 20 nm) and emission (510 6 20 nm).
Selectivity studies
The induction of the sensing system by a variety of metal ions, including As(III), As(V), Sb(III), Sb(V), Cd(II), Co(II), Cu(II), Fe(II), Hg(II), Mn(II), Mn(VII), Ni(II), Pb(II), Sn(II), Zn(II), Cr(VI), Se(IV), and Se(VI), was studied by measuring the green fluorescence produced. The response of the bacterial biosensor to the mixtures of metal ions also was investigated. For each metal ion, 1mM was added to bacterial sensor culture at a cell density of 0.6 optical density at 600 nm. The cells were incubated for 2 h at 378C, and then the SFI was measured as described above. At least three independent experiments were performed for each kind of metal-ion and mixture-of-metal-ions assays.
Time-dependent induction of green fluorescence with effectors
A metal–bacteria mixture was obtained using the protocol described above. The mixture was incubated in an orbital shak-er at 225 rpm at 378C. Optical density at 600 nm and fluo-rescence were measured at the beginning of and after the de-sired incubation period. At least three independent experiments were performed for each effector.
Testing of contaminated groundwater
Groundwater samples were collected from wells YL6 and YL7, which are known to have arsenic contamination, in Yun-Lin County, Taiwan, Republic of China, in July 2003. The well water was tested by adding 500ml of groundwater sample to 250 ml of 63 concentrate of LB medium, 10 ml of LB medium, and 740 ml of DH5a cells harboring the pVLAS1 plasmid in LB medium at a cell density of 0.6 optical density at 600 nm. The cells were incubated for 2 h at 378C, and then the SFI was measured using the procedures described above. Samples containing known concentrations of As(III) in place of the 10-ml portion of LB medium were tested in parallel with 500 ml of deionized, distilled laboratory water in place of well water to generate a standard curve. The standard curve was derived from linear regression of the average fluorescence value at each particular As(III) concentration, and then the concentrations of As(III) in the groundwater samples were calculated from the standard curve. To examine possible in-hibitory effects on fluorescence resulting from chemicals other than the effector compounds in the groundwater sample, 4mM As(III) was added to the groundwater sample, and the green fluorescence emission was compared to that for a positive control containing the same concentration of As(III) in deion-ized water.
Data analysis
The experiments were performed at least three times for error analyses. The data were used to calculate the standard deviations, which are represented by error bars in the figures. Student’st test analysis at thea 5 0.05 level was performed to check results for significance. Standard curve fits were done by linear regression analysis.
RESULTS
Development of the bacterial biosensor
Thears promoter and the arsR gene of S. aureus plasmid pI258 were cloned into the broad-host-range vector
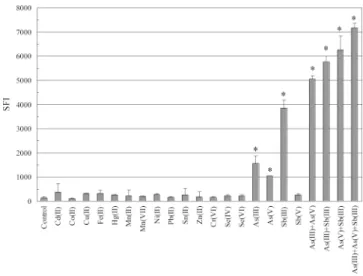
pPROBE-Fig. 2. Selectivity of the bacterial biosensor to metal ions. DH5a (pVLAS1) was treated with 1mM of various individual metal ions or mixtures of metal ions for 2 h. Fluorescence (in specific fluorescent intensity [SFI]) was measured with a fluorometer is defined as culture fluorescence divided by culture at a cell optical density at 600 nm. Fluorescence (in SFI) was measured as described inMaterials and Methods. Control refers to no-metal treatment biosensor bacteria. The data presented here are the mean values of three independent exper-iments with the standard deviations. *p, 0.05.
Fig. 3. Fluorescence of biosensor exposed to As(III). Expression of green fluorescent protein under control of thears promoter was in-duced by adding 1mM As (III) for 2 h at 378C in Luria-Bertani (LB) medium, after which green fluorescent protein expression in bacterial cells was visualized by using an Axiophot epifluorescence microscope. Images were captured by using a cooled charge-coupled device (CCD) camera. (A) Control (no As(III) treatment). (B) Bacterial cells treated with As(III). Left, visible microscopy; right, fluorescence microscopy. Magnification,31000.
NT9 [26] upstream from the gfp gene, creating a Pars–gfp
tran-scriptional fusion that was designated pVLAS1, as shown in Figure 1. The Pars–gfp fusion was flanked by T1 transcriptional
terminators from theE. coli rrnB1 operon to reduce the back-ground level of expression caused by external transcription, thereby increasing the sensitivity of the vector [26,27]. In the presence of an effector, recombinant plasmid pVLAS1 in strain DH5a resulted in a statistically significant increase in the fluo-rescence intensity relative to that of cells with no-effector con-trol.
Selectivity of biosensor to metal ions
The selectivity of the bacterial biosensor to metal ions was evaluated. The bacterial cells harboring pVLAS1 plasmid were treated with 1mM of various metal ions for 2 h before fluo-rescence measurements, as described inMaterials and Meth-ods. The levels of fluorescence of the sensing system subjected to these metal ions also are plotted in Figure 2. In our exper-imental treatments, a positive response was observed for As(III), As(V), and Sb(III). No statistically significant change in green fluorescence was observed for Sb(V), Cd(II), Co(II), Cu(II), Fe(II), Hg(II), Mn(II), Mn(VII), Ni(II), Pb(II), Sn(II), Zn(II), Cr(VI), Se(IV), and Se(VI) compared to the control, as shown in Figure 2. The response of biosensor to metal ions also was examined by fluorescence microscopy. Results of fluorescence microscopy demonstrated that noticeable GFP ex-pression was observed in the presence of As(III), As(V), and Sb(III) compared to that of the control (Fig. 3). The level of green fluorescence for cells treated with other metal ions other than the aforementioned metal ions was not significantly dif-ferent from that of control under microscopic examination.
Metal species in the environment often exist as mixtures. Therefore, the response of the bacterial biosensing system to the mixtures of the present metals was investigated. To ex-amine this potentially complex situation, we performed pair-wise metal assays with the biosensor. For each metal ion, 1
mM was combined in the same treatment. Additionally, the
response from mixtures of As(III), As(V), and Sb(III) also was examined. As shown in Figure 2, the bacterial biosensor ap-peared to have a synergistic response to As(III) and As(V), as they coexisted in the test solution. An additive response was observed by the combinations of As(III) and Sb(III), As(V) and Sb(III), and As(III) and As(V) and Sb(III) (Fig. 2). The level of green fluorescence for cells treated with metal com-binations other than the aforementioned comcom-binations was not significantly different from that of control or effector alone (data not shown).
Time-dependent induction of green fluorescence with effectors
The induction of the bacterial sensor in response to As(III), As(V), and Sb(III) ion was determined by incubating the cells with metal ions for various time intervals, as described in Materials and Methods. The induction of green fluorescence of the DH5a (pVLAS1) strain toward the exposure of these metal ions showed a time dependence (Fig. 4). As shown in Figure 4, the green fluorescence emitted by the bacteria in-creased as the incubation times with the metal ions inin-creased. The background fluorescence exhibited by the untreated bio-sensors did not have any statistically significant fluorescent change during the incubation period. The kinetic profile of the biosensor response showed that during the first 5 to 6 h of incubation, the SFI continuously increased from the back-ground value (Fig. 4).
Dose-dependent induction of green fluorescence with effectors
The dose–response relationship of DH5a cells harboring the pVLAS1 plasmid was examined for the effectors As(III), As(V), and Sb(III), as described inMaterials and Methods. The response of DH5a cells harboring the pVLAS1 plasmid toward As(III), As(V), and Sb(III) was time dependent, as described above. A 2-h induction time was chosen to plot dose–response curves, because it yielded a sufficiently high fluorescent signal while maintaining a relatively short assay
Fig. 4. Time-dependent induction of green fluorescence with effectors. The DH5a cells harboring the pVLAS1 plasmid were exposed to 4
mM As(III), As(V), or Sb(III), and the specific fluorescence intensity
(in SFI) was determined after different exposure periods. Fluorescence (in SFI) measured with a fluorometer is defined as culture fluorescence divided by culture at a cell optical density at 600 nm. The data pre-sented here are the mean values of three independent experiments with the standard deviations.
Fig. 6. Testing of contaminated groundwater by using the biosensor. Groundwater from arsenic-contaminated wells YL6 and YL7 in Yun-Lin County, Taiwan, Republic of China was tested for arsenic con-tamination as described inMaterials and Methods. Green fluorescence from DH5a cells harboring the pVLAS1 was measured at various As(III) concentrations to generate a standard curve. The standard curve was generated by linear regression, and the resulting equation (y5 1651.7x 1 42.887, r25 0.9966) was used to calculate the As(III)
equivalent concentration of the well water. The fluorescent response to groundwater from YL6 (black bar) and YL7 (white bar) is shown, as is the fluorescent response to different known As(III) concentrations (V). The data presented here are the mean values of three independent experiments with the standard deviations. SFI5 specific fluorescence intensity.
Fig. 5. Dose-dependent induction of green fluorescence by effectors. Fluorescence from DH5a cells harboring the pVLAS1 plasmid was determined after 2-h incubation with various concentrations of metal ions, as described inMaterials and Methods. Fluorescence (in specific fluorescence intensity [SFI]) measured with a fluorometer is defined as culture fluorescence divided by culture at a cell optical density at 600 nm. The data presented here are the mean values of three inde-pendent experiments with the standard deviations.
time. Plots of the dose–response relationships of the biosensor to these effectors as measured with a fluorometer are shown in Figure 5. The intensity of fluorescent signal emitted in-creased with the concentration of As(III), As(V), and Sb(III). At concentrations lower than the detection limit of an effector, binding ofarsR to the ars O/P sequence repressed transcription and translation of rs-GFP. For As(III), 0.4 mM As(III) was necessary to induce a statistically significant change (p, 0.05) of gfp expression. The intensity of GFP increased with in-creasing amount of As(III) to a concentration of 10mM. When the As(III) concentration increased to levels greater than 25
mM, the fluorescence started to decrease. This might be caused
by the toxicity of As(III) ions to the bacterial cells. For As(V), 1.0 mM was necessary to induce a statistically significant change (p , 0.05) of gfp expression, but 25 mM caused a maximumgfp induction. For Sb(III), the lowest concentration required to induce a statistically significant change (p, 0.05) of gfp expression was 0.75 mM. At 8 mM Sb(III), gfp ex-pression was induced to a maximal level. Toxic effects were noted for As(V) and Sb(III) at concentrations greater than 75 and 10 mM, respectively. The sensitivity of the biosensing system was contingent on the exposure time of the metals used for inducing the cells. When the induction time was increased to 8 h, the lowest detection limit for As(III), As(V), and Sb(III) was 0.1mM.
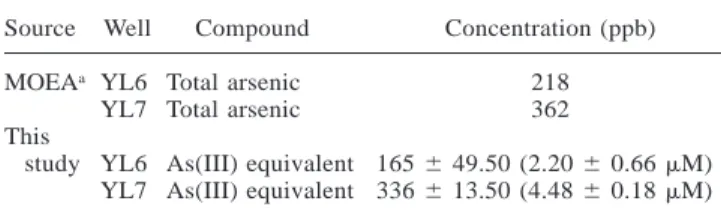
Testing of contaminated groundwater with the biosensor To demonstrate the utility of this biosensor in measuring actual environmental contamination, groundwater samples with a known contaminant concentration were examined, and the results of the biosensor assays were compared to these known concentrations. Groundwater was obtained from con-taminated wells in the blackfoot disease region of Yun-Lin County. These wells have been actively monitored for arsenic pollution by the Industrial Development Bureau of Ministry of Economic Affairs (MOEA) for the past 12 years. Two par-ticularly shallow wells, denoted as YL6 and YL7, respectively, have been reported to be contaminated principally with arsenic. Groundwater from wells YL6 and YL7 was tested by using the DH5a (pVLAS1) biosensor. The standard curve generated by this test is shown in Figure 6, and the resulting equation that was used to calculate the As(III) equivalent concentrations of the well water is shown. Water from YL6 and YL7 gave a SFI of 1,2526 364 (mean 6 standard deviation, n 5 3) and 2,5086 99, respectively. By calculating the contaminant con-centrations from the standard curve, 0.736 0.22 mM for YL6
Table 1. Comparison of contamination concentrations from the groundwater of YL6 and YL7 well in Yun-Lin County, Taiwan,
Republic of China
Source Well Compound Concentration (ppb) MOEAa YL6 YL7 Total arsenic Total arsenic 218 362 This study YL6 YL7 As(III) equivalent As(III) equivalent 1656 49.50 (2.20 6 0.66 mM) 3366 13.50 (4.48 6 0.18 mM)
aMOEA5 Ministry of Economic Affairs.
and 1.49 6 0.06 mM for YL7 were obtained. Taking the di-lution factor of the assay into account (see Materials and Methods), the final concentrations of contaminants in the groundwater were 2.206 0.66 mM for YL6 and 4.48 6 0.18
mM for YL7. Additionally, possible inhibitory effects that
might be caused by chemicals other than the effector com-pounds in the groundwater sample also were assessed by spik-ing the sample with a known concentration of As(III) (4mM). Subsequently, the total SFI was measured and then compared to that for a positive control containing the same concentration in deionized water. No inhibitory effect was detected. There-fore, it is unlikely that the constituents other than the effector compounds in the groundwater samples interfered with GFP fluorescence.
Table 1 compares the results of YL6 and YL7 water testing conducted by the MOEA with the biosensor assay. Same batch-es of the groundwater samplbatch-es were analyzed by the biosensor assay and the MOEA. The values obtained with the biosensor compare well to the data obtained by the MOEA.
DISCUSSION
Development of arsenic GFP-based bacterial biosensor In the present study, we describe the construction and test-ing of a GFP whole-cell biosensor for the measurement of bioavailable arsenic from contaminated groundwater. The sen-sor plasmid, designated as pVLAS1, is based on the expression of thegfp gene under the control of the ars promoter and the arsR gene of S. aureus plasmid pI258. Several bacterial bio-sensors for arsenic have been developed using various reporter genes, such as lacZ, luxAB, and luc [21–24]. Although the colorimetric enzyme assay and bioluminescence have been very successful as a reporter for arsenic detection, these meth-ods require the addition of exogenous substrates or cofactors. In addition, these assays require additional experimental steps before measuring signals. The gene for GFP from the jellyfish Aequoria victoria [25] is used increasingly as a reporter gene, although it has not been used extensively as a reporter for measuring biologically relevant concentrations of pollutants. The use of gfp as a reporter gene gives this biosensor the advantages associated with GFP, such as the ability to use fluorescence without the need for exogenous enzymes, sub-strates, or cofactors and the ability to use fluorometry and fluorescence microscopy to monitor gene expression for as-sessing the bioavailability of the metal, as well as providing a method that can be monitored noninvasively in living cells. Moreover, the use of GFP as a reporter protein in the bacterial biosensing system alleviates the need for extra experimental steps, such as centrifugation, cell lysis, pH adjustment, and subsequently, kinetic enzyme activity measurements. How-ever, on the other hand, one of the possible drawbacks with
measuring GFP in whole cells as it is being produced is that its chromophore forms slowly in the presence of molecular oxygen. As a consequence, any direct measurement is probably an estimate of the total GFP present, because a portion of the GFP in whole cells might not yet have become fluorescent. Characterization of DH5a (pVLAS1) biosensor
Induction patterns of DH5a (pVLAS1) differ slightly from those observed in other reports. Tauriainen et al. [24] tested the sensor plasmid with different host strains. They reported that the biosensor was strongly induced by As(III), Sb(III), and Cd(II) and only slightly induced by As(V) in both S. aureus RN4220 and Bacillus subtilis BR151. In contrast, As(III), Sb(III), Cd(II), and As(V) were not strong inducers usingE. coli MC1061 as host strain in their studies. Robust induction of fluorescence was observed for As(III), As(V), and Sb(III) from our studies, whereas Cd(II) was not an effective inducer to the biosensor under our experimental conditions. Because the bacterial sensor cells contain a chromosomally encoded arsenate reductase [28], they also react to As(V). The relative high sensitivity of DH5a (pVLAS1) for As(V) may result from the higher expression of chromosomal arsenate reductase enzyme ofE. coli [17]. Additionally, gfp might be a more sensitive reporter gene than luc, which was used in the study of by Tauriainen et al. The pattern of induction of DH5a (pVLAS1) was similar to those of other biosensor strains, which were developed from plasmid R773 inE. coli [21–23].
In addition to use of the host strains, it has been reported that several factors might influence the expression of biosen-sors. These include incubation time, medium composition, growth phase of harvested bacteria, and amount of bacteria per measurement [24]. In our studies, the sensitivity of the biosensor was not greatly affected by the growth phase of harvested bacteria or by the medium composition (data not shown). The effect of the induction time was investigated by incubating the bacteria with As(III), As(V), and Sb(III) for various time periods. The responses of the bacterial DH5a (pVLAS1) toward As(III), As(V), and Sb (III) were time de-pendent. With an increase in the induction time, the fluorescent intensity also increased. Moreover, the sensitivity of the system was contingent on the time used for inducing the cells. For example, for an induction period of 8 h, the bacteria could sense As(III), As(V), and Sb (III) at 0.1mM. When the in-duction period was reduced, we observed a decrease in the detection limits. Therefore, if very sensitive detection is need-ed, it could be achieved by employing longer incubation times. For assay development, a 2-h induction period was chosen, because the green fluorescent signal obtained during this time period was sufficiently high. Moreover, a 2-h incubation also allows complete formation of the GFP fluorophore.
The response of the bacterial sensing system toward metal ions was determined by incubating cells with metal ions for various concentrations before the assay, and subsequent dose– response curves were generated. The fluorescent intensity in-creased with increasing concentrations of As(III), As(V), and Sb(III) ions to a certain level. With concentrations lower than the detection limits, binding ofarsR to the ars O/P sequence repressed transcription and translation ofrs-GFP. Addition of As(III), As(V), and Sb(III) ions removed the repression of rs-GFP in the cells.
The minimum concentration of the effector required forgfp expression varies from one effector to another. For As(III), the
Table 2. Comparison of detection limits to As(III), As(V), and Sb(III) by biosensor bacteria
Strain Promoter Plasmid Reporter Induction time (h) Detection limit Reference
As(III) E. coliaMC1061 S. aureus RN4420 B. subtiliscBR151 E. coli JM109 E. coli DH5a S. aureusb(pl258) S. aureus (pl258) S. aureus (pl258) E. coli (R773) E. coli (R773) pT0031 pT0031 pT0031 pBGD23 pMV-arsR luc luc luc lacZ luxAB 2 2 2 17 1 3.3mM 0.1mM 3.3mM 0.1mM 0.1mM [24] [24] [24] [21] [23] E. coli DH5a E. coli DH5a E. coli DH5a E. coli DH5a E. coli (R773) E. coli (R773) S. aureus (pI258) S. aureus (pI258) pJAMA-arsR pPR-arsR pVLASI pVLASI lacZ gfp gfp gfp 1 1 2 8 0.1mM 0.1mM 0.4mM 0.1mM [23] [23] Present study Present study As(V) E. coli MC1061 S. aureus RN4420 S. aureus (pI258) S. aureus (pI258) pT0031 pT0031 luc luc 2 2 33mM 100mM [24] [24] B. subtilis BR151 E. coli JM109 E. coli JM109 E. coli DH5a E. coli DH5a S. aureus (pI258) E. coli (R773) E. coli (R773) S. aureus (pI258) S. aureus (pI258) pT0031 pBGD23 pBGD23 pVLASI pVLASI luc lacZ lacZ gfp gfp 2 2 17 2 8 330mM 10mM 1mM 1mM 0.1mM [24] [21] [21] Present study Present study Sb(III) E. coli MC1061 S. aureus RN4420 B. subtilis BR151 E. coli JM109 E. coli JM109 S. aureus (pI258) S. aureus (pI258) S. aureus (pI258) E. coli (R773) E. coli (R773) pT0031 pT0031 pT0031 pBGD23 pBGD23 luc luc luc lacZ lacZ 2 2 2 0.5 2 3.3mM 33 nM 330 nM 10mM 5mM [24] [24] [24] [21] [21] E. coli JM109 E. coli DH5a E. coli DH5a E. coli (R773) S. aureus (pI258) S. aureus (pI258) pBGD23 pVLASI pVLASI lacZ gfp gfp 17 2 8 0.1mM 0.75mM 0.1mM [21] Present study Present study aEscherichia coli. bStaphylococcus aureus. cBacillus subtilis.
minimum concentration required for As(III) detection obtained here was on the same order of sensitivity level as those of the similar biosensor systems [21,23,24]. Our results showed that the lowest detectable concentrations for As(III) with the DH5a (pVLAS1) were 0.4 and 0.1 mM with 2- and 8-h exposure, respectively. At higher As(III) concentrations, our results showed a statistically significant (p , 0.05) increase in fluo-rescent intensity, but at low concentration (,0.4 mM for 2 h and,0.1 mM for 8 h), the fluorescent intensity was not sta-tistically different (p. 0.05) from that of the As(III) negative control. For As(V), the detection limits obtained here are one to three orders of magnitude lower than those reported pre-viously in other cell-based sensing protocols for this metal ion [21,24]. Our results showed that the minimum concentration required for As(V) detection was 1 and 0.1mM with a 2- and 8-h induction period, respectively. The response obtained for Sb(III) ions was similar to those obtained for As(III) and As(V), and the detection limit for Sb(III) was 0.75 and 0.1
mM with a 2- and 8-h induction period, respectively. The
com-parison of bacterial biosensors responded to As(III), As(V), and Sb(III) is shown in Table 2. Several factors influence the sensitivity of the biosensor for the detection of these effectors. These include the exposure time, the ars plasmid used, the analytical detection method employed, the reporter gene used, and the choice of bacterial strains. Moreover, methods used to define a detection limit for detecting effectors vary among different researchers, which may contribute to slightly differ-ent values for the minimum detection limit.
Field testing environmental groundwater samples using a DH5a (pVLAS1) biosensor approach
The amount of arsenic contamination measured by the MOEA using atomic absorption spectrophotometry was
com-pared to those measured using the biosensor. For both wells, YL6 and YL7, the groundwater concentrations of As(III) equivalent estimated by the biosensor assay compared closely to those found in the MOEA report. The measured amount of As(III) equivalent by the biosensor assay was slightly lower than the arsenic concentration reported by MOEA. This finding is not unexpected, because the MOEA report measured the amount of total arsenic instead of As(III) concentration. Ad-ditionally, in contrast to the conventional chemicals analysis of total arsenic, the biosensor described here primarily mea-sured the bioavailable arsenic. Furthermore, adsorption of ar-senic to small particulates within groundwater samples may decrease the bioavailability of arsenic to the biosensor. Al-though the use of biosensor accurately measured the bioavail-able arsenic in the contaminated groundwater in the present study, it was not able to distinguish the arsenic species within the groundwater samples. However, As(III) is the major arsenic species of groundwater in shallow wells, including YL6 and YL7, in the blackfoot disease region of Yun-Lin County (Chen-Wuing Liu, Department of Bioenvironmental Systems Engi-neering, National Taiwan University, Taiwan, Republic of Chi-na, personal communication). Therefore, we are able to esti-mate the amounts of arsenic, mostly as As(III), from ground-water obtained from the shallow-wells YL6 and YL7 by using the derived standard curve of As(III).
In summary, we describe the construction, laboratory char-acterization, and environmental sample testing of a specific biosensor for the detection of As(III), As(V), and Sb(III). Moreover, the present study demonstrates that the nonpatho-genic DH5a (pVLAS1) is useful and applicable in determining the bioavailability of arsenic with high sensitivity in contam-inated groundwater samples. However, one potential limitation
with this method for the testing of environmental samples is that even though the sensitivities of the dose–response curve for As(III), As(V), and Sb(III) are different, we cannot distin-guish between these metals using this system. Moreover, in contaminated sites, many different chemicals other than the inducer compounds could be toxic to or interact withE. coli, thereby causing inhibitory effects. However, it is impossible to determine the effect of these chemicals, even if the chem-icals have been identified by chemical analysis because of the numerous potential combinations of these chemicals. Further-more, components of the environmental sample, such as high salt and high pH values, also could inhibit thegfp expression of the biosensor. Possible inhibitory effects can be addressed by adding a known amount of an optimal inducer (in this case, As(III)) to the unknown samples and then measuring induction differences. Despite these limitations, the bacterial biosensor based on pVLAS1-GFP represents a rapid, easy to perform, and inexpensive alternative to the conventional atomic ab-sorption spectroscopic method for arsenic detection and mea-surement. Additionally, because field samples often contain unidentified components, the biosensor can be useful in the screening of unknown contaminants in environmental samples because of its specific selectivity toward As(III), As(V), and Sb(III). Moreover, the GFP-based bacterial biosensor can be useful for environmental analysis, providing information about the bioavailability of metals, which is the most relevant in-formation when assessing the environmental and/or potential biological impact of a contaminant. It also can be useful for studying environmental conditions, which can influence metal bioavailability. Unfortunately, the issue of bioavailability is not easily addressed by the traditional analytical methods. Re-sults from chemical analysis are very precise, but the bio-availability of the metals is not taken into account. This is a particular concern with respect to toxic metals. Therefore, the bacterial biosensors complement rather than replace traditional analytical methods, providing critical data that can be useful in risk assessment and helpful in planning and evaluation of the remediation needs of arsenic-contaminated sites.
Acknowledgement—We express thanks to Chen-Wuing Liu at the De-partment of Bioenvironmental Systems Engineering, National Taiwan University, Taiwan, Republic of China, for assistance in obtaining groundwater samples and in providing results of contamination testing of water from YL6 and YL7. We thank Steven E. Lindow, University of California–Berkeley, California, USA, for providing the pPROBE-NT9 vector.
REFERENCES
1. Tchounwou PB, Wilson BA, Ishaque A. 1999. Important consid-erations in the development of public health advisories for arsenic and arsenic containing compounds in drinking water.Rev Environ Health 14:1–19.
2. Agency for Toxic Substances and Disease Registry. 2000. Tox-icological profile for arsenic. PB/2000/108021. U.S. Department of Health and Human Services, Public Health Service, Washing-ton, DC.
3. National Research Council. 1999. Arsenic in Drinking Water. National Academy Press, Washington, DC.
4. Abernathy CO, Liu YP, Longfellow D, Aposhian HV, Beck B, Fowler B, Goyer R, Menzer R, Rossman T, Thompson C, Waalkes M. 1999. Arsenic: Health effects, mechanisms of actions, and research issues.Environ Health Perspect 107:593–597.
5. Vahter M, Concha G. 2001. Role of metabolism in arsenic tox-icity.Pharmacol Toxicol 89:1–5.
6. Lerman SA, Clarkson TW, Gerson RJ. 1983. Arsenic uptake and metabolism by liver cells is dependent on arsenic oxidation state. Chem-Biol Interact 45:401–406.
7. Del Razo LM, Styblo M, Cullen WR, Thomas DJ. 2001. Deter-mination of trivalent methylated arsenicals in biological matrices. Toxicol Appl Pharmacol 174:282–293.
8. Flynn HC, Meharg AA, Bowyer PK, Paton GI. 2003. Antimony bioavailability in mine soils.Environ Pollut 124:293–100. 9. Filella M, Belzile N, Chen YW. 2002. Antimony in the
environ-ment: A review focused on natural waters. I. Occurrence. Earth-Sci Rev 57:125–176.
10. De Boeck M, Kirsch-Volders M, Lison D. 2003. Cobalt and an-timony: Genotoxicity and carcinogenicity. Mutat Res 533:135– 152.
11. Lintschinger J, Michalke B, Schulte-Hostede S, Schramel P. 1998. Studies on speciation of antimony in soil contaminated by in-dustrial activity.Int J Environ Anal Chem 72:11–25.
12. Patterson TJ, Ngo M, Aronov PA, Reznikova TV, Green PG, Rice RH. 2003. Biological activity of inorganic arsenic and antimony reflects oxidation state in cultured human keratinocytes. Chem Res Toxicol 16:1624–1631.
13. Kaur P, Rosen BP. 1992. Plasmid-encoded resistance to arsenic and antimony.Plasmid 27:29–40.
14. Rosen BP. 1999. The role of efflux in bacterial resistance to soft metals and metalloids.Essays Biochem 34:1–15.
15. Mukhopadhyay R, Rosen BP, Phung le T, Silver S. 2002. Micro-bial arsenic: From geocycles to genes and enzymes.FEMS Mi-crobiol Rev 26:311–25.
16. Owolabi JB, Rosen BP. 1990. Differential mRNA stability con-trols relative gene expression within the plasmid-encoded arsen-ical resistance operon.J Bacteriol 172:2367–2371.
17. Diorio C, Cai J, Marmor J, Shinder R, DuBow MS. 1995. An Escherichia coli chromosomal ars operon homolog is functional in arsenic detoxification and conserved in gram-negative bacteria. J Bacteriol 177:2050–2056.
18. Chen CM, Misra T, Silver S, Rosen BP. 1986. Nucleotide sequence of the structural genes for an anion pump. The plasmid-encoded arsenical resistance operon.J Biol Chem 261:15030–15038. 19. San Francisco MJD, Hope CL, Owolabi JB, Tisa L S, Rosen BP.
1990. Identification of the metalloregulatory element of the plas-mid-encoded arsenical resistance operon.Nucleic Acids Res 18: 619–624.
20. Ji G, Silver S. 1992. Regulation and expression of the arsenic resistance operon fromStaphylococcus aureus plasmid pI258. J Bacteriol 174:3684–3694.
21. Scott DL, Ramanathan S, Shi W, Rosen BP, Daunert S. 1997. Genetically engineered bacteria: Electrochemical sensing systems for antimonite and arsenite.Anal Chem 69:16–20.
22. Ramanathan S, Shi W, Rosen BP, Daunert S. 1997. Sensing an-timonite and arsenite at the subattomole level with genetically engineered bioluminescent bacteria.Anal Chem 69:3380–3384. 23. Stocker J, Balluch D, Gsell M, Harms H, Feliciano J, Daunert S,
Malik KA, van der Meer JR. 2003. Development of a set of simple bacterial biosensors for quantitative and rapid measurements of arsenite and arsenate in potable water.Environ Sci Technol 37: 4743–4750.
24. Tauriainen S, Karp M, Chang W, Virta M. 1997. Recombinant luminescent bacteria for measuring bioavailable arsenite and an-timonite.Appl Environ Microbiol 63:4456–4461.
25. Chalfie M, Tu Y, Euskirchen G, Ward WW, Prasher DC. 1994. Green fluorescent protein as a marker for gene expression.Science 263:802–805.
26. Miller WG, Leveau JHJ, Lindow SE. 2000. Improved gfp and inaZ broad-host-range promoter-probe vectors. Mol Plant-Mi-crobe Interact 13:1243–1250.
27. Simons RW, Houman F, Kleckner N. 1987. Improved single and multicopy lac-based cloning vectors for protein and operon fu-sions.Gene 53:85–96.
28. Carlin A, Shi W, Dey S, Rosen BP. 1995. The ars operon of Escherichia coli confers arsenical and antimonial resistance. J Bacteriol 177:981–986.