中國醫藥大學機構典藏 China Medical University Repository, Taiwan:Item 310903500/46202
37
0
0
全文
(2) 目錄 中文摘要 I 英文摘要 III 誌謝辭 IV 論文正文 第一章 前言 1 第一節 研究背景 Background 1 第二節 研究目的 AIM 3 第二章 研究方法 Methods 3 第一節 研究材料 3 第二節 研究設計 10 第三節 統計方法 Statistical analysis 17 第三章 研究結果 Results 17 第一節 描述性統計分析 17 第二節 推論性統計分析 18 第四章 討論 20 第一節 結果討論 Discussion 20 第二節 研究限制 Study limitations 23 第五章 結論與建議 Conclusion 23 第一節 結論 23 第二節 建議 23 參考文獻及附錄 Reference 24 圖表目次 Fig 1. Bi-ventricular pacemakers, (a) generator, (b) right ventricular lead, (c) right atrial lead, (d) left atrial lead 2 Fig 2. A Vivid 7 cardiac ultrasound machine 3 Fig 3. Tissue velocity indicates the speed at which a particular point in the myocardium moves toward or away from the transducer on the chest wall 5 Fig 4. A representative tissue velocity tracing contains isovolumic contraction (IVC), peak systolic velocity (Sm), isovolumic relaxation (IVR), early diastolic velocity (Em) and late diastolic velocity (Am) 5 Fig 5. Integration of tissue velocity over time results in displacement or the absolute distance moved by that point 6 Fig 6. Tissue Doppler–derived velocity can be acquired via 2-dimensional color.
(3) Doppler (left) or pulsed Doppler(right) 6 Fig 7. Radial velocity in the parasternal projections 7 Fig 8. This differential motion between base and apex results in a velocity gradient along the myocardial wall, with low or zero velocity at the apex and the highest velocities at the base 7 Fig 9. By TDI, strain rate is the difference in velocity (velocity gradient) between 2 points along the myocardial wall normalized to the distance between the 2 points 8 Fig 10. Because the endocardium moves faster than epicardium, the similar velocity gradient between the endocardium and the epicardium is used to derive radial strain rate 9 Fig 11. The interaction of ultrasound with the myocardium produces unique acoustic patterns, or “speckles.” These speckles can be tracked over time and speckle displacement used to derive tissue velocity and strain 10 Fig 12. The Left ventricular outflow tract (LVOT) time-velocity integral (TVI) 11 Fig 13. Total transmitral inflow TVI (left) and the mitral late diastolic inflow velocity A-wave TVI (right) 11 Fig 14. The diastolic filling period was defined from the onset of transmitral inflow to the subsequent R-wave in this study and was expressed as a percent of the entire cardiac cycle 12 Fig 15. A representative intra-cardiac electrocardiogram. AS= atrial sensing, VP= ventricular pacing, AP= atrial pacing 12 Fig 16. The atrial strain rate tracing comprises 3 waves. The systolic wave coincides with ventricular systole, the early diastolic wave coincides with passive atrial filling, and the late diastolic wave is produced by active atrial contraction. 15 Fig 17. In normal synchronous hearts, systolic tissue velocities of segments peak almost simultaneously 16 Fig 18. In dyssynchronous hearts, the lateral and/or posterior segments usually peak considerably later than the septum 16 Tab 1. Conventional Echocardigraphic Characteristics in CRT Tab 2. Atrial Mechanics: Regional Active Atrial Strain 18 Tab 3. Intra-Atrial and Interatrial Mechanics 19 Tab 4. Atrio-ventricular and Intraventricular Mechanics 19. 17.
(4) 中文摘要 目的:這研究的目的是評估心臟再同步治療中,心房與心室的功能與 機械協同。 背景:再同步治療中,右心房電刺激(right atrial pacing)會引起左心 房電氣與機械的不協同。右心房感應(right atrial sensing)與右 心房電刺激於再同步治療中,對左心室的影響及其差異的原理 尚未被完全闡明。 方法:55 位心衰竭合併再同步治療的病人(平均再同步治療時間 9± 12.5 月)與 22 位患有心律疾病合併雙腔心律調節器被納入研. 究,傳統與組織都卜勒(tissue Doppler)超音波用來測量心房 與心室的機械動力與血行動力。 結果:左心房出口(left ventricular outflow tract)的時間-速度積分(time -velocity integral)(22± 7cm vs. 20± 7cm, p= 0.001),舒張填充期. (468± 124ms vs. 380± 93ms p= 0.001),和全左心形變(global strain) (-32± 24% vs. -27± 22%, p= 0.001)均是右心房感應大於右心房電. 刺激;心房形變亦是右心房感應大於右心房電刺激,右心房形 變(-28.2± 8.6% vs. -22.6± 7.6%, p= 0.0007),心房中膈(-17.1± 6.5% vs. -13.2± 5.4%, p= 0.002),左心房(-16.4± 11.0% vs. -13.6± 8.5%, p= 0.02)。左心室機械協同程度沒有差異,但是心房機 I.
(5) 械協同是右心房感應優於右心房電刺激(31± 19ms vs. 42± 24ms, p= 0.0002)。. 結論:右心房感應方式較可以保留心房收縮功能及機械協同,因而形 成較好的左心室舒張灌流、左心室心輸出及左心室機械縮。這 種方式使心衰竭合併再同步治療得到最大的左心室輸出及血 行動力的好處。. II.
(6) 英文摘要 Objects: The purpose of this study was to evaluate atrial and ventricular function and synchrony in patients undergoing cardiac resynchronization therapy. Background: Right atrial pacing in cardiac resynchronization therapy induces dyssynchrony in electrical and mechanical activation of the left atrium. The impact of atrial sensing versus atrial pacing on left ventricular performance in cardiac resynchronization therapy and the underlying mechanisms leading to differences between these two pacing modes in cardiac resynchronization therapy have not been fully elucidated. Methods: Fifty-five patients with heart failure undergoing cardiac resynchronization therapy for 9± 12.5 months and 22 control subjects with dual pacemaker for conduction disorders were enrolled. Conventional and tissue Doppler echocardiography was performed to examine atrial and ventricular mechanics and hemodynamic status. Results: Left ventricular (LV) outflow tract time-velocity integral (22± 7 cm vs. 20± 7 cm, p= 0.001), diastolic filling period (468± 124 ms vs. 380± 93 ms, p= 0.001), and global strain (-32± 24% vs. -27± 22%, p= 0.001) were greater in atrial sensing compared with atrial pacing mode. Atrial strain was higher in atrial sensing compared with atrial pacing mode in the right atrium (-28.2± 8.6% vs. -22.6± 7.6%, p= 0.0007), interatrial septum (-17.1± 6.5% vs. -13.2± 5.4%, p= 0.002), and left atrium (-16.4± 11.0% vs. -13.6± 8.5%, p= 0.02). There was no difference in intra-ventricular dyssynchrony but significantly lower atrial dyssynchrony in atrial sensing compared with atrial pacing mode (31± 19 ms vs. 42 ± 24 ms, p= 0.0002). Conclusion: Atrial sensing is associated with preserved atrial contractility and synchrony, with the results of optimal LV diastolic filling, stroke volume, and LV systolic mechanics consequently. This pacing mode maximizes LV performance and the hemodynamic benefit of cardiac resynchronization therapy in patients with heart failure.. III.
(7) 誌謝辭. 首先感謝中國醫藥大學附設醫院黃秋錦副院長及心臟內科張坤 正主任同意讓我申請報考研究所並順利就讀。. 在就讀四年期間,特別感謝指導老師陳悅生教授耐心督促我的 進度及給予我悉心指導,而前研究所所長林清淵教授、現任所長藍先 元教授及李繼源教授亦常常給予我鼓勵,由衷謝謝他們的諄諄教誨。 此外,也感謝口試委員陳英富教授、林芬瓊副教授、陳悅生教授、施 子卿老師及黃志揚老師於論文口試時,給予寶貴建議與指正也令我獲 益匪淺。. 最後,感謝我的家人長期給予我精神支持與陪伴,讓我能無後 顧之憂的完成論文,謹以此篇論文獻給您們、謝謝您們。. 梁馨月 謹致 于 中國醫藥大學臨床醫學研究所 中華民國一零一年七月 IV.
(8) 論文正文 第一章 前言 第一節 研究背景 Background Cardiomyopathy refers to “diseases of the myocardium associated with cardiac systolic and diastolic dysfunction” by definition. [1] The etiology is diverse and is classified by underlying mechanism as dilated cardiomyopathy, hypertrophic cardiomyopathy, restrictive cardiomyopathy, arrhythmogenic right ventricular cardiomyopathy and infiltrative cardiomyopathy. Echocardiography is an easy tool to evaluate cardiac function in the clinical setting. Tracking of the endocardial border by visual or semiautomated methods provides estimates of cardiac volume, which are used to derive ejection fraction. Ejection fraction is calculated as difference between end diastolic volume and end systolic volume divided by end diastolic volume and is a quantitative indicator of ventricular function in the clinical setting. However, ejection fraction is influenced by preload, afterload and heart rate and unable to provide information on the underlying myocardial mechanical activity. In addition, ejection fraction reflects the sum contribution of the whole heart and does not provide information on regional function. The heart is a complex mechanical organ which undergoes cyclic changes in multiple dimensions (longitudinal, radial and circumferential directions) to result in chamber volume change with the consequent effect of ejection of blood. Regional function (regional wall motion) assessed visually by echocardiography is subjective and semi-quantitative with high inter-observer’s variability.[2] Mirsky and Parmley[3] used strain (deformation) to study the elastic properties of the myocardium in 1973. In experimental studies, quantification of regional myocardial mechanical activity (deformation) was assessed by use of markers attached directly to the myocardium, an invasive technique not practicable clinically.[4] Although tagged cardiac magnetic resonance imaging introduced the opportunity to track myocardial mechanics noninvasively in human studies, it is time-consuming and expensive.[5, 6] Conventional Doppler imaging by ultrasound allows measurement of high-velocity and low-intensity signal from blood flow in the chamber or lumen. Adjustment of the filter settings on pulsed Doppler to image low-velocity and high-intensity myocardial signal provides assessment of myocardial motion and deformation non-invasively by ultrasound. This 1.
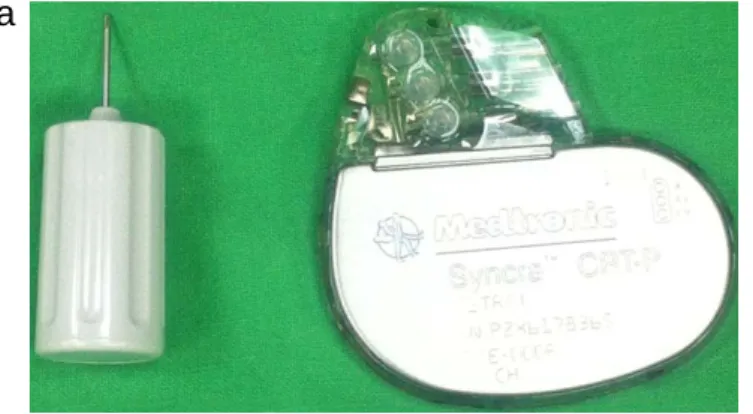
(9) technique is commonly referred to as tissue Doppler imaging (TDI) or Doppler myocardial imaging.[7] Cardiac resynchronization therapy (CRT) using bi-ventricular pacemakers (Fig 1) alleviates symptoms, improves functional capacity, induces reverse remodeling, and extends survival in patients with heart failure with conduction abnormalities on electrocardiogram (usually complete left bundle branch block), low ejection fractions, and advanced symptoms despite optimal medical therapy. [8, 9] Both ventricles are paced at a certain atrio-ventricular (AV) interval after atrial electric activity, either atrial sensing (AS) or atrial pacing (AP) in CRT. The prior hemodynamic studies in patients with conduction abnormalities, with and without CRT, have demonstrated that there is a finite range of AV delays during which cardiac output and left ventricular (LV) performance is optimal.[10, 11] Although differences in AV and inter-ventricular (VV) activation can be adjusted through device programming in CRT, only a right atrial pacing lead without a left atrial lead is inserted; thus, inter-atrial mechanical delays are not adjustable. Delays in electrical and mechanical activation of the left atrium induced by right atrial (RA) pacing in CRT have been demonstrated,[12-16]; however, the influence of AS versus AP on ventricular performance in CRT remains unclear. Furthermore, the underlying mechanisms of the differences between AS and AP in CRT have not been fully elucidated. Right ventricular pacing induces LV dyssynchrony and dysfunction, but it is plausible that a similar mechanism exists in the atria.[17] Fig 1. Bi-ventricular pacemakers, (a) generator, (b) right ventricular lead, (c) right atrial lead, (d) left atrial lead a. 2.
(10) b. d. c. 第二節 研究目的 AIM To better clarify the influence of AS versus AP in CRT, we prospectively examined atrial and ventricular mechanics and hemodynamic status, and AV coupling, using standard Doppler indexes and tissue Doppler imaging in heart failure patients undergoing CRT after the optimization of AV and VV delays. We hypothesized that AS allows superior LV hemodynamic status and performance by at least affecting atrial mechanics. 第二章 研究方法 Methods 第一節 研究材料 Echocardiography A Vivid 7 cardiac ultrasound machine (GE Healthcare, Milwaukee, Wisconsin) (Fig 2) with a 3.5-MHz transthoracic transducer was used. Echocardiographic examinations were performed with patients in the left lateral decubitus position. Frequency, depth and frame rate were adjusted to obtain adequate imaging quality. An apical 4-chamber view with tissue Doppler imaging and mitral pulsed-wave Doppler examination using a sample volume at the mitral leaflet tip were acquired. Pulsed Doppler of the LV outflow tract (LVOT) was acquired from an apical 5-chamber view. All off line analyzed was performed by EchoPAC BT07. Fig 2. A Vivid 7 cardiac ultrasound machine. 3.
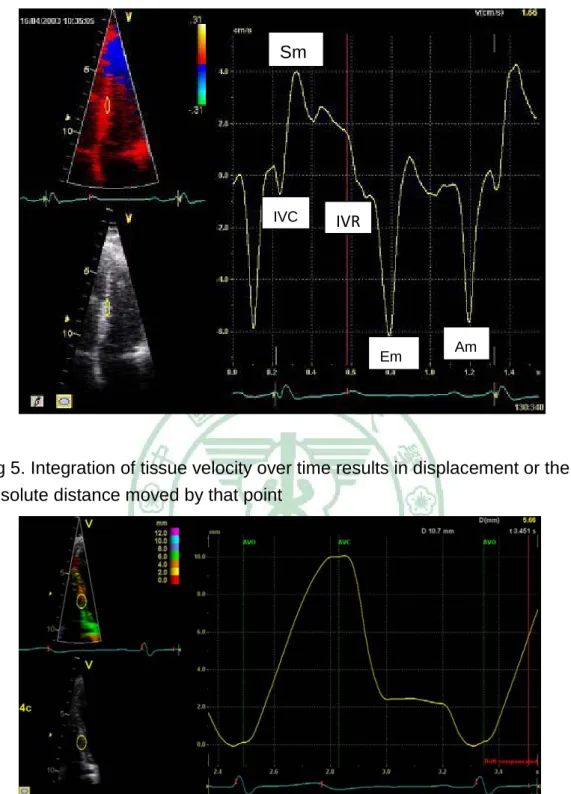
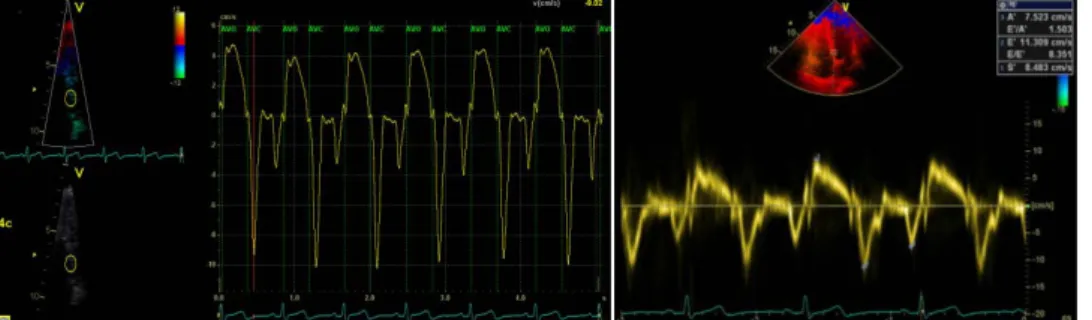
(11) Tissue Doppler Imaging The TDI method depicts myocardial motion (tissue velocity) at specific locations in the heart. Tissue velocity indicates the speed at which a particular point in the myocardium moves toward or away from the transducer on the chest wall (Fig 3). A representative tissue velocity tracing contains isovolumic contraction (IVC), peak systolic velocity (Sm), isovolumic relaxation (IVR), early diastolic velocity (Em) and late diastolic velocity (Am) (Fig 4). Integration of tissue velocity over time results in displacement or the absolute distance moved by that point (Fig 5). Because it is Doppler-based technique, the angle between the echo beam and direction of myocardial motion should be as small as possible. Tissue Doppler–derived velocity can be acquired via pulsed Doppler or 2-dimensional color Doppler (Fig 6).[7] Pulsed Doppler obtains tissue velocity by placing a sample volume at a particular location. Color Doppler obtains tissue velocity information from the entire sector, and multiple individual sites within the sector can be interrogated off-line simultaneously. Although both methods yield the same mechanical information, there is difference in the peak values. Pulsed Doppler measures peak velocity, whereas color Doppler measures mean velocity. Thus, tissue velocity measured by pulsed Doppler is 20% to 30% higher than one by color Doppler. This difference should be considered when one estimates left ventricular filling pressure using the E/e’ ratio.[18] Frame rates are higher with pulsed Doppler, and lowest with color Doppler TDI. Tissue Doppler has been validated extensively and examined in a variety of cardiac pathologies.[19, 20] 4.
(12) Tissue velocity in radial, circumferential and longitudinal directions can be analyzed by tissue Doppler imaging. Initial work reported tissue velocity from the septal or posterior wall in the parasternal projections (radial velocity) (Fig 7), and recent work almost exclusively interrogates tissue velocities in the longitudinal direction (apical projections). In the longitudinal direction, the base moves toward the apex in systole and away from the apex in diastole, whereas the apex is generally immobile.[21] This differential motion between base and apex results in a velocity gradient along the myocardial wall, with low or zero velocity at the apex and the highest velocities at the base (Fig 8). Because TDI indicates motion at a single point in the myocardium with reference point outside the chest (the transducer), it is influenced by translational motion of the whole heart and tethering by adjacent segments (normal apical segments pull an abnormal basal segment toward the apex). Moreover, single point interrogation (depicting tissue displacement) does not fully capture true myocardial mechanics. Fig 3. Tissue velocity indicates the speed at which a particular point in the myocardium moves toward or away from the transducer on the chest wall Probe Chest wall. Heart. Fig 4. A representative tissue velocity tracing contains isovolumic contraction (IVC), peak systolic velocity (Sm), isovolumic relaxation (IVR), early diastolic velocity (Em) and late diastolic velocity (Am). 5.
(13) Sm. IVC. IVR. Em. Am. Fig 5. Integration of tissue velocity over time results in displacement or the absolute distance moved by that point. Fig 6. Tissue Doppler–derived velocity can be acquired via 2-dimensional color Doppler (left) or pulsed Doppler(right). 6.
(14) Fig 7. Radial velocity in the parasternal projections. Fig 8. This differential motion between base and apex results in a velocity gradient along the myocardial wall, with low or zero velocity at the apex and the highest velocities at the base. Strain Rate and Strain. 7.
(15) Strain is a measure of tissue deformation and is defined as the change in length normalized to the original length. The speed at which this change occurs is called strain rate. Strain rate and strain are similar to shortening velocity and shortening fraction, respectively. Mirsky and Parmley[2] used strain (deformation) to study the elastic properties of the myocardium in 1973. By TDI, strain rate is the difference in velocity (velocity gradient) between 2 points along the myocardial wall normalized to the distance between the 2 points (Fig 9).[22] Because the endocardium moves faster than epicardium, the similar velocity gradient between the endocardium and the epicardium is used to derive radial strain rate (Fig 10).[23] This radial strain rate depicts the speed of change in myocardial wall thickness during systole and diastole. Thus, strain rate measures the rate at which the 2 points of interest in the myocardium move toward or away from each other. Integration of strain rate yields strain, the normalized change in length between these 2 points. In other words, tissue velocity is obtained by interrogating a single point in the myocardium with the reference point being the transducer on the chest wall. For strain rate, 2 points are interrogated in the myocardium. In the longitudinal and circumferential directions, the points move closer to each other in systole and away from each other in diastole. In the radial direction, the points move away from each other in systole and closer to each other in diastole. Theoretically, strain rate and strain are less susceptible to translational motion and tethering artifacts and thus may be superior to tissue velocity in depicting regional or global myocardial function.[24] Tissue Doppler–derived strain variables have been validated with gel phantoms,[25] isolated muscle preparations,[26] sonomicrometric crystals in whole hearts,[27] and tagged cardiac magnetic resonance imaging.[28] In general, peak systolic strain rate is the parameter that comes closest to measuring local contractile function in clinical cardiology. It is relatively volume independent and is less pressure independent than strain. In contrast, peak systolic strain is volume dependent and does not reflect contractile function as well. Fig 9. By TDI, strain rate is the difference in velocity (velocity gradient) between 2 points along the myocardial wall normalized to the distance between the 2 points. 8.
(16) SRe SRa. SRs. Fig 10. Because the endocardium moves faster than epicardium, the similar velocity gradient between the endocardium and the epicardium is used to derive radial strain rate. SRs. SRe SRa. Tissue Doppler-derived strain echocardiography can assess regional systolic and diastolic patterns[29] and track changes in early diastolic events related to regional ischemia.[30-33] However, this technique is limited by variability related to signal noise and influenced by the angle of insonation.[29] The interaction of ultrasound with the myocardium produces unique acoustic patterns, or “speckles.” These speckles can be tracked over time and speckle displacement used to derive tissue velocity and strain (Fig 11).[34] This speckle tracking method is relatively angle independent, because it is not based on the Doppler principle.[35] Speckle tracking imaging can use preexisting B-mode (2-dimensional)images; however, it is performed at much lower frame rates (40 to 90 frames per second) and may not be as accurate in 9.
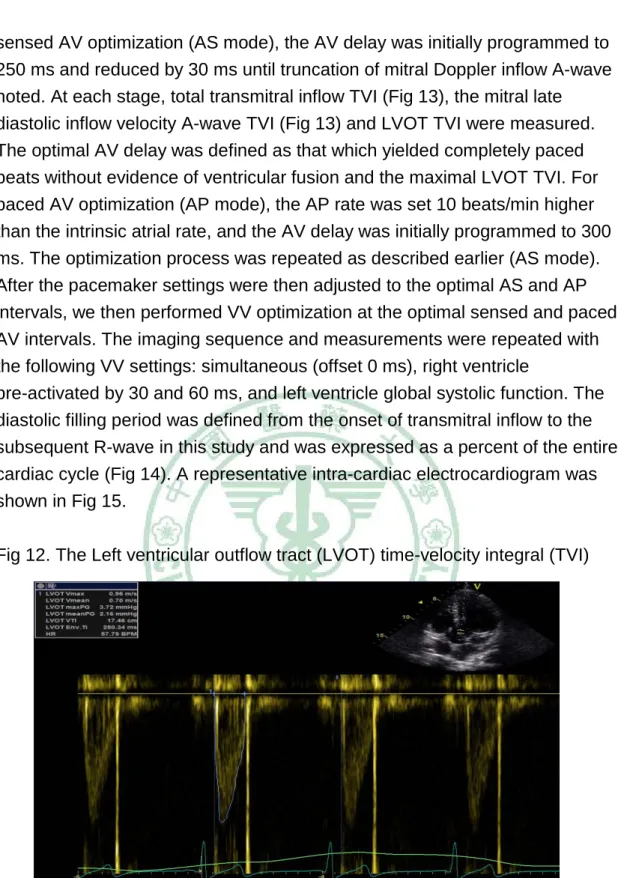
(17) timing mechanical events as Doppler-based imaging (100 to 250 frames per second). These 2-dimensional strain echocardiographic (2-DSE) methods offer a more reproducible and less time-consuming measurement of regional and global strain in several cardiac conditions.[36] Fig 11. The interaction of ultrasound with the myocardium produces unique acoustic patterns, or “speckles.” These speckles can be tracked over time and speckle displacement used to derive tissue velocity and strain. SRe SRa. SRs. 第二節研究設計 This study was approved by the institutional review board and all participants provided informed consent for this study. Seventy-two consecutive patients who had undergone the implantation of a CRT device and been referred for echocardiography-based optimization were enrolled. None of them was hospitalized within 3 months before this study. Patients with permanent atrial fibrillation or poor image quality (n= 17) were excluded, and analysis was performed on 55 subjects. We also enrolled 21 patients with dual-chamber pacemakers for conduction disorders but without heart failure as a control group. Optimization protocol All subjects underwent Doppler-based optimization of the AV delay and VV delay. The Left ventricular outflow tract (LVOT) time-velocity integral (TVI) (Fig 12) was used as the primary end point for optimization. Because the normal range of PR is within 200 ms, we started AV optimization from intrinsic ventricular capture on the intra-cardiac tracing using a device programmer. For 10.
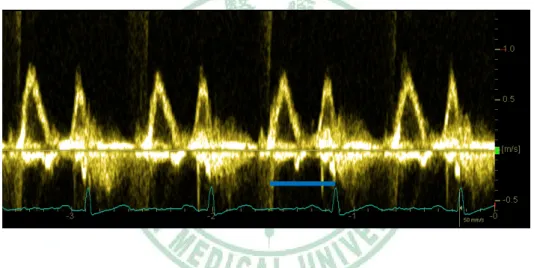
(18) sensed AV optimization (AS mode), the AV delay was initially programmed to 250 ms and reduced by 30 ms until truncation of mitral Doppler inflow A-wave noted. At each stage, total transmitral inflow TVI (Fig 13), the mitral late diastolic inflow velocity A-wave TVI (Fig 13) and LVOT TVI were measured. The optimal AV delay was defined as that which yielded completely paced beats without evidence of ventricular fusion and the maximal LVOT TVI. For paced AV optimization (AP mode), the AP rate was set 10 beats/min higher than the intrinsic atrial rate, and the AV delay was initially programmed to 300 ms. The optimization process was repeated as described earlier (AS mode). After the pacemaker settings were then adjusted to the optimal AS and AP intervals, we then performed VV optimization at the optimal sensed and paced AV intervals. The imaging sequence and measurements were repeated with the following VV settings: simultaneous (offset 0 ms), right ventricle pre-activated by 30 and 60 ms, and left ventricle global systolic function. The diastolic filling period was defined from the onset of transmitral inflow to the subsequent R-wave in this study and was expressed as a percent of the entire cardiac cycle (Fig 14). A representative intra-cardiac electrocardiogram was shown in Fig 15. Fig 12. The Left ventricular outflow tract (LVOT) time-velocity integral (TVI). Fig 13. Total transmitral inflow TVI (left) and the mitral late diastolic inflow velocity A-wave TVI (right). 11.
(19) Fig 14. The diastolic filling period was defined from the onset of transmitral inflow to the subsequent R-wave in this study and was expressed as a percent of the entire cardiac cycle. Fig 15. A representative intra-cardiac electrocardiogram. AS= atrial sensing, VP= ventricular pacing, AP= atrial pacing. 12.
(20) Cardiac Mechanics Tissue Doppler velocity and strain echocardiography have been extensively validated as accurately depicting regional myocardial motion and deformation, respectively. Strain has been demonstrated as being superior to tissue velocity in the assessment of regional and global function because of less influence of tethering and translation. [8, 37-39] Absolute strain values were used to assess regional and global ventricular function. [40] 1. Global Systolic Function The current standard for global systolic function by conventional echocardiography is the ejection fraction. However, ejection fraction is influenced by preload, afterload and heart rate and unable to reflect the intrinsic contractile. Peak mitral annular velocity closely correlates with dP/dTmax by invasive high-fidelity, micromanometer-tipped catheters in the left ventricular cavity and with angiographic and radionuclide ejection fraction.[41, 42] Normal values for tissue Doppler velocities have been established.[43, 44] A peak mitral annular descent velocity >5.4 cm/s averaged from 6 annular sites predicts an ejection fraction >50% with sensitivity of 88% and specificity of 97%. The peak mitral annular descent velocity from the apical 4-chamber view (average from inferoseptal and lateral sites) correlated most closely with the LV ejection fraction(r= 0.85) than other views.[41] Strain rate (r= 0.94, p<0.01) more closely correlates with invasively determined parameters of global function (peak elastance) than systolic tissue velocity (r= 0.75, p<0.01). [45] Thus, either of these techniques could potentially be used in lieu of ejection fraction to quantify global function. 13.
(21) 2. Regional Function Detection of myocardial ischemia by visual assessment of wall motion is semi-quantitative and fraught with variability and low reproducibility. [2] Wall motion can be quantified by TDI or strain echocardiography, respectively. Low systolic tissue velocities correlate with angiographic or echocardiographic wall motion abnormality.[46] Tissue velocities decrease with reduced regional perfusion, recover on reperfusion, and differentiate between transmural and nontransmural infarction.[47-49] Regional strain rates and strain are reduced in ischemia and infarction.[22, 50] Strain and strain rate identify infarcted segments and correlate with extent of transmural infarction shown by late-enhancement imaging with magnetic resonance imaging.[51] Strain and strain rate are less susceptible to cardiac translational motion and tethering. The term “tethering” is used to describe the dragging of an akinetic basal segment toward the apex by normally functioning mid or apical segments. This theoretical advantage of strain/strain rate was confirmed in a clinical model of septal ablation in patients with hypertrophic obstructive cardiomyopathy.[24] For the purposes of this study, global strain was defined as the sum of systolic strain in the lateral and septal walls in the apical 4-chamber view and used to assess LV global function using 2D speckle tracking method.[39] 3. Atrial Function Assessment of atrial function by conventional echocardiography is challenging because of thin wall. Strain echocardiography can be used to evaluate atrial systolic function. [52] Atrial strain and strain rate were measured in the right atrial (RA) free wall, inter-atrial septum (IAS), and left atrial (LA) free wall. The atrial strain rate tracing (Fig 16) comprises 3 waves. The systolic wave coincides with ventricular systole, the early diastolic wave coincides with passive atrial filling, and the late diastolic wave is produced by active atrial contraction and reflects atrial contractility. Modesto et al[52] demonstrated that strain parameters could provide a simple and quantitative assessment of atrial function in patients with amyloidosis. Atrial function has been examined with strain echocardiography in other conditions.[12, 53, 54] Patients with higher atrial strain and strain rate appear to have a greater likelihood of successful maintenance of sinus rhythm after cardioversion for atrial fibrillation.[55] 14.
(22) In this study, the atrial mechanical activation time was defined as the time from the peak of the atrial contraction wave to the subsequent R-wave. We used the electrocardiographic R-wave as the reference point of electric activity, because the R-wave is more easily recognized than the P-wave. Fig 16. The atrial strain rate tracing comprises 3 waves. The systolic wave coincides with ventricular systole, the early diastolic wave coincides with passive atrial filling, and the late diastolic wave is produced by active atrial contraction.. 4. Dyssynchrony Analysis Patients with low ejection fraction, conduction abnormality, and symptomatic heart failure despite optimal medical therapy experience significant benefits from cardiac resynchronization therapy. [8, 56] Several reports have shown a low concordance between electrical and mechanical synchrony.[57, 58] Mechanical dyssynchrony as determined by TDI may be superior to electrocardiography and M-mode by conventional echocardiography in predicting response to cardiac resynchronization therapy.[30, 59] Because TDI allows interrogation of the mechanical activity at high frame rate (Fig 17) so that an operator is able to time the onset, peak motion and end of every cardiac events, including systolic and diastolic events, at various locations in the heart. In normal synchronous hearts, systolic tissue velocities of segments peak almost simultaneously (Fig 17). In dyssynchronous hearts, the lateral and/or posterior segments usually peak considerably later than the septum (Fig 18), resulting in inefficient ejection. Dyssynchrony also occur in patients with conduction disorders undergoing 15.
(23) pacemaker implantation. Pacing of the delayed region earlier than intrinsic mechanical activity leads to more synchronized mechanical activity and improves ejection. Severe mechanical dyssynchrony may be recognized visually; however, milder forms are not detectable and in either case cannot be quantified. The longer mechanical delay between the normal (early) and late segments predicts better response to resynchronization.[60] Among several proposed indices of mechanical dyssynchrony, the criteria commonly used in clinical practice are (1) septal to lateral wall delay> 65 ms[30] and (2) the SD of time to peak systolic velocity of 12 segments> 33 ms.[61] The relative value of TDI versus strain/strain rate in predicting response to resynchronization has not been resolved fully.[62, 63] Fig 17. In normal synchronous hearts, systolic tissue velocities of segments peak almost simultaneously. Fig 18. In dyssynchronous hearts, the lateral and/or posterior segments usually peak considerably later than the septum. 16.
(24) In this study, atrial synchrony was defined as the time difference between atrial mechanical activation times at the RA and LA free walls and the inter-atrial septum. Ventricular synchrony was assessed by tissue Doppler imaging and strain echocardiography. Atrio-ventricular mechanical synchrony was defined as the time difference between atrial and ventricular walls. Strain echocardiography was analyzed using strain (offset) distances of 8 mm in the ventricles and 6 mm in the atria. Mean temporal resolution was 10 ms. Only tracings with clear and consistent systolic and diastolic peaks were analyzed. All time delays were corrected for heart rate using the Bazett formula (time delay in milliseconds normalized to the square root of the RR interval in seconds). 第三節 統計方法 Statistical analysis Data are expressed as mean SD or as frequencies. Paired t tests or Wilcoxon signed rank tests, depending on distribution, were used to compare data between AS and AP modes using JMP 7.0. A p value 0.05 was considered statistically significant. 第三章 研究結果 Results 第一節 描述性統計分析 We analyzed 55 of 72 enrolled patients with heart failure who had adequate-quality images and were not in atrial fibrillation (mean age 63.8± 13.3 years; 35 men). The mean duration of CRT was 9.0± 12.5 months at the time of enrollment. The detailed baseline echocardiographic characteristics of CRT patients in the AS and AP settings was shown in Tab1. Tab 1. Conventional Echocardigraphic Characteristics in CRT Atrial Sensing. Atrial Pacing. P value. Atrio-ventricular delay (ms). 126±19. 155± 20. < 0.0001. A-TVI (cm). 8.6± 3.0. 8.6± 3.1. 0.98. MV-TVI. 20.6± 6.5. 17.5± 5.1. < 0.001. LVOT-TVI (cm). 21.9± 7.0. 20.0± 6.7. < 0.001. MV-R time (ms). 468± 124. 380± 93. <0.001. Diastolic filling time (%). 49± 9. 43± 9. < 0.0001. (cm). 17.
(25) LA. EF(%). 52± 17. 50± 16. 0.19. LV EF (%). 27± 10. 26± 10. 0.02. Global strain of LV (%). -32.3± 24.2. -26.8± 22.2. 0.001. 第二節 推論性統計分析 We further compared the difference in conventional, tissue velocity and strain parameters between AS and AP settings. The mitral late diastolic inflow velocity A-wave TVIs were comparable between the two modes. The optimal AV interval was significantly shorter in AS compared with AP mode (126± 19 ms vs. 155± 20 ms, mean difference 29± 17 ms, p< 0.0001) (Tab 2). The optimal AV delay observed with AP was 30 ms longer than optimal AV delay with AS in 65% of the patients. Tab 2. Atrial Mechanics: Regional Active Atrial Strain Atrial Sensing. Atrial Pacing. P value. Right atrium (%). -28.2± 8.6. -22.6± 7.6. 0.0007. Interatrial septum(%). -17.1± 6.5. -13.2± 5.4. 0.002. Left atrium (%). -16.4 ± 11. -13.6± 8.5. 0.02. Right atrium (%). -29.0± 6.4. -25.6± 6.3. 0.0001. Interatrial septum(%). -16.0± 4.8. -13.6± 4.2. 0.0025. Left atrium (%). -15.2 ± 6.1. -13.6± 5.4. 0.0258. CRT. Control group. Compared with AP mode, almost all Doppler-based measures of ventricular hemodynamic performance were superior in AS. The LVOT TVI (21.9 7.0 cm vs. 20.0± 6.7 cm, p< 0.001), total trans-mitral inflow TVI (20.6± 6.5 cm vs. 17.5± 5.1 cm, p< 0.001), diastolic filling period (468± 124 ms vs. 380± 93 ms, p< 0.001), and global strain (-32.3± 24.2% vs. -26.8± 22.2%, p= 0.001) were greater in AS compared with AP mode. Differences in LV ejection fraction (0.27± 0.1 vs. 0.26± 0.1, p= 0.02) were statistically significant but numerically very close. We evaluated atrial mechanics, including atrial contractility and synchrony, to further investigate potential mechanisms underlying these LV hemodynamic differences. Active atrial strain (reflecting atrial contractility) was significantly higher in AS compared with AP mode in the right atrium (-28.2± 8.6% vs. -22.6± 7.6%, p= 0.0007), interatrial septum (-17.1± 6.5% vs. -13.2± 5.4%, p= 18.
(26) 0.002), and left atrium (-16.4± 11.0% vs. 13.6± -8.5%, p= 0.02). In the control group, active atrial strain was significantly higher in AS mode as well. There were significant differences in intra-atrial mechanical synchrony, measured using the atrial strain rate signal, between AS and AP modes. In the right atrium, the time delay from the RA free wall to the interatrial septum was shorter in AS compared with AP mode (27± 18 vs. 41± 26 ms, p< 0.001). Similarly, in the left atrium, the time delay from the interatrial septum to the LA free wall was shorter in AS compared with AP mode (31± 19 ms vs. 42± 24 ms, p= 0.0002). The inter-atrial synchrony (time delay from the RA to the LA free wall) was shorter in AS compared with AP mode (56± 34 ms vs. 80± 45 ms, p< 0.0001). In the control group, there were significant differences in intra-atrial and inter-atrial mechanical synchrony in AP mode as well (Table 3). Tab 3. Intra-Atrial and Interatrial Mechanics Atrial Sensing. Atrial Pacing. p-value. Delay in time to atrial contraction by strain rate (in ms) CRT RA to IAS. 27± 18. 42± 26. <0.001. RA to LA. 56± 34. 80± 45. <0.0001. IAS to LA. 31± 19. 42± 24. 0.0002. RA to IAS. 26± 15. 34± 11. 0.028. RA to LA. 59± 24. 78± 25. 0.0003. IAS to LA. 33± 14. 44± 21. 0.003. Control group. We subsequently assessed AV mechanical synchrony using atrial and ventricular strain signals. No significant differences were noted in the mechanical delay between the right atrium and right ventricle (p= 0.85), the inter-atrial septum and inter-ventricular septum (p= 0.62), and the left atrium and left ventricle (p= 0.70). Similarly, there was no difference in the degree of intra-ventricular dyssynchrony using either time to peak strain (p= 0.80) or time to peak systolic velocity (p= 0.39) between AS and AP modes (Table 4). Tab 4. Atrio-ventricular and Intraventricular Mechanics Atrial Sensing Delay in time to peak strain rate (in ms) 19. Atrial Pacing. p-value.
(27) RA to RV (ms). 302.2± 53.8. 298.6± 49.7. 0.85. IAS to IVS (ms). 301.6± 54.4. 304.5± 51.9. 0.62. LA. 279.7± 62.9. 277.9± 54.7. 0.70. 27.3± 91.5. 0.8. to LV (ms). Delay in time to peak strain (in ms) Sep to lat. 18.0± 62.5. Delay in time to peak systolic velocity (in ms) Sep to lat. -4.6± 71.2. 5.4± 66.1. 0.39. Inter-observer and intra-observer variability showed good agreement in the measurement of time delay (93% and 92%, respectively) and strain (97% and 96%, respectively). The limits of agreement for inter-observer and intra-observer variability in time delay ranged from 14.9 to 18.3 ms and from 11.4 to 12.6 ms, respectively. The limits of agreement for inter-observer and intra-observer variability in strain ranged from 7.9% to -9.7% and from 6.2% to -6.2%, respectively. 第四章 討論 第一節 結果討論 Discussion This study indicates several mechanical and hemodynamic issues which have a direct influence on the management of CRT device programming. First, we demonstrate that most patients (65%) have a difference of 30 ms in the optimal AV interval between AS and AP modes. We also demonstrate the presence of atrial mechanical dysfunction and dyssynchrony in AP mode in CRT patients and dual chamber pacemaker patients, using strain echocardiography. Last, we present hemodynamic and mechanical evidence indicating that these atrial mechanical abnormalities result in reduced trans-mitral filling and consequentially depressed global ventricular systolic strain and lower ventricular stroke volume in AP mode. These multiple lines of evidence suggest that AS-based pacing in CRT provides a more favorable mechanical and hemodynamic perfromance compared with AP. In a remodeled and dyssynchronous heart, cardiac resynchronization therapy corrects the mechanical inefficiency of delayed lateral wall contraction by earlier pacing, thereby improves dyssynchrony with the consequent result of increasing ventricular stroke volume.[8] In heart failure, remodeling develops not only in the ventricles but also in the atria. [64] Traditional pacing algorithms are such that only the right atrium is sensed and paced in CRT or 20.
(28) dual chamber pacemaker without manipulation in the left atrium. Pacing the RA appendage has been shown to significantly worsen inter-atrial conduction delay, as reflected by the prolonged P-wave duration on the surface electrocardiogram and longer inter-atrial conduction time on intra-cardiac electrograms. [12-15] Camous et al. [65] showed that paced inter-atrial conduction time was on average 50 msec longer than spontaneous inter-atrial conduction time. Inter-atrial conduction block is thought to be a marker of LA contractile dysfunction, with a linear relationship between the degree of electrical delay and the extent of LA dysfunction. [66] Cha et al. [16] recently showed an increased latency period of RA stimulation to LA contraction in the AP pacing mode. Goyal and Spodick [66] found an inverse correlation between P-wave duration and LA ejection fraction. Conventional Doppler and M-mode echocardiography have previously shown that RA pacing significantly increases inter-atrial mechanical delay. [13, 67] Given that Doppler signals are the result of net pressure gradients between the atrium and the ventricle, the timing of Doppler signals does not necessarily correspond to the timing of regional mechanical activation. In addition, M-mode echocardiography also has its limitations, because it can interrogate only a limited number of ventricular and/or atrial walls despite its high temporal resolution.[67] In contrast, tissue Doppler and strain imaging have high temporal (> 200 frames/s) and spatial resolution and depict regional mechanical events in real time of any segment of the heart.[24]Tissue velocity imaging has been used to demonstrate a significant increase in intra-atrial and inter-atrial asynchrony in patients with heart failure in sinus rhythm, compared with normal controls. [68] Also, a prolonged time delay of peak strain in atrial segments, suggestive of atrial dyssynchrony, has been documented during RA appendage pacing.[12] Our study used previously validated and sophisticated noninvasive techniques to compare atrial and atrio-ventricular mechanics and hemodynamic performances in 2 common modes of pacing in CRT. Our data indicate that significant atrial contractile abnormalities and intra-atrial and inter-atrial mechanical delays are present in AP compared with AS mode. Furthermore, Doppler data indicate that these atrial mechanical abnormalities result in suboptimal atrio-ventricular filling and LV stroke volume. The significance of LA contribution to LV filling and overall LV performance has been previously noted in animal and clinical studies.[69] In our study, AP resulted in a reduction of LV filling and stroke volume as reflected by lower total trans-mitral inflow TVI and LVOT TVI, respectively. A recent study by 21.
(29) Bernheim et al. [70] involving a small number of patients suggested that AP is suboptimal in CRT, because it induces intra-ventricular dyssynchrony. Although our study supports the contention that AS mode is superior to AP mode, our data are not fully concordant with this previous study, especially with regard to the possible mechanisms underlying the superiority of AS mode. Our study demonstrated similar dyssynchronous ventricular contraction, by tissue Doppler imaging and strain methods, in AS and AP modes. This is concordant with the prior study which demonstrated that atrial pacing reduced LV stroke volume without significant differences in regional LV strain in an animal study. [69] One potential reason for this discrepancy could be the difference in the method of optimization. We determined the optimal AV interval in both AS and AP modes on the basis of maximal LVOT TVI and avoided fusion beating, whereas Bernheim et al. used a fixed “pace compensation” of 40 ms plus the optimal AV interval in AS mode as the optimal AV delay in AP mode. Therefore, there is a possibility of fusion activation of the left ventricle by intrinsic and biventricular paced rhythms because of an inappropriately “long” AV interval, resulting in a loss of LV synchronization in AP mode in the study by Bernheim et al. [70] Our data are somewhat divergent from those of Gold et al. [71], who reported a mean AS to AP offset of 75 ms, compared with about 30 ms in our study. Also their data suggested that AP resulted in superior hemodynamic results compared with AS mode in CRT. The use of different end points (percent change in LV dP/dt in their study vs. stroke volume by echocardiography in ours) may partially explain these differences. Others have demonstrated that LV dP/dt and cardiac output measurements do not agree in heart failure models [72]. The mean difference in optimal AV delay in AS and AP modes in our study is concordant with other studies. [73] The additional mechanistic evaluation in our study supports our observation that AS mode is superior to AP mode, which agrees with that reported by Bernheim et al. [70] Although LV ejection fractions were statistically lower in the AP group, suggesting lower global LV systolic function, the absolute mean difference of 1% between the 2 pacing modes is not clinically meaningful. However, the more sensitive strain measurements demonstrate larger, statistically significant differences, indicating that LV systolic function is indeed lower in AP mode. Our data indicate that this difference in LV function is related to significant atrial systolic dysfunction and dyssynchrony, causing decreased atrial emptying and consequently reduced LV preload. In a failing human heart, the 22.
(30) Frank- Starling mechanism is well preserved in the isolated whole heart and an isolated muscle strip. However, the myocardium is considerably stiffer in heart failure compared with the normal heart.[74] Thus, the failing heart may be more sensitive to small changes in LV preload such as those induced by the atrial mechanical abnormalities and dyssynchrony noted in our study, suggesting that AS is the preferred pacing mode in CRT. 第二節研究限制 Study limitations This study was performed with patients at rest, and its findings may not hold true during activity. Because of time constraints, global LV strain was acquired in 6 representative segments in the 4-chamber view rather than all 16 segments of the left ventricle. Our global strain data, however, closely track changes in stroke volume and ejection fraction in our population. Although our data suggest AS as the preferred mode of pacing in CRT patients, sinus node dysfunction in heart failure may necessitate the use of AP. [62]There is a small theoretical possibility that some of the changes in atrial or ventricular performance can be attributed to the 10 beats/min difference in heart rate between the 2 pacing modes. We used the Bazett formula to adjust for any differences in heart rate between the 2 modes, realizing that the heart rate dependence of AV delays may not be well described by this formula. 第五章 結論與建議 Conclusion 第一節 結論 Intrinsic atrial activation during AS mode in CRT is associated with preserved atrial contractility and atrial synchrony, resulting in better LV diastolic filling, stroke volume, and LV systolic mechanics. This mode maximizes LV performance and the hemodynamic benefit of CRT in patients with heart failure. 第二節建議 Our data suggest that AS is the optimal mode of pacing in CRT.. 23.
(31) 參考文獻及附錄 Reference 1.. 2.. 3. 4.. 5. 6.. 7. 8. 9.. 10.. 11.. 12.. Richardson, P., et al., Report of the 1995 World Health Organization/International Society and Federation of Cardiology Task Force on the Definition and Classification of cardiomyopathies. Circulation, 1996. 93(5): p. 841-2. Hoffmann, R., et al., Analysis of interinstitutional observer agreement in interpretation of dobutamine stress echocardiograms. J Am Coll Cardiol, 1996. 27(2): p. 330-6. Mirsky, I. and W.W. Parmley, Assessment of passive elastic stiffness for isolated heart muscle and the intact heart. Circ Res, 1973. 33(2): p. 233-43. Waldman, L.K., Y.C. Fung, and J.W. Covell, Transmural myocardial deformation in the canine left ventricle. Normal in vivo three-dimensional finite strains. Circ Res, 1985. 57(1): p. 152-63. Axel, L. and L. Dougherty, MR imaging of motion with spatial modulation of magnetization. Radiology, 1989. 171(3): p. 841-5. Zerhouni, E.A., et al., Human heart: tagging with MR imaging--a method for noninvasive assessment of myocardial motion. Radiology, 1988. 169(1): p. 59-63. McDicken, W.N., et al., Colour Doppler velocity imaging of the myocardium. Ultrasound Med Biol, 1992. 18(6-7): p. 651-4. Abraham, W.T., et al., Cardiac resynchronization in chronic heart failure. N Engl J Med, 2002. 346(24): p. 1845-53. Linde, C., et al., Long-term benefits of biventricular pacing in congestive heart failure: results from the MUltisite STimulation in cardiomyopathy (MUSTIC) study. J Am Coll Cardiol, 2002. 40(1): p. 111-8. Hunt, S.A., et al., ACC/AHA guidelines for the evaluation and management of chronic heart failure in the adult: executive summary. A report of the American College of Cardiology/American Heart Association Task Force on Practice Guidelines (Committee to revise the 1995 Guidelines for the Evaluation and Management of Heart Failure). J Am Coll Cardiol, 2001. 38(7): p. 2101-13. Jansen, A.H., et al., Correlation of echo-Doppler optimization of atrioventricular delay in cardiac resynchronization therapy with invasive hemodynamics in patients with heart failure secondary to ischemic or idiopathic dilated cardiomyopathy. Am J Cardiol, 2006. 97(4): p. 552-7. Matsumoto, K., et al., Assessment of atrial regional wall motion using strain Doppler imaging during biatrial pacing in the bradycardia-tachycardia 24.
(32) 13.. 14.. 15. 16.. 17.. 18.. 19. 20.. 21. 22. 23.. 24.. 25.. syndrome. Pacing Clin Electrophysiol, 2006. 29(3): p. 220-5. Hermida, J.S., et al., Atrial septal versus atrial appendage pacing: feasibility and effects on atrial conduction, interatrial synchronization, and atrioventricular sequence. Pacing Clin Electrophysiol, 2003. 26(1 Pt 1): p. 26-35. Dabrowska-Kugacka, A., et al., Hemodynamic effects of alternative atrial pacing sites in patients with paroxysmal atrial fibrillation. Pacing Clin Electrophysiol, 2003. 26(1 Pt 2): p. 278-83. Ausubel, K., P. Klementowicz, and S. Furman, Interatrial conduction during cardiac pacing. Pacing Clin Electrophysiol, 1986. 9(6 Pt 2): p. 1026-31. Cha, Y.M., R.A. Nishimura, and D.L. Hayes, Difference in mechanical atrioventricular delay between atrial sensing and atrial pacing modes in patients with hypertrophic and dilated cardiomyopathy: an electrical hemodynamic catheterization study. J Interv Card Electrophysiol, 2002. 6(2): p. 133-40. Tops, L.F., et al., Speckle-tracking radial strain reveals left ventricular dyssynchrony in patients with permanent right ventricular pacing. J Am Coll Cardiol, 2007. 50(12): p. 1180-8. McCulloch, M., et al., Color tissue Doppler myocardial velocities consistently underestimate spectral tissue Doppler velocities: impact on calculation peak transmitral pulsed Doppler velocity/early diastolic tissue Doppler velocity (E/Ea). J Am Soc Echocardiogr, 2006. 19(6): p. 744-8. Fleming, A.D., et al., Assessment of colour Doppler tissue imaging using test-phantoms. Ultrasound Med Biol, 1994. 20(9): p. 937-51. Miyatake, K., et al., New method for evaluating left ventricular wall motion by color-coded tissue Doppler imaging: in vitro and in vivo studies. J Am Coll Cardiol, 1995. 25(3): p. 717-24. Rushmer, R.F., D.K. Crystal, and C. Wagner, The functional anatomy of ventricular contraction. Circ Res, 1953. 1(2): p. 162-70. Heimdal, A., et al., Real-time strain rate imaging of the left ventricle by ultrasound. J Am Soc Echocardiogr, 1998. 11(11): p. 1013-9. Uematsu, M., et al., Myocardial velocity gradient as a new indicator of regional left ventricular contraction: detection by a two-dimensional tissue Doppler imaging technique. J Am Coll Cardiol, 1995. 26(1): p. 217-23. Abraham, T.P., et al., Strain rate imaging for assessment of regional myocardial function: results from a clinical model of septal ablation. Circulation, 2002. 105(12): p. 1403-6. Belohlavek, M., V.B. Bartleson, and M.E. Zobitz, Real-time strain rate imaging: 25.
(33) 26.. 27.. 28.. 29.. 30.. 31.. 32.. 33.. 34.. 35.. 36.. 37.. validation of peak compression and expansion rates by a tissue-mimicking phantom. Echocardiography, 2001. 18(7): p. 565-71. Abraham, T.P., et al., Myocardial contractility by strain echocardiography: comparison with physiological measurements in an in vitro model. Am J Physiol Heart Circ Physiol, 2003. 285(6): p. H2599-604. Urheim, S., et al., Myocardial strain by Doppler echocardiography. Validation of a new method to quantify regional myocardial function. Circulation, 2000. 102(10): p. 1158-64. Edvardsen, T., et al., Quantitative assessment of intrinsic regional myocardial deformation by Doppler strain rate echocardiography in humans: validation against three-dimensional tagged magnetic resonance imaging. Circulation, 2002. 106(1): p. 50-6. Takemoto, Y., et al., Analysis of the interaction between segmental relaxation patterns and global diastolic function by strain echocardiography. J Am Soc Echocardiogr, 2005. 18(9): p. 901-6. Bax, J.J., et al., Left ventricular dyssynchrony predicts response and prognosis after cardiac resynchronization therapy. J Am Coll Cardiol, 2004. 44(9): p. 1834-40. Abraham, T.P., et al., Time to onset of regional relaxation: feasibility, variability and utility of a novel index of regional myocardial function by strain rate imaging. J Am Coll Cardiol, 2002. 39(9): p. 1531-7. Yip, G., et al., Strain echocardiography tracks dobutamine-induced decrease in regional myocardial perfusion in nonocclusive coronary stenosis. J Am Coll Cardiol, 2004. 44(8): p. 1664-71. Bleeker, G.B., et al., Relationship between QRS duration and left ventricular dyssynchrony in patients with end-stage heart failure. J Cardiovasc Electrophysiol, 2004. 15(5): p. 544-9. Leitman, M., et al., Two-dimensional strain-a novel software for real-time quantitative echocardiographic assessment of myocardial function. J Am Soc Echocardiogr, 2004. 17(10): p. 1021-9. Amundsen, B.H., et al., Noninvasive myocardial strain measurement by speckle tracking echocardiography: validation against sonomicrometry and tagged magnetic resonance imaging. J Am Coll Cardiol, 2006. 47(4): p. 789-93. Liang, H.Y., et al., Usefulness of two-dimensional speckle strain for evaluation of left ventricular diastolic deformation in patients with coronary artery disease. Am J Cardiol, 2006. 98(12): p. 1581-6. Skulstad, H., et al., Grading of myocardial dysfunction by tissue Doppler 26.
(34) 38. 39.. 40.. 41.. 42.. 43.. 44.. 45.. 46.. 47.. 48.. 49.. echocardiography: a comparison between velocity, displacement, and strain imaging in acute ischemia. J Am Coll Cardiol, 2006. 47(8): p. 1672-82. Abraham, T.P. and R.A. Nishimura, Myocardial strain: can we finally measure contractility? J Am Coll Cardiol, 2001. 37(3): p. 731-4. Ohte, N., et al., Evaluation of whole left ventricular systolic performance and local myocardial systolic function in patients with prior myocardial infarction using global long-axis myocardial strain. Am J Cardiol, 2004. 94(7): p. 929-32. Suffoletto, M.S., et al., Novel speckle-tracking radial strain from routine black-and-white echocardiographic images to quantify dyssynchrony and predict response to cardiac resynchronization therapy. Circulation, 2006. 113(7): p. 960-8. Gulati, V.K., et al., Mitral annular descent velocity by tissue Doppler echocardiography as an index of global left ventricular function. Am J Cardiol, 1996. 77(11): p. 979-84. Gorcsan, J., 3rd, et al., Quantitative assessment of alterations in regional left ventricular contractility with color-coded tissue Doppler echocardiography. Comparison with sonomicrometry and pressure-volume relations. Circulation, 1997. 95(10): p. 2423-33. Donovan, C.L., W.F. Armstrong, and D.S. Bach, Quantitative Doppler tissue imaging of the left ventricular myocardium: validation in normal subjects. Am Heart J, 1995. 130(1): p. 100-4. Palka, P., et al., Age-related transmural peak mean velocities and peak velocity gradients by Doppler myocardial imaging in normal subjects. Eur Heart J, 1996. 17(6): p. 940-50. Greenberg, N.L., et al., Doppler-derived myocardial systolic strain rate is a strong index of left ventricular contractility. Circulation, 2002. 105(1): p. 99-105. Gorcsan, J., 3rd, et al., Color-coded measures of myocardial velocity throughout the cardiac cycle by tissue Doppler imaging to quantify regional left ventricular function. Am Heart J, 1996. 131(6): p. 1203-13. Derumeaux, G., et al., Doppler tissue imaging quantitates regional wall motion during myocardial ischemia and reperfusion. Circulation, 1998. 97(19): p. 1970-7. Derumeaux, G., et al., Assessment of nonuniformity of transmural myocardial velocities by color-coded tissue Doppler imaging: characterization of normal, ischemic, and stunned myocardium. Circulation, 2000. 101(12): p. 1390-5. Derumeaux, G., et al., Tissue Doppler imaging differentiates transmural from nontransmural acute myocardial infarction after reperfusion therapy. 27.
(35) 50.. 51.. 52.. 53.. 54.. 55.. 56.. 57.. 58.. 59.. 60.. Circulation, 2001. 103(4): p. 589-96. Voigt, J.U., et al., Assessment of regional longitudinal myocardial strain rate derived from doppler myocardial imaging indexes in normal and infarcted myocardium. J Am Soc Echocardiogr, 2000. 13(6): p. 588-98. Weidemann, F., et al., Sequential changes of myocardial function during acute myocardial infarction, in the early and chronic phase after coronary intervention described by ultrasonic strain rate imaging. J Am Soc Echocardiogr, 2006. 19(7): p. 839-47. Modesto, K.M., et al., Left atrial myopathy in cardiac amyloidosis: implications of novel echocardiographic techniques. Eur Heart J, 2005. 26(2): p. 173-9. Sirbu, C., et al., Feasibility of strain and strain rate imaging for the assessment of regional left atrial deformation: a study in normal subjects. Eur J Echocardiogr, 2006. 7(3): p. 199-208. Di Salvo, G., et al., Strain rate imaging is a superior method for the assessment of regional myocardial function compared with Doppler tissue imaging: a study on patients with transcatheter device closure of atrial septal defect. J Am Soc Echocardiogr, 2005. 18(5): p. 398-400. Di Salvo, G., et al., Atrial myocardial deformation properties predict maintenance of sinus rhythm after external cardioversion of recent-onset lone atrial fibrillation: a color Doppler myocardial imaging and transthoracic and transesophageal echocardiographic study. Circulation, 2005. 112(3): p. 387-95. Bristow, M.R., et al., Cardiac-resynchronization therapy with or without an implantable defibrillator in advanced chronic heart failure. N Engl J Med, 2004. 350(21): p. 2140-50. Leclercq, C., et al., Systolic improvement and mechanical resynchronization does not require electrical synchrony in the dilated failing heart with left bundle-branch block. Circulation, 2002. 106(14): p. 1760-3. Bleeker, G.B., et al., Frequency of left ventricular dyssynchrony in patients with heart failure and a narrow QRS complex. Am J Cardiol, 2005. 95(1): p. 140-2. Yu, C.M., et al., Tissue Doppler echocardiographic evidence of reverse remodeling and improved synchronicity by simultaneously delaying regional contraction after biventricular pacing therapy in heart failure. Circulation, 2002. 105(4): p. 438-45. Bax, J.J., et al., Cardiac resynchronization therapy: Part 2--issues during and after device implantation and unresolved questions. J Am Coll Cardiol, 2005. 28.
(36) 61.. 62.. 63.. 64.. 65.. 66. 67. 68. 69.. 70.. 71.. 72.. 73.. 46(12): p. 2168-82. Yu, C.M., et al., Predictors of left ventricular reverse remodeling after cardiac resynchronization therapy for heart failure secondary to idiopathic dilated or ischemic cardiomyopathy. Am J Cardiol, 2003. 91(6): p. 684-8. Yu, C.M., et al., Tissue Doppler imaging is superior to strain rate imaging and postsystolic shortening on the prediction of reverse remodeling in both ischemic and nonischemic heart failure after cardiac resynchronization therapy. Circulation, 2004. 110(1): p. 66-73. Weidemann, F., B. Bijnens, and J.M. Strotmann, Letter regarding article by Yu et al, "Tissue Doppler imaging is superior to strain rate imaging and postsystolic shortening on the prediction of reverse remodeling in both ischemic and nonischemic heart failure after cardiac resynchronization therapy". Circulation, 2004. 110(19): p. e498-9; author reply e498-9. Khan, A., et al., The cardiac atria are chambers of active remodeling and dynamic collagen turnover during evolving heart failure. J Am Coll Cardiol, 2004. 43(1): p. 68-76. Camous, J.P., et al., Interatrial conduction in patients undergoing AV stimulation: effects of increasing right atrial stimulation rate. Pacing Clin Electrophysiol, 1993. 16(11): p. 2082-6. Goyal, S.B. and D.H. Spodick, Electromechanical dysfunction of the left atrium associated with interatrial block. Am Heart J, 2001. 142(5): p. 823-7. Wang, K., et al., Atrial electromechanical sequence in normal subjects and patients with DDD pacemakers. Br Heart J, 1995. 74(4): p. 403-7. Van Beeumen, K., et al., Intra- and interatrial asynchrony in patients with heart failure. Am J Cardiol, 2007. 99(1): p. 79-83. Hettrick, D.A., et al., Atrial pacing lead location alters the effects of atrioventricular delay on atrial and ventricular hemodynamics. Pacing Clin Electrophysiol, 2002. 25(6): p. 888-96. Bernheim, A., et al., Right atrial pacing impairs cardiac function during resynchronization therapy: acute effects of DDD pacing compared to VDD pacing. J Am Coll Cardiol, 2005. 45(9): p. 1482-7. Gold, M.R., et al., A prospective comparison of AV delay programming methods for hemodynamic optimization during cardiac resynchronization therapy. J Cardiovasc Electrophysiol, 2007. 18(5): p. 490-6. Fei, L., et al., Effects of multisite ventricular pacing on cardiac function in normal dogs and dogs with heart failure. J Cardiovasc Electrophysiol, 1999. 10(7): p. 935-46. Baker, J.H., 2nd, et al., Acute evaluation of programmer-guided AV/PV and VV 29.
(37) 74.. delay optimization comparing an IEGM method and echocardiogram for cardiac resynchronization therapy in heart failure patients and dual-chamber ICD implants. J Cardiovasc Electrophysiol, 2007. 18(2): p. 185-91. Holubarsch, C., et al., Existence of the Frank-Starling mechanism in the failing human heart. Investigations on the organ, tissue, and sarcomere levels. Circulation, 1996. 94(4): p. 683-9.. 30.
(38)
數據


+7


相關文件
Webots also contains a number of interfaces to real mobiles robots, so that once your simulated robot behaves as expected, you can transfer its control program to a real robot
臺大機構典藏NTUR (National Taiwan University 二 Repository, http://ntur.lib.ntu.edu.tw) 經驗與協助推 動臺灣學術機構典藏TAIR (Taiwan Academic Institutional Repository,
In addition, geometric engineering also suggests an absence of walls conjecture stating an equivalence between refined DT invariants of large radius limit stable objects of D b (X)
To proceed, we construct a t-motive M S for this purpose, so that it has the GP property and its “periods”Ψ S (θ) from rigid analytic trivialization generate also the field K S ,
After the Opium War, Britain occupied Hong Kong and began its colonial administration. Hong Kong has also developed into an important commercial and trading port. In a society
The entire moduli space M can exist in the perturbative regime and its dimension (∼ M 4 ) can be very large if the flavor number M is large, in contrast with the moduli space found
– The distribution tells us more about the data, including how confident the system has about its including how confident the system has about its prediction. It can
A waiting process only waits for a bounded number of processes to enter their critical sections... * All rights reserved, Tei-Wei Kuo, National Taiwan
