Refractive-index measurement based on the
effects of total internal reflection and the uses of
heterodyne interferometry
Ming-Horng Chiu, Ju-Yi Lee, and Der-Chin Su
A new method for measuring the refractive index is presented. First, the phase difference between s and
p polarizations that is due to the total internal reflection is measured by heterodyne interferometry.
Then, substituting this phase difference into the Fresnel equations, we can obtain the refractive index of the test medium. © 1997 Optical Society of America
1. Introduction
Refractive index is an important characteristic con-stant of optical materials. Although there are some techniques1–12 that have been proposed for measur-ing refractive index, almost all of them are related to the measurement of light intensity variations. However, the stability of a light source, the scattering light, the internal reflection, and other factors influ-ence the accuracy of measurements and decrease the resolution of results.
In this research a new method for measuring the refractive index is proposed. First, the phase dif-ference between s and p polarizations at the total internal reflection is measured by a heterodyne in-terferometric technique. Then it is substituted into Fresnel’s equations, and the refractive index of the test medium is obtained. It has several merits, including simple optical setup, easy operation, high stability, high measurement accuracy, and rapid measurement. We demonstrate its feasibility.
2. Principle
A. Phase Difference Resulting from Total Internal Reflection
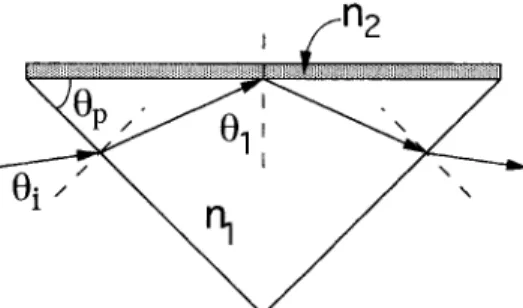
A ray of light in air is incident atuion one side surface
of an isosceles prism with refractive index n1 and base angle up, as shown in Fig. 1. The light ray is
refracted into the prism and it propagates toward the base surface of the prism. At the base surface of the prism there is a boundary between the prism and the test medium of refractive index n2where n1 . n2. If the angle of incidence at the boundary is u1, we have
u15 up1 sin21
S
sinui n1
D
. (1)
Here the signs ofu1anduiare defined as positive if
they are measured clockwise from a surface normal. If u1 is larger than the critical angle, the light is totally reflected at the boundary. According to Fresnel’s equations, the amplitude reflection coeffi-cients of s and p polarizations can be expressed as13
rs5
cosu12 i~sin2u12 n2!1y2 cosu11 i~sin2u12 n2!1y2
5 exp~ids!, (2) rp5 2 n2cosu 12 i~sin2u12 n2!1y2 n2cosu11 i~sin 2 u12 n 2 !1y25 exp~idp!, (3)
respectively, where n 5 n2yn1. Hence the phase difference of s polarization relative to p polarization is f 5 ds2 dp5 2 tan21
F
~sin2u 12 n2!1y2 tanu1sinu1G
. (4)The authors are with the Institute of Electro-Optical Engineer-ing, National Chiao Tung University, 1001 Ta-Hsueh Road, Hsin-chu, Taiwan 30050, China.
Received 13 August 1996. 0003-6935y97y132936-04$10.00y0 © 1997 Optical Society of America
Substituting Eq.~1! into Eq. ~4!, we have
which can be rewritten as
n5 sin@up1 sin21~sin uiyn1!# 3
H
12 tan2S
f 2D
tan 2@u p1 sin21~sin uiyn1!#J
1⁄2 . (6) It is obvious from Eq. ~6! that n2 can be calculated with the measurement of phase difference f under the experimental conditions in which ui, up, and n1 are specified.B. Phase Difference Measurements with a Heterodyne Interferometric Technique
Shyu et al.14 proposed a method for measuring the phase retardation of a wave plate by using a hetero-dyne interferometric technique. The schematic dia-gram of the optical arrangement of our method, which is based on similar considerations, is designed and shown in Fig. 2~a!. The linearly polarized light passing through an electro-optic modulator EO is in-cident on a beam splitter BS and divided into two parts: the reference beam and the test beam. The reference beam is reflected from BS and passes through an analyzer ANr, then enters the
photode-tector Dr. If the amplitude of light detected by Dris
Er, then the intensity measured by Dr is Ir 5 uEru
2 . Here Iris the reference signal. On the other hand
the test beam is transmitted through BS and enters a prism. It is totally reflected at the boundary be-tween the prism and the test medium; then it prop-agates out of the prism. Finally it passes through an analyzer ANtand is detected by another
photodetec-tor Dt. If the amplitude of the test beam is Et, then
Dt measures the intensity It 5 uEtu
2
. And It is the
test signal.
For convenience the 1z axis is in the propagation direction and the y axis is in the vertical direction.
Let the incident light be linearly polarized at 45° with respect to the x axis, the fast axis EO under an ap-plied electric field be in the horizontal direction, and both the transmission axes ANr and ANt be at 45°
with respect to the x axis. If a sawtooth signal of an angular frequency w and an amplitude Vly2, the half-wave voltage of the EO, is applied to the electro-optic modulator, then by using the Jones calculus we can get
Ir5 1y2@1 1 cos~wt 1 fr!#, (7) It5
I0
2 @1 1 cos~wt 1 f!#, (8)
which are similar to the derivations obtained by Shyu
et al.14 In Eqs. ~7! and ~8!, f
randf are the phase
differences between s and p polarizations owing to the reflection at BS and the total internal reflection in the prism, respectively; and I0is the intensity of the test beam relative to the reference beam. These two si-nusoidal signals are sent to the phase meter as shown in Fig. 2~a!. The phase difference between the ref-Fig. 1. Total internal reflection at the boundary between a prism
and a test medium.
Fig. 2. Schematic diagrams for measuring the phase difference owing to~a! the total internal reflection and ~b! the reflection at BS: EO, electro-optic modulator; BS, beam splitter; AN, analyzer; D, photodetector.
f~n, ui! 5 2 tan21
(
$sin2@u
p1 sin21~sin uiyn1!# 2 n2%1y2
tan@up1 sin21~sin uiyn1!#sin@up1 sin21~sin uiyn1!#
)
, (5)
erence signal and test signal,
f9 5 f 2 fr, (9)
can be obtained. In the second measurement let the test beam enter the photodetector Dtwithout passing
through the total internal reflection in the prism, as shown in Fig. 2~b!. The test signal still has the form of Eq. ~8! but this time with f 5 0. Therefore the phase meter in Fig. 2~b! represents 2fr.
Substi-tuting 2frinto Eq.~9! we can obtain the phase
dif-ferencef. Finally, by using Eq. ~6!, we can evaluate the refractive index of the test medium with high accuracy.
3. Experiments and Results
To show the feasibility of this technique, the refrac-tive indices of air, pure water, and index-matching
oil were measured. A He–Ne laser with a
632.8-nm wavelength and an electro-optic modula-tor ~Model PC200y2, manufactured by England Electro-Optics Developments Ltd.! with a half-wave voltage of 170 V were used in this test. The fre-quency of the sawtooth signal applied to the electro-optic modulator was 2 kHz. A high-precision rotation stage~PS-u-90! with the angular resolution of 0.005° manufactured by Japan Chuo Precision Industrial Company Ltd. was used to mount the prism. For easier operation a right-angle prism made of SF11 glass with a 1.77862 refractive index was used, andui5 22°, 14°, and 30° were chosen for
air, pure water, and index-matching oil, respec-tively. In these conditions the phase differences of air, pure water, and index-matching oil were mea-sured to be 62.58°, 29.00°, and 16.00°, respectively. After introducing these data into Eq. ~6! we ob-tained the refractive indices of these samples as 1.0003, 1.332, and 1.508, respectively.
Moreover the theoretical and the experimental curves off versus uifor these three media are shown
in Fig. 3. In the figure the dotted curves represent the theoretical values that we obtained by introduc-ing the above refractive indices into Eq.~5!, and the circles represent the experimental results. It is clear that these three curves show good correspon-dence.
4. Discussion
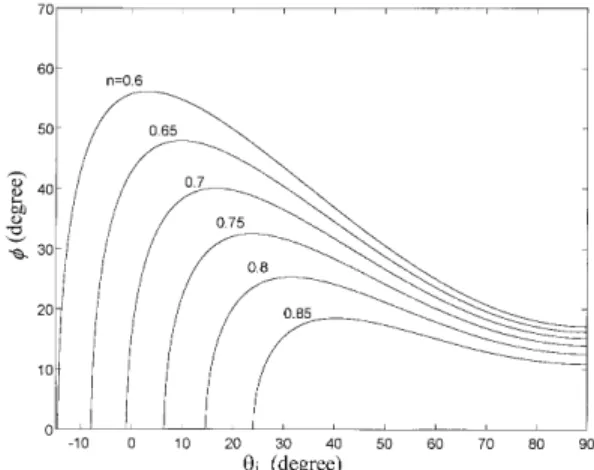
The measurable range of this technique is limited by the refractive index of the prism. To expand the measurable range it is better to use a prism with a high refractive index. Figure 4 shows the relation curves of f versus ui for several different relative
refractive indices n from Eq.~5!. From these curves it is obvious that the resolution of this technique depends on not only the angular resolution of the phase meter but also the angle of incidenceuiand the
relative refractive index n. To avoid the influence of the measurement error of ui, it is better to operate
this technique in the condition dfydui5 0 where the
slope of the curve is at horizontal, i.e., f is at maxi-mum. In this condition from Eq.~6! we have
Dn >dn df3 Df, (10) and dn df5 21 2
S
12 tan2S
f 2D
tan 2u 1D
1y2 3 tanS
f 2D
sec 2S
f 2D
sinu1tan 2u 1, (11)where Dn and Df are the errors in the relative re-fractive index and the phase difference, respectively. In fact the main source of error comes from the devi-ation angleuRbetween the polarization direction of p
polarization of the incident beam and the incidence plane of the total internal reflection in the prism. And it introduces an error in the phase difference,15
Df 5tanf~sec 2uR2 1!
11 sec 2uRtan2f
, (12)
into f. Combining Eqs. ~5!, ~10!, ~11!, and ~12! we obtain the relation curves ofDn versus n for several differentuRas shown in Fig. 5. It can be eliminated
by improving the optical alignment as follows. First, let the test medium be air, and its refractive Fig. 3. Theoretical and experimental curves off versus uifor air,
water, and index-matching oil.
Fig. 4. Relation curves off versus uifor several different n.
index can be evaluated with the Edle´n equation.16 Next, substituting the experimental and theoretical data into Eq. ~12! we can calculate uR. Finally, a
half-wave plate is inserted into the optical setup to correct the polarization angle of the input light. In our experiments, when a phase meter with 0.01° res-olution is used to measure these media in ideal ex-perimental conditions, the resolutions of our results are better than 1.03 1023.
Owing to its common path configuration our sys-tem has high stability against air turbulence and environmental vibrations. Because it measures the phase difference instead of the light intensity, it is free of the influences from the instability of a light source and the scattered light. Furthermore it has a better resolution.
5. Conclusion
A new method for measuring the refractive index is proposed. First, the phase difference between s and
p polarizations at the total internal reflection is
mea-sured by the heterodyne interferometric technique. Then it is substituted into Fresnel’s equations, and the refractive index of the test medium is obtained. The method has several merits such as simple optical setup, easy operation, high stability, high measure-ment accuracy, and rapid measuremeasure-ment. Its feasi-bility has been demonstrated.
This study was supported in part by the National Science Council, Taiwan, China, under contract NSC85-2215-E009-005.
References
1. P. R. Jarvis and G. H. Meeten, “Critical-angle measurement of refractive index of absorbing materials: an experimental study,” J. Phys. E 19, 296 –298~1986!.
2. R. Ulrich and R. Torge, “Measurement of thin film parameters with a prism coupler,” Appl. Opt. 12, 2901–2908~1973!. 3. H. Ringneault, F. Flory, and S. Monneret, “Nonlinear
total-ly reflecting prism coupler: thermomechanic effects and intensity-dependent refractive index of thin films,” Appl. Opt.
34, 4358 – 4369~1995!.
4. S. T. Kirsch, “Determining the refractive index and thickness of thin films from prism coupler measurements,” Appl. Opt. 20, 2085–2089~1981!.
5. M. Akimoto and Y. Gekka, “Brewster and pseudo-Brewster angle technique for determination of optical constants,” Jpn. J. Appl. Phys. 31, 120 –122~1992!.
6. S. F. Noe and H. E. Bennett, “Accurate null polarimetry for measuring the refractive index of transparent materials,” J. Opt. Soc. Am. A 10, 2076 –2083~1993!.
7. R. M. A. Azzam, “Maximum minimum reflectance of parallel-polarized light at interfaces between transparent and absorb-ing media,” J. Opt. Soc. Am. 73, 959 –962~1983!.
8. H. Kitajima, H. Hieda, and Y. Suematsu, “Use of a total ab-sorption ATR method to measure complex refractive indices of metal-foils,” J. Opt. Soc. Am. 70, 1507–1513~1980!.
9. L. Le`vesque, B. E. Paton, and S. H. Payne, “Precise thickness and refractive index determination of polyimide films using attenuated total reflection,” Appl. Opt. 33, 8036 – 8040 ~1994!.
10. H. Wang, “Determination of optical constants of absorbing crystalline thin films from reflectance and transmittance mea-surements with oblique incidence,” J. Opt. Soc. Am. A 11, 2331–2337~1994!.
11. U. Beak, G. Reiners, and I. Urban, “Evaluation of optical prop-erties of decorative coating by spectroscopic ellipsometry,” Thin Solid Films 220, 234 –240~1992!.
12. R. M. A. Azzam, “Simple and direct determination of complex refractive index and thickness of unsupported or embedded thin films by combined reflection and transmission ellipsom-etry at 45° angle of incidence,” J. Opt. Soc. Am. 73, 1080 –1082 ~1983!.
13. M. Born and E. Wolf, Principles of Optics, 6th ed.~Pergamon, Oxford, UK, 1980!, pp. 48–50.
14. L. H. Shyu, C. L. Chen, and D. C. Su, “Method for measuring the retardation of a wave plate,” Appl. Opt. 32, 4228 – 4230 ~1993!.
15. J. M. De Freitas and M. A. Player, “Importance of rotational beam alignment in the generation of second harmonic error in laser heterodyne interferometry,” Meas. Sci. Technol. 4, 1173– 1176~1993!.
16. K. P. Birch and M. J. Downs, “An updated Edle´n equation for the refractive index of air,” Metrologia 30, 155–162~1993!. Fig. 5. Relation curves ofDn versus n for several different uR.