L
Journal of Alloys and Compounds 297 (2000) 294–302
www.elsevier.com / locate / jallcom
Martensitic transformation of a Ti-rich Ti
40.5Ni
49.5Zr
10shape memory
alloy
a ,
*
bS.K. Wu
, S.F. Hsieh
a
Institute of Materials Science and Engineering, National Taiwan University, Taipei, Taiwan 106, ROC b
Dept. of Mold and Die Engineering, National Institute of Science and Technology, Kaohsiung, Taiwan 807, ROC Received 6 February 1999; accepted 13 September 1999
Abstract
Ti40.5Ni49.5Zr10 alloy undergoes a B2↔B199 one-stage martensitic transformation with Ms¯1008C. This alloy exhibits about 90%
shape memory recovery even though many (Ti,Zr) Ni particles exist around (Ti,Zr)Ni grain boundaries. The B199 martensite structure is2
0
calculated with a50.295 nm, b50.408 nm, c50.491 nm and b 597.4 . Martensitic transformation temperatures decrease with increasing aging time at 3008C. This feature is a result of the aging effect of point defects / atoms rearrangement in B2 phase. Thermal cycling can also decrease transformation temperatures while increasing the hardness of the alloy. The strengthening effects of aging and thermal cycling on the Ms (M*) temperature of Ti40.5Ni49.5Zr10alloy can be represented by the equation Ms5T 2K Ds . Experimental resultso y indicate that martensitic transformation temperatures of Ti40.5Ni49.5Zr10alloy can be more effectively depressed by aging than by thermal cycling. 2000 Elsevier Science S.A. All rights reserved.
Keywords: Martensitic transformation; Shape memory; Titanium alloy
1. Introduction observed in Ti-rich Ti532XNi Zr47 X alloys with the Zr content in the range of 5|20 at.% at room temperature [4]. TiNi alloys are known as the most important shape Here, l phase is a TiNiZr ternary solid solution and the1 memory alloys (SMAs) due to their excellent shape-mem- (Ti,Zr)Ni phase can exhibit the B2↔B199 martensitic ory effect and pesudoelasticity. However, they are limited transformation with the Ms temperature in the range of to use at temperatures lower than 1508C because their 608C |2608C [4]. Hsieh et al. [5] reported that the lattice martensitic transformation starting temperature, Ms, is parameters of martensitic phase B199 by using the XRD, usually lower than 1008C. High-temperature SMAs with an TEM and Riverted method [6] are dependent on the Zr Ms temperature higher than 1008C have been extensively content in Ti50.52XNi49.5Zr SMAs with Zr content in theX
researched due to their potential applications. It is well range of 1–20 at.% at room temperature. Meanwhile, known that Ti Ni50 502YX ternary SMAs with X5Pd, Pt orY Mulder et al. [7] reported that the Ms temperatures above Au have an Ms temperature much higher than 1008C and 1208C can be obtained in TiNiZr alloys with Zr content exhibit an one-way shape memory effect [1–3]. However, above 10 at.% and Ni content below 49.5 at.%. They also the high cost of precious metals will limit the practical found that the decrease in transformation temperatures in applications of these SMAs. For this reason, other ternary the thermal-cycled Ti31.5Ni48.5Zr20 alloy is affected by the TiNiX SMAs of lower costs need to be investigated. (Ti,Zr) Ni precipitates.2
Among them, the most prospective candidates are TiNiZr It has been confirmed that the transformation charac-and TiNiHf alloys with Zr charac-and Hf replacing Ti in these teristics of Ti-rich binary TiNi SMAs can be affected by
alloys. various thermo-mechanical treatments, such as thermal
Three phases, (Ti,Zr)Ni, (Ti,Zr) Ni and the l phase are2 1 cycling, aging and cold rolling [8]. However, few reports have been made on Ti-rich TiNiZr ternary alloys [9] whose transformation behaviors and shape-memory characteristics *Corresponding author.
E-mail address: [email protected] (S.K. Wu) are affected by different thermo-mechanical treatments. In 0925-8388 / 00 / $ – see front matter 2000 Elsevier Science S.A. All rights reserved.
S.K. Wu, S.F. Hsieh / Journal of Alloys and Compounds 297 (2000) 294 –302 295
the present study, we aim to understand the general phases was performed by using a JOEL JXA-8600SX characteristics of a Ti-rich Ti40.5Ni49.5Zr10 ternary alloy, electron probe microanalyzer (EPMA) equipped with a including transformation temperatures, microstructures and WDX analysis system. TEM specimens were prepared by internal friction properties, etc. The variation of martensitic electropolishing at 08C with an electrolyte consisting of transformation temperatures with aging time and the effect 20% H SO and 80% CH OH by volume. Selected area2 4 3 of thermal cycling on this alloy will also be discussed. diffraction patterns (SADPs) and TEM images were ex-amined using a JEOL-4000FX microscope equipped with an energy dispersive X-ray (EDX) system.
2. Experimental procedure
The conventional tungsten arc melting technique was
employed to prepare the Ti40.5Ni49.5Zr10 (at.%) alloy. 3. Results and discussion Titanium (purity 99.7%), nickel (purity 99.9%) and
aluminum (purity 99.9%), totaling about 120 g, were 3.1. Transformation behavior in Ti40.5Ni49.5Zr10 alloy
melted and remelted at least six times in an argon
atmosphere. A pure titanium button was used as a getter Fig. 1 shows the experimental results of electrical during the arc melting. Weight loss during melting was resistivity versus temperature for the annealed negligibly small. The as-melted ingots were homogenized Ti40.5Ni49.5Zr10 alloy. The notation for the determination at 9508C372 h and then quenched in water. They were of martensitic transformation temperatures, Ms, M , As andf swaged at 8008C31 h and then annealed at 8508C31 h. A , in Fig. 1 follows the example established by Hwang etf Specimens were cut into several plates with a low speed al. [11]. The martensitic transformation starts at Ms diamond saw, and then annealed at 9008C31 h and finally (¯1008C), where the resistance is at a minimum but
quenched in water. After the annealing treatment, two increases quickly until Mf (¯758C) is reached. Upon
experimental procedures were conducted. First, several heating from 258C, the resistance increases up to As plates were sealed in evacuated quartz tubes and aged at (¯1358C), where the slope of the curve changes and
3008C for 1–240 h and then quenched in water. Second, continuously decreases down to A (f ¯1758C). This stage
several more plates were subjected to thermal cycling N corresponds to the reverse transformation from martensite times from 08C to 3008C with N51|100 cycles. Speci- to B2 parent phase.
mens for electrical resistivity measurement (size: 50 mm3 Fig. 2a shows the TEM bright field image of martensite 1 mm31 mm), DSC measurement, internal friction test in annealed Ti40.5Ni49.5Zr10 alloy. Figs. 2b–d are SADPs (size: 110 mm34 mm31 mm), hardness test, shape of Fig. 2a, in which the foil is tilted to parallel the [100] ,M
¯ ¯
recovery test and microstructure observation were carefully [011]Mand [111]Mdirection, respectively. Han et al. found cut from plates treated using the above procedures. that lattice parameters of martensite in Ti36.5Ni48.5Hf15 Martensitic transformation temperatures were measured alloy is a monoclinic structure with a50.293 nm, b50.411 by using a four-probe electrical resistivity. The tempera- nm, c50.473 nm and b 5100.48 [12]. The SADPs of this ture range for electrical resistivity test was from 258C to annealed alloy coincide with those of Han’s results.
12508C. DSC measurements were made with a Dupont Therefore, based on Fig. 2 and Ref. [5], we can calculate 9990 thermal analyzer equipped with a quantitative scan- the martensite structure of Ti40.5Ni49.5Zr10 alloy and find ning system 910 DSC cell for controlled heating and
cooling runs on samples encapsulated in an aluminum pan. The running temperature range was from 08C to 12008C with a heating and cooling rate of 108C / min. An internal friction (IF) test was carried out with a SINKU-RIKO 1500 M / L series inverted torsion pendulum in the tem-perature range from 21508C to 12508C. The temtem-perature rate was precisely controlled at 28C / min and the test frequency was approximately 1 Hz. Specimens for the hardness test were first mechanically polished and then subjected to measurement in a microvickers hardness tester with 500 g load at room temperature. For each specimen, the average hardness value was taken from at least five test readings. The microstructure observations were made using optical microscope (OM) and transmission electron microscope (TEM). The shape recovery measurement was
performed as described earlier by Lin et al. [10]. A Fig. 1. Electrical resistivity versus temperature curve for 9008C31 h quantitative analysis of the chemical composition of the annealed and water quenched Ti40.5Ni49.5Zr10alloy.
¯
Fig. 2. (a) TEM bright-field image of as-annealed Ti40.5Ni49.5Zr10alloy. (b) SADP of (a) with [100]Mzone axis, (c) SADP of (a) with [011]Mzone axis, (d) ¯
SADP of (a) with [111] .M
that it is also a monoclinic B199 structure in which a5 0.295 nm, b50.408 nm, c50.481 nm and b 597.48.
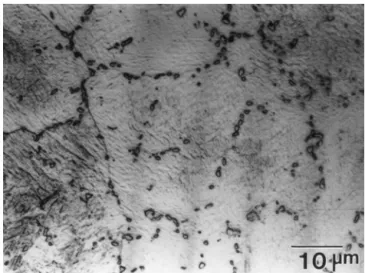
Fig. 3 shows the OM microstructure of Ti40.5Ni49.5Zr10 alloy. A great number of second phase particles are found around B2 grain boundaries. The chemical compositions of matrix and second-phase particles found using EPMA analysis are (Ti,Zr)Ni and (Ti,Zr) Ni, respectively, as2 shown in Table 1. In spite of the existence of many particles, this alloy still exhibits rather good shape re-covery, which can reach about 90%, as shown in Fig. 4.
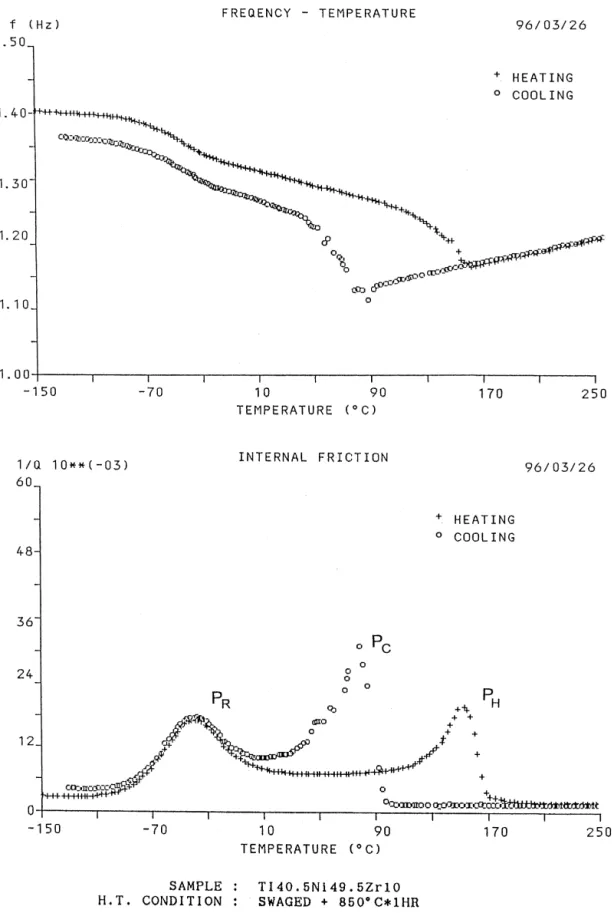
Fig. 5a and b show the IF test result and plot the
21
frequency f (shear modulus) and Qmax versus temperature of the annealed Ti40.5Ni49.5Zr10 alloy. In Fig. 5b, there is one peak P at 848C on cooling and one peak P at 1518CC H on heating. Both peaks, which correspond to the minimum of frequency f shown in Fig. 5a, indicate the minima of the shear modulus. The peak P appearing at 2388C whichR does not correspond to the minimum of frequency f is
proposed to be a relaxation peak. The relaxation peak is Fig. 3. Optical micrographic microstructure of as-annealed suggested to be associated with the interaction of disloca- Ti40.5Ni49.5Zr10alloy.
S.K. Wu, S.F. Hsieh / Journal of Alloys and Compounds 297 (2000) 294 –302 297
Table 1 times of this alloy are similar to those of Fig. 6, except that
21
EPMA analysis for Ti40.5Ni49.5Zr10 alloy annealed at 9508C372 h the temperatures P , P and P and the magnitude of Q
C H R max
Ti40.5Ni49.5Zr10 Composition (at.%) are different, and are thus omitted here. Pc, P , P versusH R
alloy the aging time of this alloy derived from the internal
Ti Ni Zr
friction test are plotted in Fig. 7. From Fig. 7, P , P andC H
Matrix 40.81 49.01 10.18 P are all affected by aging time. Fig. 8 shows that the Hv
R
Second phase 56.52 33.19 10.29 hardness of the 3008C aged Ti Ni Zr alloy increases
40.5 49.5 10
significantly in the first 40 h and then gradually levels off with further aging.
tions and point defects [13], and is independent of the
Fig. 9a shows a TEM bright-field image of the B199 martensite and premartensite transformations [14]. The
martensite in a 3008C 3240 h aged Ti Ni Zr alloy.
temperature difference DT between P and P is approxi-H C 40.5 49.5 10
Fig. 9b shows the SADPs taken from the martensite plate mately 678C for this alloy, which is larger than that of
having fine striations at area E of Fig. 9a, in which the foil Ti Ni51 49 alloy (DT5418C) [8]. This feature indicates that
is parallel to [110] direction. No extra reflection spot can the Zr atoms solid-soluted in Ti-rich TiNi alloy will result M
be observed in Fig. 9 except for the (001) compound
in a different chemical free energy between binary TiNi M
21 22 twins. Thus, the fine striations are traces of (001) twins
and ternary TiNiZr SMAs. The height Qmax (3.12310 ) M
plates. The (001) compound twins and [011] type II
of internal friction peak, P , in Fig. 5 is lower than that ofC M M
21 22 twins are the substructures of the martensite in the aged
Ti Ni51 49 alloy (Qmax55.2310 with the same specimen
Ti Ni Hf alloy, which have many defects such as size) [8]. This characteristic show that the solid solution 36.5 48.5 15
dislocations [15]. Similar microstructures can also be hardening in Ti-rich TiNiZr alloys may decrease the
observed in Fig. 9. Compared with Figs. 9 and 2, (001)
mobility of twin plates in the martensite and that of the M
twin planes of the aged specimen are more dense than interfaces between martensite and parent phase. From Figs.
those of the annealed one. This result may indicate that 1, 2 and 5, one can find that the transformation sequence of
(001) compound twins of the aged specimen have a martensite in Ti40.5Ni49.5Zr10 alloy is the B2↔B199 one- M
lower stacking fault energy than those of the annealed one. stage transformation.
From Fig. 7, transformation temperatures of PC and PH decrease with increasing aging time, most likely a result of 3.2. Effects of aging and thermal cycling on Ti-rich
the following aging effects: (i) The interstitial atoms (such
Ti40.5Ni49.5Zr10 alloy
as H, O, etc.) can be solid-soluted in specimens during the arc melting process and excess vacancies can be obtained Fig. 6a and b show the same plots as Fig. 5, but now for
by quenching the annealed specimen at 9008C. The aging the alloy aged at 3008C3120 h. In Fig. 6b, there is one
process causes the interstitial atoms to rearrange and peak P on cooling, and one peak P on heating in the firstC H
eliminate excess vacancies. Therefore, the interfaces be-cycle. Peaks P and P are associated with the martensiticC H
tween parent phase and martensite during the martensitic transformation. A well-shaped relaxation peak P appearsR
transformation may be impeded by these point defects in at 2278C, which does not correspond the minimum of
aged specimens. (ii) The Zr atoms replace Ti atoms in frequency of f in Fig. 6a. The plots of different aging
Ti40.5Ni49.5Zr10 alloy due to the isomorphologic solid solution effects of Ti and Zr atoms in the Ti–Zr binary phase diagram [16]. The excess quenched-in-vacancies can promote atomic rearrangement of Ti and Zr atoms in the B2 parent phase during the aging process. This reordered process may introduce microstrain field / lattice distortion and result in the hardness increment, as shown in Fig. 8. The lattice distortion will hinder the mobility of twin plates in martensite and / or that of interfaces between the marten-site and parent phase. The aged specimens have finer (001)M compound twins and more dislocations, as shown in Fig. 9, most likely a result of the above mentioned aging effects of (i) and (ii).
Table 2 shows the DSC forward peak temperature M* and the hardness Hv of the thermal-cycled Ti40.5Ni49.5Zr10 alloy. From Table 2, the M* temperatures decrease, but the hardness Hv increases with increasing thermal cycling, resulting from the effect of dislocations induced by thermal cycling, as proposed in thermal-cycled binary TiNi SMAs Fig. 4. Shape recovery versus heating temperature for Ti40.5Ni49.5Zr10
21
Fig. 5. (a) Frequency, f, and (b) internal friction, Qmax, versus temperature for the annealed Ti40.5Ni49.5Zr10alloy. Peaks P and P are associated with theC H martensitic transformation and peak P is a relaxation one.R
S.K. Wu, S.F. Hsieh / Journal of Alloys and Compounds 297 (2000) 294 –302 299
21
Fig. 6. (a) Frequency, f, and (b) internal friction, Qmax, versus temperature of Ti40.5Ni49.5Zr10 alloy aged at 3008C for 120 h. Peaks P and PC H are associated with the martensitic transformation and peak P is a relaxation one.R
Fig. 7. The peak temperatures of P , P and P versus aging time forH C R Ti40.5Ni49.5Zr10alloy aged at 3008C.
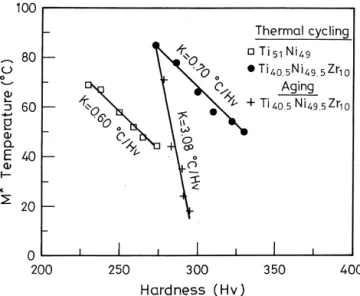
3.3. Strengthening effects in the aged and thermal-cycled
Ti-rich Ti40.5Ni49.5Zr10 alloy
Fig. 10 shows the curves of DSC peak temperature M* vs. hardness Hv for the thermal-cycled and aged Ti40.5Ni49.5Zr10 alloy. The results of the thermal-cycled Ti-rich Ti Ni51 49 alloy are also plotted in Fig. 10. It was pointed out that any strengthening mechanism which impedes the transformation shear can lower transformation temperatures because martensitic transformation involves a shear process [18,19]. This feature can be expressed by Eq. (1).
Ms 5 T 2 K Dso y (1)
Fig. 9. (a) TEM bright-field image of Ti40.5Ni49.5Zr10alloy aged at 3008C for 240 h. (b) SADP taken from area E in (a), showing (001)Mcompound The constant K contains the factors of proportionality twins with [110]Mzone axis.
between the critical shear stress and the yield stress Ds ,y
the equilibrium temperature To is a function of the chemical composition, and the yield stress Ds is consid-y ered to be proportional to the hardness.
In this study, thermal cycling and aging processes do not change the alloy’s composition, hence T is a constant. Ino addition, thermal cycling and aging can cause the alloy’s
Table 2
DSC forward peak temperatures M* and hardness Hv for various thermal cycled Ti40.5Ni49.5Zr10 alloy Thermal Ti40.5Ni49.5Zr10 alloy cycles (N ) N M*(8C) Hardness (Hv) 1 84 273 2 78 286 10 66 300 20 58 310 50 54 322 100 50 330
S.K. Wu, S.F. Hsieh / Journal of Alloys and Compounds 297 (2000) 294 –302 301
are found around the grain boundaries of (Ti,Zr)Ni matrix. Despite the existence of many second phase particles, this alloy still exhibits good shape recovery which can reach about 90%. The B199 martensite structure is calculated as a 50.295 nm, b 50.408 nm,
0
c 50.491 nm and b 597.4 .
2. Transformation temperatures of Ti40.5Ni495Zr10 alloy decrease and the hardness increases with increasing aging time at 3008C. This characteristic is related to the aging effects of point defects and atoms rearrangement in B2 phase. Besides, finer plates formed in (001)M compound twins for longer aged specimens may relate to these aging effects.
3. Transformation temperatures decrease and the hardness increases in the thermal-cycled Ti40.5Ni49.5Zr10 alloy. The strengthening effect of thermal cycling and aging on transformation temperatures of this alloy is found to Fig. 10. The M* temperature versus hardness Hv for thermal cycled and follow the equation Ms5T 2K Ds . Experimental
o y
aged Ti40.5Ni49.5Zr10alloy. The data for the thermal cycled Ti Ni51 49alloy results show that K values are associated with the are also included.
alloy’s annealed hardness. The Ti-rich Ti40.5Ni49.5Zr10 alloy has solid-soluted Zr atoms and has a higher hardness to increase, as shown in Fig. 8 and Table 2. annealed hardness than the Ti Ni51 49 alloy, and thus has Therefore, both thermal cycling and aging can raise the a higher K value. Besides, the constant K of thermal-yield stress Ds . As derived from Eq. (1), this featurey cycled Ti40.5Ni49.5Zr10alloy (K 50.708C / Hv) is smaller causes the M* (Ms) temperature to be lowered, as shown than that of aged one (K 53.088C / Hv). This result in Fig. 10. Upon carefully examining Fig. 10, it can be indicates that martensitic transformation temperatures seen that the constant K of thermal-cycled Ti40.5Ni49.5Zr10 of Ti40.5Ni49.5Zr10 alloy can be more effectively de-alloy is slightly larger than that of thermal-cycled Ti Ni51 49 pressed by aging in B2 phase than by B2↔B199 alloy. We propose that the K value is related to the inherent thermal cycling.
hardness of annealed TiNi binary or TiNiX ternary alloys. The greater the annealed hardness is, the larger the K value
will be. For example, the thermal-cycled Ti40.5Ni49.5Zr10 Acknowledgements alloy has its annealed hardness at 273 Hv and its K value
at 0.708C / Hv, which is larger than that of thermal-cycled
The authors are grateful to Dr. T. S. Chou, Steel and Ti Ni51 49 alloy (230 Hv, K 50.608C / Hv). In other words, Aluminum R and D Department, China Steel Corporation, the depression of Ms (M*) temperature by the
strengthen-for his great assistance with the internal friction measure-ing mechanism is stronger for the alloy havmeasure-ing a higher
ment. The financial support of this study is provided by the annealed hardness.
National Science Council (NSC), Republic of China, under The constant K of the thermal-cycled Ti40.5Ni49.5Zr10 Grant No. NSC 86-2216-E002-033, is also sincerely alloy (K 50.708C / Hv) is smaller than that of the aged one
appreciated. (K 53.088C / Hv). This feature is a result of different
strengthening mechanisms, because the former strengthen-ing originates from the thermal-cycled induced dislocations
References and the latter one results from the aging effects of point
defects and atoms rearrangement in B2 phase. The fact that
[1] V.P. Sivokha, V.N. Khachin, Fizika Metallovi Metallovedenie 62
K 53.088C / Hv . .K 50.708C / Hv also indicates that the
(1986) 534. martensitic transformation temperatures of Ti40.5Ni49.5Zr10
[2] V.N. Khachin, N.M. Matveea, V.P. Sivokha, Doklady AN SSSR 257 alloy can be more effectively depressed by aging in B2
(1981) 167.
phase than by B2↔B199 thermal cycling. [3] S.K. Wu, C.M. Wayman, Metallography 20 (1987) 359. [4] S.F. Hsieh, S.K. Wu, J. Alloys Comp. 266 (1998) 276. [5] S.F. Hsieh, S.K. Wu, J. Alloys Comp. 270 (1998) 237. [6] H.M. Rietveld, J. Appl. Crystallogr. 2 (1969) 65. 4. Conclusion
[7] J.H. Mulder, J.H. Mass, J. Beyer, ICOMAT, (1992) 869. [8] H.C. Lin, S.K. Wu, J.C. Lin, Mater. Chem. Phys. 37 (1994) 184. 1. The annealed Ti40.5Ni49.5Zr10 alloy undergoes [9] S.H. Chen, Master’s Thesis, Institute of Materials Science and
B2↔B19, one-stage martensitic transformation with Engineering, National Taiwan University, Taipei, Taiwan, 1994. Ms¯1008C. Many second phase particles (Ti,Zr) Ni2 [10] H.C. Lin, S.K. Wu, Scripta Metall. 26 (1992) 59.
[11] C.M. Hwang, M. Meichle, M.B. Salamon, C.M. Waymam, Phil. [16] D.T. Hawkins, R. Hultgren, ASM Handbook, Alloy Phase Diagram,
Mag. A47 (1983) 9. Vol. 3, ASM International, Ohio, 1992, pp. 2-380.
[12] X.D. Han, W.H. Zou, R. Wang, Z. Zhang, D.Z. Yang, K.H. Wu, J. De [17] S. Miyazaki, T. Imai, Y. Igo, K. Otsuka, Metall. Trans. 17A (1986)
Physique IV (1995) C8–753. 76.
[13] H.C. Lin, Ph.D. Thesis, Institute of Materials Science and Engineer- [18] M. Cohen, E.S. Machlin, V.G. Paranjpe, Thermodynamics in Phys-ing, National Taiwan University, Taipei, Taiwan, 1992. ical Metallurgy, ASM, Metals Park, OHIO, 1950.
[14] J.S. Zhu, R. Schaller, W. Benoit, Phys. Lett. A141 (1989) 177. [19] E. Hornbogen, Acta Metall. 33 (1991) 595. [15] X.D. Han, W.H. Zou, S. Jin, Z. Zhang, D.Z. Yang, Scripta Metall. 32
![Fig. 9a shows a TEM bright-field image of the B199 martensite and premartensite transformations [14]](https://thumb-ap.123doks.com/thumbv2/9libinfo/8783044.216773/4.918.77.438.795.1077/fig-shows-bright-field-image-martensite-premartensite-transformations.webp)