Sheathless Capillary Electrophoresis/Electrospray
Ionization Mass Spectrometry Using a Pulled Bare
Fused-Silica Capillary as the Electrospray Emitter
Yi-Ting Wu and Yu-Chie Chen*Department of Applied Chemistry, National Chiao Tung University, Hsinchu 300, Taiwan
It has always been assumed that electrical contact at the capillary outlet is a necessary requirement when coupling capillary electrophoresis (CE) with electrospray ionization mass spectrometry (ESI-MS). In this study, we used a pulled bare-capillary tip as the ESI emitter, but neither was it coated with any electrically conductive materials nor was a high external voltage applied on its outlet. In this paper, we demonstrate that this straightforward approach may be used to generate multiply charged ions of proteins and peptides through electrospray ionization. Our results indicate that peptides and proteins, including bradykinin, cytochrome c, myoglobin, and tryptic digest products that elute from a pulled bare-capillary tip can be detected directly by ESI-MS using the tapered bare-capillary interface. Thus, we have demonstrated that CE and ESI-MS may be combined successfully without the need to modify the outlet of the capillary tip with an electrically contacting material.
Electrospray ionization mass spectrometry (ESI-MS) is one of the best detectors for analyzing analytes separated by capillary electrophoresis (CE), and a number of interfaces have been developed to couple the two systems together.1-17Principal among
them is the liquid sheath flow interface, which was first introduced by Smith et al.1A potential applied to the sheath liquid provides the required voltage at the capillary outlet. The major advantage of employing this liquid sheath flow in interfacing CE and ESI-MS is that a stable electrospray can be obtained, but incorporating the sheath liquid with the CE eluent may reduce the sensitivity of the ESI mass spectrometer. An alternative approach, the sheathless interface method,2-17involves using a pulled capillary tip modified with electrically conductive materials on its outlet as the emitter. Gold,6-11silver,12graphite,13carbon,14,15and conductive polymers16,17 have all been employed as sheathless interface coatings on the tapered capillary tips. Each of these approaches emphasized its ease of fabrication and the durability and rugged-ness of the electrically conductive coating.
Van der Greef and co-workers proposed CE and chip-based CE systems featuring electrodeless nanospray interfaces for the analysis of small molecules.18,19In these systems, a voltage applied to the buffer compartment drives the electrophoresis and gener-ates the nanospray, but no electrospray voltage is applied to the spray emitter. The emitter is positioned very close to the mass analyzer (<1 mm). These reports demonstrated the suitability of using these techniques for the analysis of low-molecular-weight cationic drugs, but no papers have appeared that describe the analysis of larger molecules, such as peptides and proteins, this way.
In this paper, we report that a similar design can be employed for the successful analysis of proteins and peptides. We have used a pulled bare-capillary tip as an ESI emitter; it was neither coated with any electrically conductive materials nor subjected to an applied external high voltage. We demonstrate that a number of samples, including proteins, peptides, and protein tryptic digest products, that eluted from this capillary tip could be detected directly by an ESI mass spectrometer when using this straight-forward nanospray interface.
EXPERIMENTAL SECTION
Reagents and Materials. Methanol and hydrofluoric acid were obtained from Tedia (Fairfield, OH); acetonitrile, acetic acid, * To whom correspondence should be addressed. Phone: 886-3-5131527.
Fax: 886-3-5744689. E-mail: [email protected].
(1) Smith, R. D.; Barinaga, C. J.; Udseth, H. R. Anal. Chem. 1988, 60, 1948-1952.
(2) Olivares, J. A.; Nguyen, N. T.; Yonker, C. R.; Smith, R. D. Anal. Chem. 1987,
59, 1230-1232.
(3) Moni, M. Anal. Chem. 2001, 73, 3497-3501.
(4) Wetterhall, M.; Nilsson, S.; Markides, K. E.; Bergquist, J. Anal. Chem. 2002,
74, 239-245.
(5) Janini, G. M.; Conrads, T. P.; Wilkens, K. L.; Issaq, H. J.; Veenstra, T. D.
Anal. Chem.2003, 75, 1615-1619.
(6) Barroso, M. B.; de Jong, A. P. J. Am. Soc. Mass Spectrom. 1999, 10, 1271-1278.
(7) Kriger M. S.; Cook, K. D.; Ramsey, R. S. Anal. Chem. 1995, 67, 385-389. (8) Valaskovic, G. A.; Kelleher, N. L.; Little, D. P. Aaserud, D. J.; McLafferty,
F. W. Anal. Chem. 1995, 67, 3802-3805.
(9) Valaskovic, G. A.; McLafferty, F. W. J. Am. Soc. Mass Spectrom. 1996, 7, 1270-1272.
(10) Wilm, M.; Mann, M. Anal. Chem. 1996, 68, 1-8.
(11) Hulthe, G.; Petersson, M. A.; Fogelqvist, E. Anal. Chem. 1999, 71, 2915-2921.
(12) Wahl, J. H.; Gale, D. C.; Smith, R. D. J. Chromatogr., A 1994, 659, 217-222.
(13) Zhu, X.; Thiam, S.; Valle, B. C.; Warner, I. M. Anal. Chem. 2002, 74, 5405-5409.
(14) Chang, Y. Z.; Chen, Y. R.; Her, G. R. Anal. Chem. 2001, 73, 5083-5087. (15) Chang, Y. Z.; Her, G. R. Anal. Chem. 2000, 72, 626-630.
(16) Maziarz, E. P.; Lorenz, S. A.; White, T. P.; Wood, T. D. J. Am. Soc. Mass
Spectrom.2000, 11, 659-663.
(17) Wetterhall, M.; Klett, O.; Markides, K. E.; Nyholm, L.; Bergquist, J. Analyst 2003, 128, 728-733.
(18) Mazereeuw, M.; Hofte, A. J. P.; Tjaden, U. R.; van der Greef, J. Rapid
Commun. Mass Spectrom.1997, 11, 981-986.
(19) Vrouwe, E. X.; Gysler, J.; Tjaden, U. R.; van der Greef, J. Rapid Commun.
Mass Spectrom.2000, 14, 1682-1688.
Anal. Chem.2005,77,2071-2077
and ammonium hydrogen carbonate were obtained from Riedel de Hae¨n (Seelze, Germany). Sodium hydroxide and dimethyl sulfoxide (DMSO) were purchased from J. T. Baker (Phillipsburg, NJ). Myoglobin, cytochrome c, and trypsin (TPCK treated) were obtained from Sigma (St. Louis, MO). The fused-silica capillary (50-µm i.d.× 365-µm o.d.) was obtained from Polymicro Tech-nologies (Phoenix, AZ).
Preparation of Cytochrome c Tryptic Digest. The cyto-chrome c tryptic digestion was performed at 38°C over 24 h using a protein-to-enzyme weight ratio of 50. Cytochrome c (10-5M, 0.1 mL) dissolved in an ammonium hydrogen carbonate buffer solution (25 mM) was reacted with trypsin (0.25 mg/mL, 10 µL) dissolved in an ammonium buffer solution (25 mM).
Fabrication of the Pulled Bare Fused-Silica Capillary. The pulled bare fused-silica capillary was fabricated by applying a small weight (50 g) on the lower end of a vertical capillary. The lower part of the capillary was heated and then quickly drawn to form a narrow capillary tip. After cooling to ambient temperature, the capillary tip was immersed in an HF solution (48%) for 5 min. The tip was washed with methanol and deionized water. The pulled capillary (length, 75 cm; tip i.d., 12 ( 3 µm; tip o.d., 30 ( 3 µm) was conditioned prior to analysis by using a pump (pressure: 18 mmHg) to rinse it successively with 1 N NaOH (30 min), water (30 min), and running buffer (10 min).
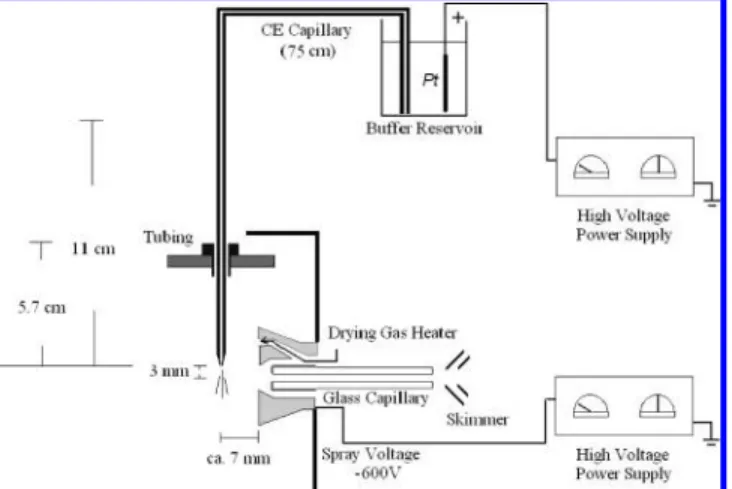
CE/ESI-MS Configuration. Figure 1 displays the configura-tion of the CE/ESI-MS system incorporating the pulled bare capillary as the ESI emitter. This setup consists of a power supply, a capillary, a platinum electrode, and an ESI mass spectrometer. The pulled capillary tip, which was used as the spray emitter, was placed directly into an orthogonal ESI mass spectrometer; this arrangement was convenient because of the orthogonal-inlet design of the Esquire 2000 instrument. No electrical contact was applied on the outlet of the capillary tip. The CE tip was positioned ∼3 mm above the inlet of the orthogonal mass spectrometer, while the capillary tip was ∼7 mm from its metal cap orifice. The capillary inlet was placed in a vial containing the running buffer solution and a platinum electrode connected to a high-voltage power supply. The vial was positioned 11 cm above the capillary outlet, although coupling the pulled capillary tip horizontally into the ESI mass spectrometer is also a suitable combination for CE/ ESI-MS (for details of the results of connecting the capillary tip horizontally to the ESI-MS, see the Results and Discussion).
Samples were injected into the capillary by applying a voltage of 10 kV in the sample reservoir for 5 s. The running buffer for CE separation of protein tryptic digest product was acetonitrile/0.5% acetic acid (1:1, v/v). A voltage of 10 kV was applied to the platinum electrode immersed in the CE buffer reservoir during CE/ESI-MS analysis.
Preparation of Sample Solutions. Protein samples were dissolved in a solution of methanol/2% acetic acid (1:1, v/v); peptide samples were dissolved in a 50% acetonitrile/water solution. The infusion voltage for the protein samples was set at 2 kV, and the flow rate was estimated to be∼22.5 nL/min; in contrast, when the infusion voltage for the peptide samples was set at 10 kV, the flow rate was∼100 nL/min. Sample solutions could be infused continuously into the capillary by applying a high voltage only in the capillary inlet, that is, while no electrode was applied in the capillary outlet. As a result, the sample solution was driven from the capillary outlet, and this process simulta-neously generated the nanospray. DMSO was used as a sample to examine the flow rates under different experimental conditions. No nebulization gas was applied during analysis.
Instrumentation. All mass spectra were obtained using an Esquire 2000 ion trap mass spectrometer (Bruker Daltonics, Germany). When the commercial spray emitter was used for electrospray ionization, the spray voltage was set at -4 kV, the flow rate for sample infusion was set at 5 µL/min, and the temperature of the heated transfer capillary was maintained at 250°C. Capillary electrophoresis was performed in a home-built CE instrument, which consisted of a capillary, a platinum electrode, and a power supply (CZE 1000 R, Spellman, NY). The spray voltage was set at -600 V when the pulled bare capillary tip was used as the ESI emitter. The off-line nanospray mode was operated during ESI-MS analysis.
RESULTS AND DISCUSSION
Figure 2a presents the ESI mass spectrum of cytochrome c obtained after applying a high voltage only on the sample reservoir (to drive the sample solution through the capillary) and using the pulled bare-capillary outlet tip directly as the ESI emitter; that is, without applying a high voltage on the tip. The multiply charged ion distribution of cytochrome c is similar to that obtained (inset to Figure 2a) when using a commercial ESI emitter. Figure 2b presents the ESI mass spectrum of myoglobin; again, the multiply charged ion distribution also resembles that obtained (inset to Figure 2b) from the commercial emitter. These results indicate that the electrospray ionization of proteins can be performed effectively using the pulled bare-capillary tip without modifying it with conductive materials on the surface of the capillary outlet. This approach is extremely straightforward; furthermore, it also eliminates any possible problems that may arise from using an electrical contact at the capillary tip.
To understand how ionization occurs in this approach, we continuously infused cytochrome c (100 µg/mL), dissolved in methanol/2% acetic acid (1:1, v/v), into the capillary by applying a potential of 2600 V to the capillary inlet reservoir and used eq 1 to estimate the electric field strength (Espray) in the spray region,18,20
Figure 1. The CE/ESI-MS configuration.
where V is the applied voltage, r is the inner radius of the capillary tip, and d is the distance between the spray tip and the orifice of the mass spectrometer. The voltage can be estimated by compar-ing the electric current through the capillary with (I1) and without (I2) an electrode at the capillary outlet. The total voltage (Vtot) is equal to the sum of the voltage over the capillary (Vcapillary) and the gap (Vgap).17,21
We applied 2000 V on the capillary inlet reservoir (not 2600 V),
and -600 V for the spray voltage. The total voltage used in this experiment is equal to the voltage supplied by the high-voltage power supply (2600 V). The voltage over the capillary can be calculated from the equation
where I1is the current through the capillary measured when the outlet is placed in a vial filled with a methanol/2% acetic acid (1:1, v/v) solution containing a platinum electrode; we measured I1to be 0.158 µA. In the electrodeless setup, the current reduced to 0.112 µA. By combining eqs 2 and 3, the gap voltage can be calculated: Vgap) 757 V. Using a microscope, we estimated the radius of the capillary tip to be∼5 µm; the distance from the capillary tip to the mass spectrometer was∼7 mm. Therefore, (20) Kebarle, P.; Tang, L. Anal. Chem. 1993, 65, 973A-986A. (21) Jackson, G. S.; Enke, C. G. Anal. Chem. 1999, 71, 3777-3784. Figure 2. (a) ESI mass spectrum of cytochromec(18.2 fmol) obtained through continuous infusion (0.1 mg/mL, 0.1 min). The inset displays the ESI mass spectrum of cytochromec(4 pmol) obtained using the commercial emitter (flow rate: 5µL/min). (b) ESI mass spectrum of myoglobin (13.3 fmol) obtained through continuous infusion (0.1 mg/mL, 0.1 min). The inset displays the ESI mass spectrum of myoglobin (3 pmol) obtained using the commercial emitter (flow rate: 5µL/min). A total of five mass spectra were summed (0.1 min), while each mass spectrum was obtained from an average of five mass scans.
Figure 3. The ion intensity atm/z531 plotted as a function of the infusion voltage. The curve presented by the solid squares was obtained after positioning the bare pulled-capillary tip 11 cm below the capillary inlet, while that marked by solid circles was obtained when both ends of the capillary had the same height.
Vtot) Vcapillary+ Vgap (2)
Figure 4. The ion intensity atm/z531 plotted as a function of the inner diameter of the pulled capillary tip.
using eq 1, we calculated the field strength on the capillary tip to be 3.51× 10⁷V/m, which is sufficiently high to induce the ESI process. If the total voltage is raised to 5200 V, the field strength is doubled (7.02× 10⁷V/m).
For convenience of operation when coupling the CE system orthogonally to the ESI mass spectrometer, we positioned the CE buffer reservoir containing the platinum electrode on top of the mass spectrometer. As a result, the buffer reservoir containing the capillary inlet was positioned 11 cm above the capillary outlet, which results in an increase in the flow rate and may affect the ionization efficiency during the ESI process. Figure 3 presents
the relative intensity of the ion at m/z 531, that is, the doubly charged ion of bradykinin, as a function of applied voltage on the capillary inlet when generating ESI mass spectra by applying a high voltage only to the reservoir containing bradykinin (10 µg/ mL) dissolved in 50% acetonitrile/water. The intensity (plotted with solid squares) of the ion generated when the capillary outlet tip was positioned 11 cm below the capillary inlet was slightly higher than that (plotted with solid circles) generated when the tip was positioned at the same height as the capillary inlet, but the ion intensities plotted with respect to the applied voltage in these two cases were almost identical for applied voltages >5 kV. Figure 5. (a) ESI mass spectrum of cytochromec(182 amol) obtained through continuous infusion (200 ng/mL, 0.1 min) and applying a potential of 2 kV to the capillary inlet reservoir. The inset displays a plot of the total ion intensity as a function of the analysis time. (b) ESI mass spectrum of myoglobin (434 amol) obtained through continuous infusion (500 ng/mL, 0.1 min) and applying a potential of 2 kV to the capillary inlet reservoir. A total of five mass spectra were summed (0.1 min), while each mass spectrum was obtained from an average of five mass scans. The inset displays a plot of the total ion intensity as a function of the analysis time.
Figure 6. (a) The configuration of the CE apparatus coupled horizontally to the ESI mass spectrometer. (b) Plots of the total ion intensity obtained after positioning the capillary tip 1 mm (top) and 7 mm (bottom) from the mass spectrometer and using continuous nanoinfusion of bradykinin (10µg/mL). (c) ESI mass spectrum of bradykinin (10µg/mL) obtained after positioning the capillary tip 1 mm (top) and 7 mm (bottom) from the mass spectrometer and using continuous nanoinfusion. The infusion voltage was 10 kV.
This situation might arise because the ionization efficiency became steady when the applied voltage was over 5 kV.
The size of the inner diameter of the pulled capillary tip is another factor that affects the ionization efficiency during the ESI process. Figure 4 presents a plot of the ion intensity of the doubly charged ion of bradykinin (m/z 531) as a function of the inner diameter of the pulled capillary tip. The ion intensity remained steady for inner diameters <15 µm, but decreased significantly
when the inner diameter of the capillary tip was larger than 15 µm. These results indicate that the inner diameter of the capillary tip should be kept below 15 µm to obtain suitable ionization efficiencies during ESI processes.
Figure 5a and b presents the detection limits of cytochrome c and myoglobin, respectively, that we obtained when using this continuous nanoinfusion method. The concentrations of cyto-chrome c and myoglobin that were continuously infused were 200 and 500 ng/mL, respectively. Therefore, the sample quantities used to obtain the mass spectra in Figure 5 were in the range of several hundred attomoles. The mass spectra presented as the insets of Figure 5a and b display the total ion current as a function of the analysis time. These curves indicate that the electrospray ionization remains quite stable during analysis.
Although all of the results discussed so far were obtained by configuring the CE apparatus orthogonally with respect to the mass spectrometer, it is also suitable to couple it horizontally; Figure 6a depicts a schematic representation of the latter config-uration. We positioned the capillary tip in front of the metal cap orifice of the mass spectrometer at different distances to investi-gate the effect that this positioning has on the ion intensity. Figure 6b presents the total ion current plotted as a function of the analysis time when the capillary tip was positioned 1 mm (top curve) and 7 mm (bottom curve) from the metal orifice of the mass spectrometer; the bradykinin sample was infused continu-ously by applying a potential of 10 kV to the capillary inlet reservoir only. When we positioned the capillary tip 1 mm from the mass spectrometer, the total ion intensity was higher than that obtained from 7 mm away, but the total ion current obtained using the former configuration was less stable than that of the latter. Figure 6c displays their corresponding mass spectra of bradykinin Figure 7. Plot of the ion intensity atm/z531 as a function of the
flow rate. The inset is the plot of the ion intensity atm/z531 as a function of the corresponding voltage applied to the sample inlet reservoir. These values were obtained after using a pulled bare-capillary tip as a spray emitter to infuse bradykinin solution (10µg/ mL dissolved in 50% acetonitrile/water) continuously into the mass spectrometer.
Figure 8. ESI mass spectra of cytochromec(100µg/mL) obtained after applying different infusion voltages on the sample inlet reservoir: (a) 2, (b) 4, (c) 6, (d) 8, (e) 10, and (f) 12 kV.
obtained when placing the horizontal capillary outlet tip 1 mm (top) and 7 mm (bottom) from the mass spectrometer. The singly and doubly charged ions of bradykinin appear at m/z 531 and 1061, respectively. These results demonstrate that using the pulled bare-capillary tip as the emitter in a horizontal CE-ESI configu-ration also provides suitable spectra. If necessary, the distance between the capillary tip and the mass spectrometer can be adjusted to obtain optimal results.
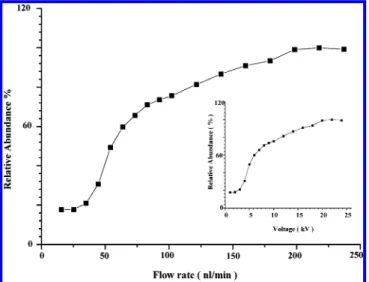
Figure 7 presents a plot of the doubly charged ion of bradykinin (m/z 531) as a function of the flow rate when using a pulled bare-capillary tip (i.d. 5.2 µm) as the spray emitter. The inset is the plot of the ion intensity at m/z 531 as a function of the corres-ponding voltages applied to the sample inlet reservoir. At a flow rate below 200 nL/min, the MS detector was mass-flow-sensitive, while the ion intensity achieved a plateau in the range 200-250 nL/min, achieving a concentration-sensitive region. However, when we turned the applied voltage up to 30 kV, we found that the ion intensity was greatly reduced because such a high applied voltage deteriorated the capillary tip. We obtained optimal sensitiv-ity for the 5.2-µm i.d. capillary tip when the applied voltage was maintained between 20 and 25 kV.
Figure 8 displays the ESI mass spectra of cytochrome c [100 µg/mL in methanol/2% acetic acid (1:1, v/v)] obtained after applying different voltages to the sample reservoir and using a pulled bare-capillary tip as the spray tip. The quality of the mass spectra deteriorated for applied voltages >12 kV. On the basis of these results, we believe that the infusion voltage should remain in the range 2-10 kV to obtain reasonable ionization efficiencies Figure 9. (a) Plot of the ion intensity atm/z531 as a function of
the inner diameter of the capillary tip; the bradykinin sample was infused continuously by applying a potential of 2 kV to the capillary inlet reservoir only. (b) Plot of the ion intensity atm/z531 as a function of the voltage applied to the sample inlet reservoir. These values were obtained after using a pulled bare-capillary tip as a spray emitter to infuse bradykinin solution continuously into the mass spectrometer. (c) Plot of the ion intensity atm/z531 obtained after positioning the capillary tip at different distances from the mass spectrometer and using continuous nanoinfusion of bradykinin. The bradykinin solution (10µg/mL) used in these studies was dissolved in 5 mM ammonium acetate (pH 3).
Figure 10. (a) Electropherogram obtained by CE-ESI analysis of the cytochromec(10µM) tryptic digest product. (b) Ion currents reconstructed from selected values ofm/zfor the tryptic digest product.
for protein samples. The reason the protein and peptide samples have different tolerances toward the high applied voltages may be due to their different ionization properties. A peptide sample solution can be ionized easily in the absence of an acid, but this characteristic is not the case for protein samples.
The running buffers used for the above experiments all contain organic solvents, but most capillary electrophoresis analyses are performed in aqueous solutions. Thus, we were interested in investigating whether aqueous system can be employed effectively with this approach. We configured the CE apparatus horizontal with respect to the mass spectrometer to perform the following experiments. Figure 9a presents a plot of the ion intensity of the doubly charged ion of bradykinin (m/z 531) as a function of the inner diameter of the pulled capillary tip; bradykinin was dissolved in a 100% aqueous buffer (5 mM ammonium acetate, pH 3). The ion intensity increased gradually upon decreasing the inner diameter of the capillary tip. Figure 9b presents a plot of the intensity of the doubly charged ion of bradykinin (m/z 531) with respect to the applied voltage on the sample reservoir when using a pulled bare-capillary tip (i.d. 5.2 µm) as the spray emitter. The ion intensity decreased gradually upon increasing the voltage applied to the sample reservoir. Figure 9c presents the doubly charged ion of bradykinin (m/z 531) as a function of the analysis time when the capillary tip was positioned at different distances from the metal orifice of the mass spectrometer; the bradykinin sample was infused continuously by applying a potential of 2 kV to the capillary inlet reservoir only. The results indicate that the total ion intensity is increased when the capillary tip is moved closer to the metal orifice of the mass spectrometer, but the ion current is unstable when the capillary tip is positioned too close to the metal orifice, which can be observed from the error bars presented in Figure 9c.
Figure 10a displays the electropherogram obtained by CE-ESI mass spectrometric analysis of the cytochrome c tryptic digest product; Figure 10b presents the ion currents reconstructed for
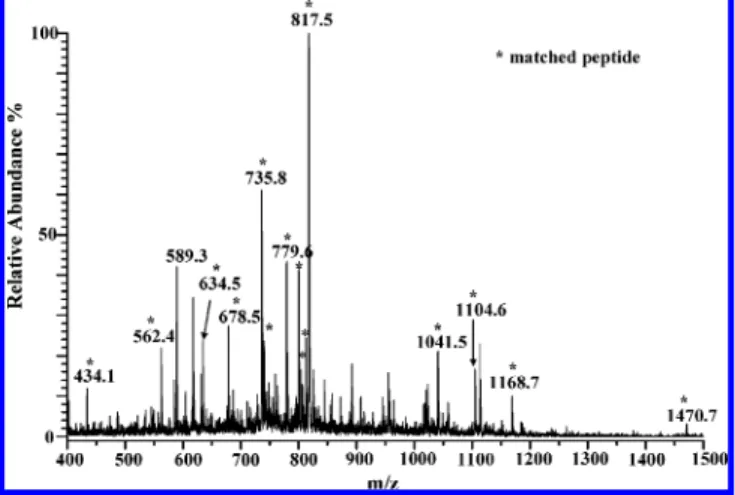
selected values of m/z for the tryptic digest product. CE/ESI-MS can separate the complex digest product crudely when using the pulled bare capillary tip directly as the electrospray emitter. Figure 11 presents the ESI mass spectrum of the cytochrome c tryptic digest product obtained by summing the mass spectra in Figure 10 at migration times between 18.5 and 19.3 min. From protein database searches, these mass spectra allow cytochrome c to be identified as the parent protein. The peaks marked with asterisks represent the peptide residues of cytochrome c. Table 1 lists the values of m/z, charge state, and molecular masses matched with their corresponding amino acid sequences. These results indicate that using the pulled bare-capillary tip directly as the ESI emitter is suitable for combined CE/ESI-MS analyses.
CONCLUSIONS
We have demonstrated that a pulled bare capillary tip can generate electrospray ionization for biomolecular samples of peptides and proteins even when the outlet of the capillary tip is neither coated with an electrically conductive material nor subjected to a high applied voltage. The detection limits are comparable to those obtained when using a metal contact at the outlet of the capillary tip. Our home-built sheathless CE/ESI nanospray interface provides a very simple means to couple CE directly with ESI-MS. Fabricating such nanospray emitters is a low-cost and rapid process.
ACKNOWLEDGMENT
We thank the National Science Council (NSC) of Taiwan for supporting this research financially. We also thank Dr. Chun-hsien Chen’s group for assistance in obtaining the current values in the CE analyses.
Received for review November 8, 2004. Accepted January 13, 2005.
AC048349I Figure 11. ESI mass spectrum of cytochromec(43.8 fmol) tryptic
digest obtained by summing the electropherogram presented in Figure 10a over the range 18.5-19.3 min. The flow rate was∼52.5 nL/min, and the applied voltage on the buffer reservoir was 10 kV.
Table 1. Ions Observed in the ESI Mass Spectrum of
CytochromecTryptic Digest and a Comparison with
the Output of the NCBI Database
observed m/z peak charge state molecular mass peptide sequence (start-end) 434.1 1+ 433.1 ATNE 101-104 562.4 1+ 561.4 KATNE 100-104 634.5 1+ 633.5 IFVQK 9-13 678.5 1+ 677.5 YIPGTK 74-79 779.5 1+ 778.5 MIFAGIK 80-86 1168.8 1+ 1167.8 TGPNLHGLFGR 28-38 735.8 2+ 1469.68 TGAPGFTYTDANK 40-53 740.1 2+ 1478.1 TEREDLIAYLKK 89-100 800.0 2+ 1598.0 KTGQAPGFTYTDANK 39-53 804.1 2+ 1606.1 KTEREDLIAYLKK 88-100 812.5 2+ 1623.9 EETLMEYLENPKK 61-73 817.5 2+ 1632.8 IFVQKCAQCHTVEK 9-22 1041.0 2+ 2080.1 GITWKEETLMEYLENPK 56-72 1104.6 2+ 2207.2 GITWKEETLMEYLENPKK 56-73


![Figure 8 displays the ESI mass spectra of cytochrome c [100 µg/mL in methanol/2% acetic acid (1:1, v/v)] obtained after applying different voltages to the sample reservoir and using a pulled bare-capillary tip as the spray tip](https://thumb-ap.123doks.com/thumbv2/9libinfo/7890404.155595/6.918.83.847.570.1074/displays-cytochrome-methanol-applying-different-voltages-reservoir-capillary.webp)