Temperature Dependence of Rate Coefficients of Reactions of NO
2with CH
3S and C
2H
5S
Po-Fu Chang, Tsai T. Wang, and Niann S. Wang*
Department of Applied Chemistry, National Chiao Tung UniVersity, 1001, Ta Hsueh Road, Hsinchu, Taiwan 30010
Yu-Lian Hwang and Yuan-Pern Lee
Department of Chemistry, National Tsing Hua UniVersity, 101, Sec. 2, Kuang Fu Road, Hsinchu, Taiwan 30013
ReceiVed: January 24, 2000; In Final Form: April 5, 2000
Rate coefficients of reactions (1) CH3S + NO2and (2) C2H5S + NO2were determined using laser photolysis and laser-induced fluorescence. CH3S and C2H5S radicals were generated on photolysis of CH3SSCH3and C2H5SSC2H5, respectively, with a KrF excimer laser at 248 nm. Their concentrations were monitored via fluorescence excited by emission from a dye laser at 371.4 nm (for CH3S) or 410.3 nm (for C2H5S) pumped with a pulsed XeCl excimer laser at 308 nm. Our measurements show that k1(297 K) ) (1.01 ( 0.15)× 10-10cm3molecule-1s-1is similar to a value reported by Balla et al. and approximately 50% greater than other previously reported values; listed errors represent 95% confidence limits. Reaction 1 has a negative activation energy: k1) (4.3 ( 1.3) × 10-11exp[(240 ( 100)/T] cm3molecule-1 s-1for T ) 222-420 K. Reaction 2 has a rate coefficient similar to reaction 1 at room temperature: k2(296 K) ) (1.05 ( 0.16)× 10-10cm3molecule-1 s-1but has a small positive activation energy with k
2) (2.4 ( 0.7) × 10-10 exp[-(210 ( 80)/T] cm3molecule-1s-1for T ) 223-402 K. The temperature dependence of k
2is determined for the first time. Reactions of NO2with HS, CH3S, and C2H5S are compared.
I. Introduction
Reduced sulfur compounds such as CH3SCH3, CH3SH, and CH3SSCH3play an important role in atmospheric chemistry. These compounds are produced biogenically and released into the atmosphere at a rate comparable with emission of SO2from human activity.1,2Oxidation of these reduced sulfur compounds is initiated primarily through reactions with OH, NO3, or halogen atoms.3-5 The CH
3S radical is believed to be the key intermediate3-6in these oxidative processes in the atmosphere.5-12 Although there is no report on atmospheric observation of higher sulfides, one expects that C2H5S also plays a role in oxidation of biogenic sulfur compounds; their chemistry is hence critical in an assessment of the final oxidation products and their importance.
Among possible atmospheric reactions of CH3S and C2H5S, the title reactions
and their reaction with O3
are likely the most important. We have investigated all four reactions using laser photolysis (LP)/laser-induced fluorescence
(LIF). Here we report kinetic studies of reactions with NO2, whereas investigations on reactions involving O3will be reported separately.
Reaction 1 was studied by three groups. Balla et al.13,14 determined the rate coefficients of reactions of CH3S with NO, NO2, O3, and several unsaturated hydrocarbons over the temperature range 295-511 K by means of the LP/LIF technique under pseudo-first-order conditions; they reported k1
) (1.06 ( 0.06) × 10-10 cm3 molecule-1 s-1. Tyndall and
Ravishankara15employed a similar method and reported k 1) (6.1 ( 0.9) × 10-11 cm3 molecule-1 s-1. Domine et al.16 investigated reaction 1 in a discharge-flow system and used a photoionization mass spectrometer to detect CH3S and other species; their value, k1) (5.1 ( 0.9) × 10-11cm3molecule-1 s-1 at 297 K and 1 Torr is similar to that of Tyndall and Ravishankara. Later, Turnipseed et al.17discovered that CH
3S might form a weakly bound adduct with O2
such that under atmospheric conditions, especially at low temperatures, as much as 80% of CH3S would be in the form of CH3SOO. Rate coefficient k6 of the reaction of CH3SOO with NO2,
was determined to be (2.2 ( 0.6)× 10-11cm3molecule-1s-1 in a range T ) 227-246 K. They also reinvestigated18reaction 1 in the temperature range 242-350 K and obtained k1) (6.28
( 0.28) × 10-11 cm3 molecule-1 s-1 and its temperature
* To whom correspondence should be addressed. E-Mail: nswang@ cc.nctu.edu.tw. Fax: 886-3-5723764. CH3S + NO2f products (1) C2H5S + NO2f products (2) CH3S + O3f products (3) C2H5S + O3f products (4) CH3S + O2{\}M CH3SOO (5) CH3SOO + NO2f products (6)
10.1021/jp000294a CCC: $19.00 © 2000 American Chemical Society Published on Web 05/19/2000
dependence as k1) (2.06 ( 0.44) × 10-11exp[(320 ( 40)/T] cm3molecule-1s-1.
According to the only report on the kinetics of reaction 2, Black et al.19determined rate coefficients for the reactions of C2H5S with NO2, NO, and O2at 296 K by means of the LP/ LIF technique and reported k2 ) (9.2 ( 0.9) × 10-11 cm3 molecule-1s-1. Information about the temperature dependence of k2is lacking.
In view of large variations in reported values of k1, and the single measurement on k2, we studied both reactions 1 and 2. We compare rate coefficients of NO2with HS, CH3S, and C2H5S with an objective to understand the effect of alkyl groups in reaction kinetics.
II. Experiments
As the experimental setup and the technique are described in detail previously,20,21 only a summary is given here. The reaction vessel is a jacketed tube of 40 mm diameter with four sidearms (approximately 15 cm in length) and fitted with Brewster windows. The reaction temperature is regulated on circulating suitable fluid from a thermostated bath through the jacket. CH3S and C2H5S radicals were produced by photolysis of DMDS (dimethyl disulfide, CH3SSCH3) and DEDS (diethyl disulfide, C2H5SSC2H5), respectively, with a pulsed KrF excimer laser at 248 nm (5-16 mJ cm-2, 10 Hz). Excess He gas was added to the system and conditions were arranged to ensure that the reactant CH3S and C2H5S were thermalized before detection. CH3S and C2H5S were excited with a dye laser (<10 mJ) pumped by a XeCl excimer laser at 308 nm. For CH3S the excitation wavelength was set at either 371.4 or 377.0 nm, corresponding to excitation from the ground state X2E to the
A2A (v′
3) 1 or 0) state.22,23A filter with passband 450 ( 12 nm or a cutoff filter that passes emission with λ > 450 nm served to select the wavelength region to be monitored. C2H5S was excited from its ground state 2A′to the B 2A′(v′
3) 2) state at 410.3 nm.24,25Filtered fluorescence in the spectral region 470 ( 5 nm was used to probe its concentration.
The fluorescence was collected perpendicular to both pho-tolysis and probe laser beams with a fused silica lens before detection with a photomultiplier tube (Hamamatsu R955). The signal was integrated over a period 1-2 µs after probe-laser excitation with a gated integrator (Stanford Research Systems, SR245); the scattered light diminished within 1µs after laser excitation. The background signal, typically∼10% of fluores-cence signal, was measured at 75 ms after laser photolysis and subsequently subtracted. The signal was typically averaged over 30-60 laser pulses. The delay between pulses from the photolysis and probe lasers was varied from 10 to 150µs to construct a temporal profile of CH3S or C2H5S; both lasers were triggered from a pulse/delay generator (Stanford Research Systems, DG535) at a repetition rate of 10 Hz.
He (99.9995%) and O2(99.999%) were used without further purification. NO2, prepared from slow reaction of NO with excess O2, was stored under O2 (3 atm) for more than 24 h before use. A mixture (0.98%) of NO2in He at a total pressure
∼1000 Torr was prepared with standard gas-handling technique. Dimerization of NO2(<8%) was taken into account, and the concentration of NO2was further calibrated with FTIR spec-trometry. DMDS (99%) and DEDS (99%, both from Aldrich) were purified by trap-to-trap distillation and diluted (volumetric ratio 2-4%) in He. Flow rates of carrier gases were measured with mass flow meters (Tylan FM360). Flow rates of DMDS, DEDS, and the NO2/He mixture were determined on observing the pressure increase in a calibrated volume within a specific
period. At low temperature, equilibrium between NO2and N2O4 was taken into account and the concentration of NO2 in the reaction vessel was corrected accordingly. At 222 K the correction was∼25% at the highest NO2concentration (3.3× 10¹⁴molecules cm-3, after correction) employed. However, at 234 K the correction decreased to∼8%.
III. Results and Discussion
The experiments were carried out under pseudo-first-order conditions with [NO2] . [R] (R ) CH3S and C2H5S). Excellent linearity was observed in the semilogarithmic plot of ln [R] vs reaction period. The slope gives the first-order decay rate, kI, of radicals of interest at a specific [NO2].
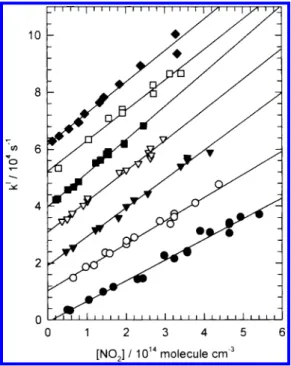
A. Rate Coefficient of the Reaction CH3S + NO2. Values of kIfor reaction 1 at 297 K are plotted against [NO
2] in Figure 1 (symbol 1, the ordinate is shifted upward by 20 000 s-1for clarity). The slope yields a bimolecular rate coefficient k1) (1.01 ( 0.05)× 10-10cm3molecule-1s-1; the error represents two standard deviations. The initial concentration of CH3S, [CH3S]0, was estimated from the absorption cross section and quantum yield of DMDS (1.24× 10⁻¹⁸cm2andΦ(CH
3S) ) 1.80 ( 0.21)26,27at 248 nm and the fluence of the photolysis laser. In these experiments, [CH3S]0 ) (0.4-3.3) × 1012 molecules cm-3. Variation of [CH3S]0(over a factor of 8) or flow velocity (from 4 to 19 cm s-1) or pressure (from 70 to 202 Torr) altered the rate coefficient less than 12%. Systematic error (measurements of flow rates, pressure, and temperature) of our system is estimated to be∼8%20,21and error in fitting a slope is∼5%. Hence, we estimate an error approximately 15% for k1and recommend a rate coefficient (1.01 ( 0.15)× 10-10 cm3molecule-1s-1.
Rate coefficients k1were determined also at 222, 234, 250, 273, 346, and 420 K; these data (kIvs [NO
2]) are also shown in Figure 1, for which the ordinates are shifted by 60 000, 50 000, 40 000, 30 000, 10 000, and 0 s-1, respectively, for clarity. The experimental conditions and bimolecular rate coefficients k1fitted with least squares at various temperatures are listed in Table 1; estimated errors represent two standard
Figure 1. Plots of pseudo-first-order decay rate kIof CH
3S as a function
of [NO2] at various temperatures: T ) 222 K ((), 234 K (0), 250 K
(9), 273 K (3), 297 K (1), 346 K (O), and 420 K (b). The ordinates are shifted upward in steps of 10 000 s-1for clarity of depiction.
deviations from the fitting. The value of k1increases from 7.3
× 10-11to 12.2× 10⁻¹¹cm3molecule-1s-1as the temperature decreases from 420 to 234 K but remains approximately constant on further decrease to 222 K. Possible condensation of NO2on the reactor wall at low temperature might result in a smaller measured value of k1. However, after careful test of the concentration of NO2 with FTIR before and after passage through the reaction vessel at low temperature, we found only slight evidence of condensation of NO2 (<5%). At low temperature, the correction of NO2depends significantly on its dimerization equilibrium constant. We employed the recom-mended value commonly used in stratospheric modeling.28 When the high-limit of the equilibrium constant was used, the maximum correction increased from 25% to 34% at 222 K; hence k1 increased from 1.2 to 1.4× 10⁻¹⁰ cm3molecule-1 s-1.
An Arrhenius plot of k1is shown in Figure 2. A fit of these data yields k1) (4.3 ( 1.0) × 10-11 exp[(241 ( 62)/T] cm3 molecule-1s-1; the error limits represent two standard devia-tions. When the datum at the lowest temperature (222 K) was excluded in the fitting, we obtained k1) (3.8 ( 0.7) × 10-11 exp[(278 ( 48)/T] cm3molecule-1 s-1. Considering possible systematic errors, we report k1) (4.3 ( 1.3) × 10-11exp[(240
( 100)/T] cm3molecule-1s-1.
Rate coefficients k1at ambient temperature and their tem-perature dependence reported previously are compared with our results in Table 2. The value of k1at 297 K determined in this work is near that, (1.06 ( 0.06)× 10-10cm3molecule-1s-1, reported by Balla et al.13Rate coefficients reported by Tyndall and Ravishankara,15(6.10 ( 0.90)× 10-11cm3molecule-1s-1, and Domine et al.,16(5.10 ( 0.90) × 10-11 cm3molecule-1
s-1, are approximately 40-50% smaller. Balla et al.13found that the rate coefficient depended on the flow rate in the system,
which they interpreted as being due to a heterogeneous reaction between DMDS and NO2. Tyndall and Ravishankara15observed a slight decrease in rate coefficient at large residence periods (∼20 s) but only a negligible decrease (<4%) in [DMDS] or production of NO when the reactants were flowed together in the dark. Balla et al. appeared to have used a greater energy (∼18 mJ pulse-1) of the photolysis laser. Tyndall and Ravi-shankara15noted that a large concentration of radicals in the work of Balla et al. might account for the difference in k1. When we employed [CH3S]0similar to that in work of Tyndall and Ravishankara, (0.2-1.4)× 1012molecules cm-3, our value of k1 remained much greater than theirs; the reason for this discrepancy is unclear. The absorption cross section of NO2at 248 nm is small; the valueσ ) 2.75× 10⁻²⁰cm2molecule-1 27 implies that at most 0.1% of NO2is photodissociated. The rate coefficient for the reaction
is smaller than k1, with a high-pressure limit k∞) (3.9 ( 0.6)
× 10-11cm3molecule-1s-1.13For this reason minor photolysis of NO2has no effect on measurements of k1.
The self-reaction of CH3S,
with k8 ) 4.0 × 10⁻¹¹ cm3 molecule-1 s-1 29 contribute inappreciably to decay of [CH3S] because [CH3S]0 < 3.3 × 10¹²molecules cm-3. This is also supported by observation of only a small decay rate (<800 s-1) when no NO2was added to the system.
The negative activation energy (E/R ) -240 ( 100 K) determined in this work is similar to that (-320 ( 40 K) reported by Turnipseed et al.,18with error limits overlapping each other. The value E/R ) -81 K reported by Balla et al.14 is slightly smaller. All three reports indicate a small negative temperature dependence of k1; the agreement is satisfactory.
According to previous work15,16 CH
3SO and NO are the primary products of reaction 1
with quantum yieldsΦ(NO) ) 0.8 ( 0.2 and Φ(CH3SO) ) 1.07 ( 0.15. No direct evidence for the termolecular combina-tion or for abstraccombina-tion of H
was found in previous kinetic studies. However, experiments in smog chambers indicated production of CH3SNO2as a minor product.30 Whether CH
3SNO2 was produced directly from reaction 1b or from other reactions is unclear. That k1 is independent of both the pressure and nature of carrier gas is consistent with CH3SO and NO being major products.
The product CH3SO may react further with NO2and produce secondary NO,
Tyndall and Ravishankara15observed [NO] to increase with two components with time constants separated by a factor∼10. They also observed fluorescence resulting from a distinct species of which the temporal profile is consistent with that predicted for CH3SO2. On modeling observed temporal profiles of NO, they TABLE 1: Experimental Conditions and Bimolecular Rate
Coefficients for CH3S + NO2
T/K P/Torr no. expt [NO2]a/1014 k1b/10-11
420 70-117 18 0.5-5.5 7.3 ( 0.5c 346 55-106 14 0.6-4.4 8.2 ( 0.6 297 71-202 12 0.4-4.1 10.1 ( 0.5 273 101 14 0.4-2.9 10.8 ( 0.6 250 101 13 0.2-2.4 11.8 ( 0.6 234 58-106 9 0.3-3.4 12.2 ( 1.0 222 101 12 0.2-3.3 12.0 ( 0.7
aIn units of molecules cm-3.bIn units of cm3molecule-1s-1.cError limits are 2σ.
Figure 2. Arrhenius plot of k1; this work (b); Balla et al.13(4); Tyndall
and Ravishankara15(1); Domine et al.16()); Turnipseed et al.18(0).
CH3S + NO 98M CH3SNO (7) CH3S + CH3S f other products (8) CH3S + NO2f CH3SO + NO (1a) CH3S + NO298M CH3SNO2 (1b) CH3S + NO2f H2CS + HONO (1c) CH3SO + NO2f CH3SO2+ NO (9) 2 3 2 5
obtained k9) (8 ( 5) × 10-12cm3molecule-1s-1, about one-tenth of k1. This secondary reaction does not affect k1measured on monitoring the decay of [CH3S] in our work.
B. Rate Coefficient of the Reaction C2H5S + NO2. C2H5S was produced from photolysis of DEDS at 248 nm. The rate coefficients of reaction 2 were determined at 11 temperatures in a range 223-402 K. Representative plots of kIvs [NO
2] are shown in Figure 3 for T ) 230, 253, 296, 348, and 402 K. The data obtained at various pressures are indicated for 296 K. The slope of each line yields k2at a particular temperature. Table 3 summarizes experimental conditions and k2at various temper-atures; the error limits represent 2σ from a fit with least squares. At 296 K, k2) (1.05 ( 0.06) × 10-10 cm3molecule-1 s-1.
Taking into account possible systematic errors, we report k2) (1.05 ( 0.16)× 10-10cm3molecule-1s-1at 296 K. The rate coefficient decreases slightly as temperature decreases from 402 to 223 K. An Arrhenius plot of k2is shown in Figure 4. A least-squares fit yields k2) (2.38 ( 0.31) × 10-10exp [-(207 ( 36)]/T] cm3molecule-1s-1, in which error limits represent two
standard deviations from the fit. Considering possible systematic errors, we report k2) (2.4 ( 0.7) × 10-10exp[-(210 ( 80)/
T] cm3molecule-1 s-1.
For the single reported determination of k2, Black et al.19 studied the kinetics of reaction 2 at 296 K with a technique similar to ours. Both C2H5SH and DEDS served as precursors of C2H5S. They observed slight regeneration of C2H5S when C2H5SH was used to produce C2H5S and [NO2]/[C2H5SH] was small. The reason is that H atoms produced from photolysis of C2H5SH react with NO2to form OH, which subsequently reacts with C2H5SH to regenerate C2H5S. When they used DEDS as a precursor or used [NO2]/[C2H5SH]≈ 133, such an interference was diminished. They obtained k2) (9.2 ( 0.9) × 10-11cm3 molecule-1s-1, which agrees with our value within quoted error limits.
The temperature dependence of k2is determined for the first time. It shows a small positive activation energy in contrast with k1that has a negative activation energy.
C. Comparison of Reactions of NO2with HS, CH3S, and
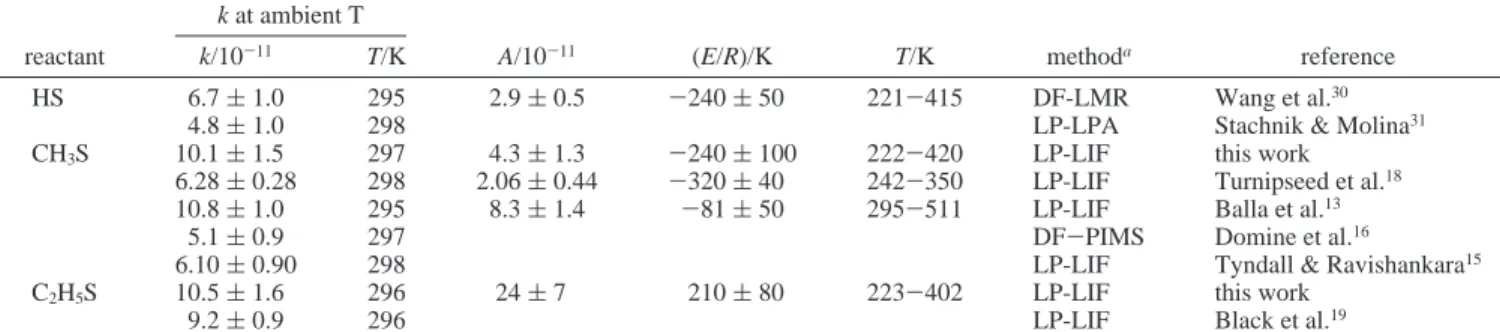
C2H5S. For reactions of NO2with HS, CH3S, and C2H5S, rate coefficients at ambient temperature and their temperature dependence are compared in Table 2. Rate coefficients of reactions of CH3S and C2H5S are nearly identical, and slightly TABLE 2: Comparison of Rate Coefficients of Reactions of NO2with HS, CH3S, and C2H5S
k at ambient T
reactant k/10-11 T/K A/10-11 (E/R)/K T/K methoda reference
HS 6.7 ( 1.0 295 2.9 ( 0.5 -240 ( 50 221-415 DF-LMR Wang et al.30
4.8 ( 1.0 298 LP-LPA Stachnik & Molina31
CH3S 10.1 ( 1.5 297 4.3 ( 1.3 -240 ( 100 222-420 LP-LIF this work
6.28 ( 0.28 298 2.06 ( 0.44 -320 ( 40 242-350 LP-LIF Turnipseed et al.18
10.8 ( 1.0 295 8.3 ( 1.4 -81 ( 50 295-511 LP-LIF Balla et al.13
5.1 ( 0.9 297 DF-PIMS Domine et al.16
6.10 ( 0.90 298 LP-LIF Tyndall & Ravishankara15
C2H5S 10.5 ( 1.6 296 24 ( 7 210 ( 80 223-402 LP-LIF this work
9.2 ( 0.9 296 LP-LIF Black et al.19
aDF ) discharge-flow; LMR ) laser magnetic resonance; LP ) laser photolysis; LPA ) long-path absorption; LIF ) laser-induced fluorescence; PIMS ) photoionization mass spectrometry.
Figure 3. Plots of pseudo-first-order decay rate of C2H5S as a function
of [NO2] at T ) 230 K ()), 269 K (b), 296 K [(0) 65 Torr; (O) 213
Torr; (4) 484 Torr], 348 K (2), and 402 K (3). For clarity the ordinates are shifted uprard in steps of 2000 s-1, respectively.
TABLE 3: Experimental Conditions and Bimolecular Rate Coefficients for C2H5S + NO2
T/K P/Torr no. expt [NO2]a/1013 k2b,c/10-10
402 110 8 0.7-6.9 1.45 ( 0.14 372 100-111 9 0.7-6.8 1.39 ( 0.16 348 106 7 1.0-7.5 1.39 ( 0.09 319 67 6 1.2-8.8 1.23 ( 0.16 296 65-484 21 2.2-15.2 1.05 ( 0.06 288 65 8 1.3-9.6 1.09 ( 0.10 269 66 6 1.3-10.0 1.06 ( 0.13 253 65 8 1.8-12.2 1.05 ( 0.13 238 65 8 2.1-11.8 1.01 ( 0.08 230 66 7 1.7-12.0 0.99 ( 0.06 223 66 7 1.9-10.6 0.96 ( 0.04
aIn units of molecules cm-3.bIn units of cm3molecule-1s-1.cError
limits are 2σ.
greater than that for HS,28,31,32but the activation energy varies from E/R∼ (-240) K for HS and CH3S to∼210 K for C2H5S. Although formation of HSO (or CH3SO) and NO is identified as the major channel,
the small negative temperature dependence indicates that the reactions probably proceed through formation of an adduct that decomposes readily. The most likely adducts are HSONO and CH3SONO. A finite activation energy is expected for formation of HSO (or CH3SO) + NO from HSNO2(or CH3SNO2). If we assume that HS and CH3S react via similar paths, a greater preexponential factor (A) is expected for reaction 1a. Our value of (4.3 ( 1.3)× 10-11is consistent with such expectation. The value (2.06× 10⁻¹¹) reported by Turnipseed et al.18for reaction 1a is smaller than that (2.9× 10⁻¹¹) reported for reaction 10a. Because no product analysis was performed for reaction 2, we cannot explain definitively why the temperature dependence becomes positive as the reactant varies from CH3S to C2H5S. One possibility is that the H-abstraction channel (reaction 2b) becomes more important in this case,
so that its positive temperature dependence contributes more to the apparent rate coefficient than in cases of HS and CH3S. Further experiments are needed to confirm this postulate.
D. Implications for Atmospheric Chemistry. On the basis
of present kinetic data, reaction 1 is negligible in the clean marine troposphere because a mixing ratio with NO2at 100-300 ppt gives a loss rate of 0.3-0.8 s-1for CH3S.3However, in polluted regions in which NOx concentrations can reach to the ppb level, reaction 1 becomes as important as reaction 3.33 The greater value of k1determined in this work increases the relative importance of reaction 1 in oxidation of CH3S in polluted air.
Rate coefficients for reactions of C2H5S with NO2and O3,
are k2) (1.05 ( 0.16) × 10-10and k4) (7.2 ( 1.0) × 10-12 cm3molecule-1s-1,34respectively. The rate of loss of C
2H5S through reaction with NO2is similar to that of CH3S at room temperature, but it decreases at low temperatures because of its positive temperature dependence. The ratio k2/k4for C2H5S is near k1/k3 for CH3S at 297 K, indicating that reaction 2 is unimportant in the clean air, similar to the case of CH3S.
Acknowledgment. We thank the National Science Council
of the Republic of China (grants no. NSC89-2119-M-007-001 and NSC89-2113-M-009-010) for support.
References and Notes
(1) Bates, T. S.; Lamb, B. K.; Guenther, A.; Dignon, J.; Stoiber, R. E.
J. Atmos. Chem. 1992, 14, 315.
(2) Spiro, P. A.; Jacob, D. J.; Logan, J. A. J. Geophys. Res. 1992, 97, 6023.
(3) Tyndall, G. S.; Ravishankara, A. R. Int. J. Chem. Kinet. 1991, 23, 483.
(4) (a) Atkinson, R.; Pitts, J. N., Jr.; Aschrnann, S. M. J. Phys. Chem.
1984, 88, 8, 1584. (b) MacLeod, H.; Aschmann, S. M.; Atkinson, R.;
Tuazon, E. C.; Sweetman, J. A.; Winer, A. M.; Pitts, J. N., Jr. J. Geophys.
Res. 1986, 91, 5338.
(5) (a) Yin, F.; Grosjean, D.; Seinfeld, J. H. J. Atmos. Chem. 1990,
11, 309. (b) Yin, F.; Grosjean, D.; Flagan, R. C.; Seinfeld, J. H. J. Atmos. Chem. 1990, 11, 365.
(6) Wine, P. H.; Kreutter, N. M.; Gump, C. A.; Ravishankara, A. R. J.
Phys. Chem. 1981, 85, 2660.
(7) Hynes, A. J.; Wine, P. H. J. Phys. Chem. 1987, 91, 3672. (8) MacLeod, H.; Jourdain, J. L.; Poulet, G.; LeBras, G. Atmos.
EnViron. 1984, 18, 2621.
(9) Niki, H.; Maker, P. D.; Savage, C. M.; Breitenbach, L. P. Int. J.
Chem. Kinet. 1983, 15, 647.
(10) Hatakeyama, S.; Akimoto, H. J. Phys. Chem. 1983, 87, 2387. (11) Grosjean, D. EnViron. Sci. Technol. 1984, 18, 460.
(12) Jensen, N. R.; Hjorth, J.; Lohse, C.; Skov, H.; Restelli, G. J. Atmos.
Chem. 1992, 14, 95.
(13) Balla, R. J.; Nelson, H. H.; McDonald, J. R. Chem. Phys. 1986,
109, 101.
(14) Balla, R. J.; Weiner, B. R.; Nelson, H. H. J. Am. Chem. Soc. 1987,
109, 4804.
(15) Tyndall, G. S.; Ravishankara, A. R. J. Phys. Chem. 1989, 93, 2426. (16) Domine, F.; Murrells, T. P.; Howard, C. J. J. Phys. Chem. 1990,
94, 5839.
(17) Turnipseed, A. A.; Barone, S. B.; Ravishankara, A. R. J. Phys.
Chem. 1992, 96, 7502.
(18) Turnipseed, A. A.; Barone, S. B.; Ravishankara, A. R. J. Phys.
Chem. 1993, 97, 5926.
(19) Black, G.; Jusinski, L. E.; Patrick, R. J. Phys. Chem. 1988, 92, 5972.
(20) Diau, E. W.-K.; Tso, T.-L.; Lee, Y.-P. J. Phys. Chem. 1990, 94, 5261.
(21) You, Y. Y.; Wang, N. S. J. Chin. Chem. Soc. 1993, 40, 337. (22) Chiang, S.-Y.; Lee, Y.-P. J. Chem. Phys. 1991, 95, 66. (23) Suzuki, M.; Inoue, G.; Akimoto, H. J. Chem. Phys. 1984, 81, 4505. (24) Black, G.; Jusinski, J. E. Chem. Phys. Lett. 1988, 136, 241. (25) Hung, W.-C.; Shen, M.-y.; Yu, C.-h.; Lee, Y.-P. J. Chem. Phys.
1996, 105, 5722.
(26) Hearn, C. H.; Turcu, E.; Joens, J. A. Atmos. EnViron. 1990, 24A, 1939.
(27) Schneider, W.; Moortgat, G. K.; Tyndall, G. S.; Burrows, J. P. J.
Photochem. Photobiol. 1987, 40, 195.
(28) DeMore, W. B.; Sander, S. P.; Golden, D. M.; Hampson, R. F.; Kurylo, M. J.; Howard, C. J.; Ravishankara, A. R.; Kolb, C. E.; Molina, M. J. Chemical Kinetics and Photochemical Data for Use in Stratospheric
Modeling; JPL Publication 97-4; Jet Propulsion Laboratory: Pasadena, CA,
1997.
(29) Anastasi, C.; Broomfield, M.; Nielson, O. J.; Pagsberg, P. Chem.
Phys. Lett. 1991, 182, 643.
(30) Barnes, I.; Bastian, V.; Becker, K. H.; Niki, H. Chem. Phys. Lett.
1987, 140, 451.
(31) Wang, N. S.; Lovejoy, E. R.; Howard, C. J. J. Phys. Chem. 1987,
91, 5743.
(32) Stachnik, R. A.; Molina, M. J. J. Phys. Chem. 1987, 91, 4603. (33) Mihalopoulos, N.; Nguyen, B. C.; Boissard, C.; Campin, J. M.; Putaud, J. P.; Belviso, S.; Barnes, I.; Becker, K. H. J. Atmos. Chem. 1992,
14, 459.
(34) Lin, J. T.; Chew, E. P.; Wang, T. T.; Wang, N. S.; Lee, Y. Y.; Chen, I. C.; Lee, Y. P. To be published.
HS + NO2f HSO + NO (10a) CH3S + NO2f CH3SO + NO (1a) C2H5S + NO2f C2H5SO + NO (2a) f (CH3)CHS + HONO (2b) C2H5S + NO2f products (2) C2H5S + O3f products (4) 2 3 2 5