Visual Sensitivity Guided Bit Allocation
for Video Coding
Chih-Wei Tang, Ching-Ho Chen, Ya-Hui Yu, and Chun-Jen Tsai
Abstract—A video bit allocation technique adopting a visual distortion sensitivity model for better rate-visual distortion coding control is proposed in this paper. Instead of applying compli-cated semantic understanding, the proposed automatic distortion sensitivity analysis process analyzes both the motion and the texture structures in the video sequences in order to achieve better bit allocation for rate-constrained video coding. The proposed technique evaluates the perceptual distortion sensitivity on a macroblock basis, and allocates fewer bits to regions permitting large perceptual distortions for rate reduction. The proposed algorithm can be incorporated into existing video coding rate control schemes to achieve same visual quality at reduced bitrate. Experiments based on H.264 JM7.6 show that this technique achieves bit-rate saving of up to 40.61%. However, the conducted subjective viewing experiments show that there is no perceptual quality degradation.
EDICS—1-CPRS, 3-QUAL.
Index Terms—Bit allocation, H.264, psychovisual model, rate-visual distortion analysis, rate-visual attention, rate-visual masking.
I. INTRODUCTION
R
ATE CONTROL plays a key role in a high quality video encoder. The goal is to achieve the best perceptual pic-ture quality at a given bit rate through a proper bit allocation process. Existing rate control algorithms analyze motion ac-tivity predictability, for example, the magnitude of mean abso-lute differences (MAD), for bit-allocation. However, from vi-sual perception point of view, a hard-to-predict area does not necessarily catches as much human attention as an easily pre-dictable area. In order to achieve constant visual quality across different area with optimal bit-allocation, psychophysical model must be taken into account in the bit allocation process.For video codec design, the most widely used performance measure is PSNR. PSNR is usually used as the quality measure because it is mathematically convenient to set a goal to max-imize PSNR. However, quite often, the extra bits an encoder spent to increase PSNR does not cause an increase in visual
Manuscript received September 20, 2004; revised February 25, 2005. This work was supported in part by the National Science Council of Taiwan, R.O.C., under Grant 92-2219-E-009-006 and by MediaTek, Inc., Taiwan. The associate editor coordinating the review of this manuscript and approving it for publica-tion was Dr. Alexander Loui.
C.-W. Tang is with the Mechanical Industry Research Laboratories, Indus-trial Technology Research Institute, Hsinchu 310, Taiwan, R.O.C. (e-mail: [email protected]).
C.-H. Chen, Y.-H. Yu, and C.-J. Tsai are with the Department of Com-puter Science and Information Engineering, National Chiao-Tung Uni-versity, Hsinchu 300, Taiwan, R.O.C. (e-mail: [email protected]; [email protected]; [email protected]).
Digital Object Identifier 10.1109/TMM.2005.861295
quality. It is well recognized that PSNR does not reflect percep-tual quality of a visual sequences [1]. A recent example demon-strating this fact is the ISO/IEC MPEG Call-for-Proposal (CfP) for Scalable Video Coding Technology. During the CfP evalu-ation tests, the PSNR of some MPEG-4 AVC/H.264-coded an-chors increase over one dB when the bitrate doubles. However, the subjective quality indexes (mean opinion scores) of these coded sequences do not go up across the same operating points [2]. This can be explained by the concept of contrast sensitivity function of the human visual system (HVS) [3]. The sensitivity function is a band-pass shaped filter. When the frequency of the input (texture and/or motion) of the displayed pictures is too high, the HVS will reach a saturated point that further increase in the input frequency will no longer increase the visual sensi-tivity. On the other hand, an MAD-guided encoder may allocate more bits to these visually-saturated areas since there are still computable PSNR gains. Thus, this is the basic motivation be-hind our proposed scheme.
Several human attention-based rate control techniques have been developed in the literature. In [4], the human visual system was taken into account by imposing constraints on the PSNR value of the face regions and the temporal delay time. Other researchers propose that, instead of the pixel-wise mean square error (MSE) measure, the perceptual distortion weighted measures should be used [5]–[7]. In [8], more bits are allocated to the face and active regions since they are usually more noticeable. The work in [9] adopts an object tracking technique and a temporal filter to reduce the bits consumption of highly moving background without visual quality loss for scenes with a static face region and high movement background. However, such face-focused coding techniques cannot be applied in a broader sense for general video sequences. In [10], a bit-allo-cation scheme assigns more bits to the foreground satisfying some target visual quality while allows the background quality gracefully degrades as a function of the distance from the foreground.
In this paper, the key concept of our proposed psychovisual model is that for video rate control, visual attention (or fore-ground/background analysis) is not the most important cue for proper bit-allocation. Visual distortion sensitivity (VDS), namely the capability for human vision to detect distortion in video sequences, is what a high quality video coder should take advantage of during the bit-allocation process. VDS is influenced by the motion structure as well as the texture struc-ture of the scene. For example, moving objects with random textures in a video sequence, albeit attract human attentions in most cases, can tolerate high perceptual distortion introduced by the encoder. Without the complicated object segmentation 1520-9210/$20.00 © 2006 IEEE
This model is adopted by the proposed algorithm due to its low complexity and reasonable performance. A new tex-ture-structure model is developed in Section III. The proposed psychovisual model combining the motion attention model and the texture-structure model is described in Section IV. In this section, the bit-allocation mechanism is also proposed. Section V presents some experimental results based on JM7.6 of H.264 to show the effectiveness of the proposed framework. Finally, the conclusions are given in Section VI.
II. THEMOTIONATTENTIONMODEL
Although the human visual model for still image has been well studied, the perceptual distortion metrics involving more sophisticated psychophysical models are not fully understood yet. The visual model for video sequences is quite different from that for still images. For a moving object, the degree of motion of its image on the retinas depends on how well the eyes tracking the object [13]; and eye-tracking is directed by human attention. The theory behind human attention has attracted great focus in the field of psychology, biology, neurophysiology and cogni-tive engineering in the past decades. James [11] first came up with the idea of human attention theory. The behavior of human attention consists of the top-down and the bottom-up processes. The top-down process is intentionally controlled by the human brain to direct one’s attention in order to accomplish a task. One computational model simulating such process can be found in [17]. On the contrary, the bottom-up process is triggered unin-tentionally by certain objects in the surrounding environment and grabs our attentions. The bottom-up visual attention can be further classified into static attention [16], [17] and dynamic (motion) attention [11].
We employ the motion attention model developed in [11]. This model involves low computational complexity since it in-dicates the moving object without global motion estimation and object tracking. This model is composed of the intensity in-ductor, spatial coherence inin-ductor, and the temporal coherence inductor. For a target frame with frame number , the intensity inductor corresponding to the motion intensity for macroblock at location is
(1)
where is the motion vector and is the
maximal motion vector intensity in the th frame. Since camera motion could also cause large intensities, the other two inductors are developed to suppress such negative effect.
The spatial and temporal coherence inductors are based on the concept of the motion vector entropy. The spatial coherence
longing to the same moving object usually lead to small value. However, for moving backgrounds, the value is not always large while the intensity inductor is large.
The temporal consistency inductor is used to discriminate the camera motion from the object motion since the former is usu-ally more stable than the latter during a longer period of time. This inductor is
(3) where is the probability distribution function, and is the number of bins for motion directions histogram (for a tem-poral window of frames).
Finally, the motion attention index of macroblock at location is
(4) All inductor values are between 0 and 1.
III. TEXTURESTRUCTUREMODEL
In still images, the perceptual importance of image regions may be affected by contrast, size, shape, location, and type (fore-ground or back(fore-ground), etc. [15] of the regions. The visual atten-tion for still images can also be determined by a saliency-based model combining the local contrasts of color, intensity, and ori-entation [16]. Although it is possible to use these static visual attention model for bit-allocation decision, the performance on bit-saving may not be too good since these models do not take into account the design of video codecs. A new model that is more suitable for video coding purposes is proposed in this section to discriminate the randomly-textured regions from the structured ones during the bit-allocation process.
Humans are usually more attracted by the regions with higher spatial contrast and weaker correlations of the intensities of the nearby image pixels [19]. These regions contain higher en-tropy and the human visual system tries to maximize the in-formation transmitted to the early stages of visual processing. Regions with large intensity change may contain either the bor-ders of objects (structured texture) or random textures. Gener-ally speaking, we can intuitively distinguish between a region with structured texture and a region with random texture based on the distribution of edge pixels in the region. A randomly-tex-tured region is typically composed of small edges in various ori-entations while a region with structured texture is composed of consistent long edges. Although the randomly-textured regions carry more entropy than the structured regions, human visions are less sensitive to the distortions in the randomly-textured regions since these regions contain too many random stimuli
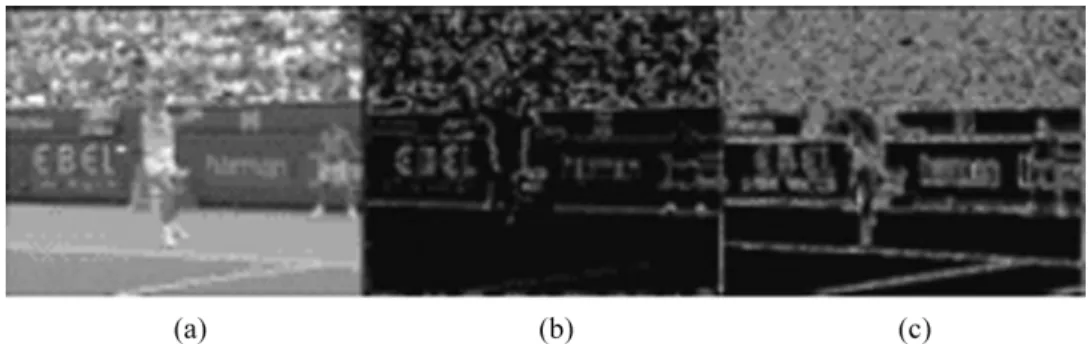
Fig. 1. The 26th frames in the video sequenceSTEFAN: (a) original frame, (b) Canny map, and (c) Sobel map.
Fig. 2. The 6th frames in the video sequenceFOOTBALL: (a) original frame, (b) Canny map, and (c) Sobel map. (small edges) that cover up coding noises. On the contrary,
dis-tortions in the structured regions are more noticeable (even if they are in the background).
In this paper, we propose a texture model for visual distortion sensitivity analysis. The proposed algorithm is as follows. First, an edge-detection operator is applied to each video frame. Next, the mean edge strength and the distribution density of the edge pixels in each macroblock are evaluated for local characteristics extraction. The mean edge strength is computed by
(5) where is the macroblock size (16 in our experiments)and is the intensity value of the pixel at location on the macroblock at location of the th frame. The maximal value of varies with different edge detectors. The distri-bution density of the edge pixels is computed by
(6) if
otherwise (7)
In (7), is a threshold for selecting edge pixels, indi-cates whether the pixel belongs to an edge or not, and . Finally, the texture randomness index for the macroblock at lo-cation is evaluated under the consideration of neighboring
macroblocks, as follows:
(8)
Empirical data show that this index value is large in ran-domly-textured regions but small in structured regions. For structured regions, the index values are much smaller than those in the randomly-textured regions.
One example of the realization of the proposed texture anal-ysis algorithm employs both the Canny and Sobel edge detec-tors. The Canny detector [20] is designed to achieve the fol-lowing goals: 1) It leads to low error rate for edge detection. 2) The edge points are well localized. 3) It has only one response to a single edge. For edge detection, it first eliminates image noise before finding the image gradient. It then applies nonmax-imum suppression by tracking regions with high spatial deriva-tives. Finally, the gradient image is further reduced by hysteresis along the possible edge directions. Figs. 1(b) and 2(b) show the examples of applying the Canny edge detector to 26th frame and 6th in video sequencesSTEFANandFOOTBALL, respectively. We observe that the smooth and texture regions on original im-ages can be distinguished well based on the Canny edge maps. However, among the textured regions (e.g., the tennis player and the audience inSTEFAN), the Canny edge map cannot be used to further distinguish between randomly-textured regions and structured regions. Usually, the randomly-textured regions on an original image are translated into the structured regions due to the nonmaximum suppression and hysteresis processes. Thus, an different edge detector is required to indicate the ran-domly-textured regions.
The Sobel edge detectors [21] provide a possible solution to the above problem. This operator takes the first derivative of the input image, and it has the advantages of enabling both a differ-encing and a smoothing effects. As the examples of Sobel edge maps shown in Figs. 1(c) and 2(c) for the 26th frame and 6th frame in video sequencesSTEFANandFOOTBALL, respectively, we can successfully identify the randomly-textured regions
FOOTBALL) are detected as textured regions by (8). Instead, the Canny edge maps can recognize these regions successfully. Therefore, in the experiments, we first classify texture and smooth regions based on the Canny edge maps by following the measures in (5)–(8). In this case, the macroblock size is 1 1. For those textured regions indicated by the Canny edge maps, we further distinguish the randomly-textured regions from the structured regions with the aid of the Sobel edge maps by following the same process (5)to (8) with .
IV. PROPOSEDBITALLOCATIONSCHEME
To develop a high visual quality video coder, the capability of human vision systems to detect distortions in the video se-quences must be taken into account. The basic idea of our pro-posed bit allocation scheme is to allocate more bits to the video areas where human can easily see coding distortions; and al-locate fewer bits to the area where coding distortions are less noticeable. Human vision systems are more sensitive to percep-tual distortions of smoothly textured (i.e. low spatial frequency) objects with regular motions (trackable by eye movements) in the foreground [13], [22]. These objects typically are suscep-tible to coding distortions due to the inefficiency of block-based motion prediction model. On the other hand, for moving areas with random textures (i.e., high spatial frequency), human vi-sion systems can tolerate high coding distortions [22] even if the motion prediction is ineffective.
The proposed bit allocation algorithm is described as follows. First, the motion attention index with the texture randomness index described in Section II and III, respectively, are com-puted for each macroblock. Secondly, a visual distortion sen-sitivity index (VDSI) for each macroblock is calculated based on both motion attention index and texture randomness index. Finally, the quantization parameters of the encoder are adjusted according to VDSI.
In order to calculate VDSI, we first map the texture random-ness index to a modified index value by
if .
if .
otherwise.
(9) where and are parameters that controls the index value for smooth regions and randomly-textured regions, respectively. and are edge detector-dependent thresholds. For smooth re-gions is less than . Since smooth regions do not con-sume much bandwidth and bitrate reduction for these regions is insignificant, we assign a constant index value to . If is greater than , then the region is a randomly-textured
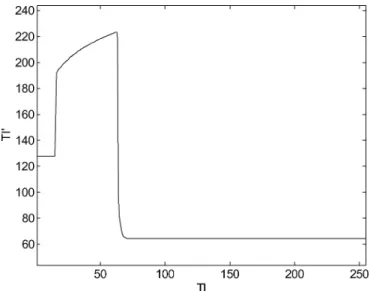
Fig. 3. Mapping function between the texture randomness indexT I and the modified indexT I .
Fig. 4. VDSI maps for (a) 26th frame in STEFAN and (b) 6th frame in
FOOTBALL.
region. In this case, since coding errors is less visible, is designed to drop quickly. In our implementation, the maximal value of VDSI, , is set to 255, and
and . Finally, since visual sensitivity should monotonically increase when texture randomness decreases, log function is employed to simulate the human visual behavior when is between and . The mapping function is shown in Fig. 3.
Now, the visual distortion sensitivity index (VDSI) is defined as
if
otherwise. (10)
where is a threshold for indicating visual attended regions (due to motion structure) and . A macroblock is deemed a motion attended region if it has motion attention index greater than . With the definition of (10), a large index value corresponds to a region permitting small perceptual distortions. The VDSI maps corresponding to different frames inSTEFAN, FOOTBALL, FUNFAIR andMOBILE are shown in Fig. 4(a)–(d). The white regions represent the motion attended ones. From Fig. 4(a) and 4(b), it is observed that the players in the video belong to perceptual distortion sensitive regions. On the other hand, the audiences inSTEFANare assigned small VDSI value since these areas can tolerate large perceptual distortions.
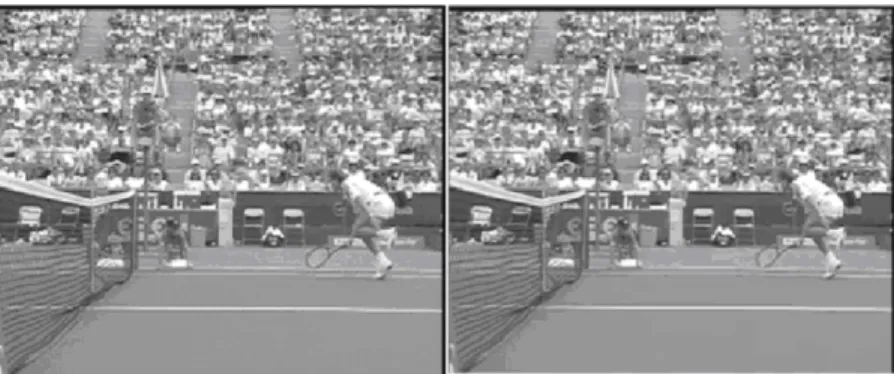
Fig. 5. Comparison of the 280th frames ofSTEFANwith difference bit allocation techniques whenQP = 22: left: bit allocation with fixed QP (PSNR = 39:79 dB). Right: bit allocation with visual distortion sensitivity analysis (PSNR = 34:30 dB).
In a video encoder, bit budget can be allocated to different regions based on VDSI. Although the term “visual distortion sensitivity” is used throughout this paper, the proposed scheme is not designed to operate on a near-threshold basis but to op-erate for suprathreshold distortions. Nevertheless, it is noted that the suprathreshold problem currently has not been fully un-derstood yet and it is questionable to generalize near-threshold models to suprathrehsold ones [22]. Thus, to exhibit how the VDSI may be employed to assist the adjustment of the quanti-zation step size, a simple example is given without employing suprathreshold models. For example, the quantization step size computed by any rate control algorithm can be adaptively ad-justed by adopting the VDSI as follows:
(11) where is the initial quantization parameter assigned by the rate control algorithm, and is a parameter for limiting
the modification of with . In (11), is
always smaller than or equal to . Naturally, there are other ways to define the mapping between VDSI and QP. However, since bitrate-saving without loss of visual quality is the goal of this paper, (11) is used throughout the experiments.
V. EXPERIMENTALRESULTS
We use JM 7.6 of H.264 to conduct the experiments in this section. The configuration of the encoder is as follows. Hadamard transform, CABAC, and in-loop filter are enabled. No B frame is inserted. RDO mode is turned on. The encoded sequences are the CIF versions of STEFAN and FOOTBALL at 30 fps. The parameter settings of the proposed scheme are stated as follows. The spatial window size for computing is 5 5 . The temporal window size for Ct computation is 9. is 16 in (2), is also 16 in (3). is 50 in (7). is 0.4 in (10). and are 16 and 64 in (9), respectively. The motion vectors used in the attention model are generated using the full search motion estimation algorithm with RDO. Constant QP, i.e. no rate control, is used to demonstrate the coding efficiency gain from the proposed psychovisual model.
Tables I and II show the comparisons of coding performance between two different bit allocation techniques (H.264 with constant QP versus H.264 with VDSI) for different video sequences. As shown in Table I, when initial , bit rate
TABLE I
COMPARISONS OFCODINGPERFORMANCEBETWEENTWOBIT
ALLOCATIONTECHNIQUES(H.264 WITHCONSTANTQP
VERSUSH.264 WITHVDSI)FOR STEFAN
TABLE II
COMPARISONS OFPERFORMANCEWITHTWOBITALLOCATIONTECHNIQUES
(H.264 WITHCONSTANTQPVERSUSH.264 WITHVDSI)FORFOOTBALL
reduction is up to 40.61% for STEFAN. Furthermore, there is no visible difference observed even though the overall PSNR decreased by 4.16 dB. To exemplify this result, Fig. 5 compares the visual qualities of two reconstructed frames between the constant QP approach and the proposed bit allocation scheme for STEFAN. As shown in Fig. 5, the PSNR loss is around 5.48 dB, but there are hardly any visual differences between the two images. This is because fewer bits are allocated to visually less sensitivity regions (e.g., the audience) while more bits are assigned to the distortion-sensitive regions (e.g., the tennis player and the text on the fence). It turns out that there is no per-ceptual quality degradation even though the PSNR of the whole video sequence decreases a lot. The inadequacy of PSNR as a distortion measure is shown clearly through these experiments. For those video sequences with few randomly-textured regions, the coding efficiency improvement is limited. For example, for FOOTBALL, the coding efficiency gain is 13% at and it is 4.89% at . The drops in the overall PSNR value corresponding to different rates are all smaller than 1.6 dB.
Fig. 6. Comparisons between the PSNR distortion and rate per frame using uniform bit allocation (constant QP), the VDSI analysis based¨ scheme and JM7.6 with rate control forSTEFAN(Initial QP = 28).
We also conducted some experiments to show the quality of the bitstreams encoded by H.264 with VDSI compared with the bitstreams with matching bitrates generated using a H.264 JM7.6 rate-controlled encoder. Due to the limited space, the de-tailed results are not shown. Again, it is observed that the PSNR values resulted from the H.264 with VDSI scheme are smaller than those from the H.264 with rate control; however, visually, the quality of VDSI coded bitstreams are slightly better.
Fig. 6 gives the comparisons between the distortion and rate per frame using uniform bit allocation (constant QP), the VDSI-based scheme, and JM7.6 with rate control forSTEFAN. The rate curve resulted from our proposed scheme is not as smooth as that from the JM7.6 with rate control. However, it is smoother than the one generated by the H.264 JM7.6 without any rate control module. It is well known that there is the tradeoff be-tween the constant rate and constant quality requirements. The VDSI scheme obviously achieves a good balance between rate-smoothness and quality. In addition, it must be emphasized here that the VDSI bit allocation scheme is not a rate-control scheme. There are no constraints on buffer usage and bitrate smoothness imposed in the VDSI scheme. For practical applications, VDSI should be combined with rate control algorithms.
There has been several objective visual quality assessment matrices designed in the past years. However, the conclusions come from Video Quality Experts Group (VQEG) show that there is no objective measurement (including PSNR) which can replace subjective testing [6]. Furthermore, there is no single objective model outperforms the others in all cases. Therefore, subjective experiments are conducted in this paper to show the performance of our proposal. The test procedures and parame-ters in [2] and [24] are employed while some simplifications are made within a reasonable range due to the available resources. The specification of the LCD monitors used in the subjective viewing tests is listed in Table III. The experiment was exe-cuted with ten testers. The viewing distance was set at three
TABLE III
LCD MONITORSPECIFICATIONUSED IN THESUBJECTIVEVIEWINGTESTS
picture heights (3H). Illumination was minimized yet still al-lowed the testers to fill out the voting form. The test materials were in CIF resolution and viewed in a quasirandom order. That is, the presentation order was modified to avoid the following conditions. 1) Same video sequences presented twice consecu-tively. 2) Same coding algorithm presented twice consecuconsecu-tively. 3) Same coding condition (e.g., bit rate) presented twice consec-utively. A sequences was presented for 10 s followed by a video sequences with black frames lasting for 5 s. After a testing pe-riod of 4 min, the tester took a rest for another 4 min. The coding methods include H.264 JM 7.6 without any rate control, H.264 JM 7.6 with rate control, and H.264 with VDSI.
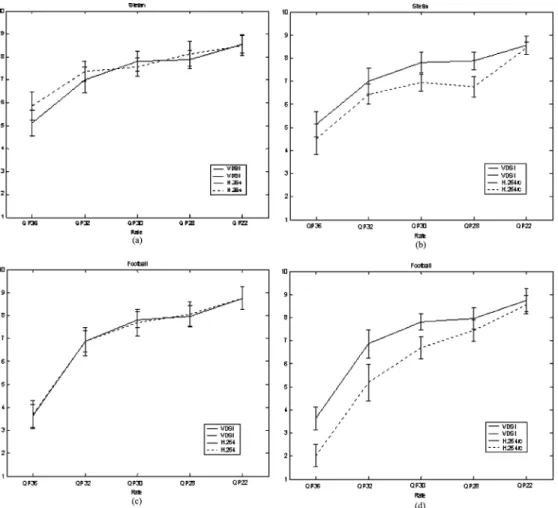
The subjective experimental results are shown in Fig. 7. Our major goal is to compare the viewing experience between the H.264 with rate control and H.264 with VDSI since these two coded sequences having the same bit rates. It is obvious from the experiments that our proposed method produces better visual quality when the sequence contains randomly textured regions as shown in Fig. 7 (STEFAN). Furthermore, the proposed algo-rithm works better than H.264 JM7.6 with constant QP while the bit rate reduction can be up to 41% as shown in Table I. ForFOOTBALLshown in Fig. 7(d), the proposed algorithm also outperforms H.264 JM7.6 with rate control for quantization pa-rameter (QP) greater than 28.
Finally, the complexity of the proposed algorithm is analyzed as follows. For a video sequence at CIF resolution, the compu-tational complexity per frame is shown in Table IV. The analysis
Fig. 7. Comparisons between the subjective experiments using uniform bit allocation forSTEFANandFOOTBALL, respectively(con dence level = 95%): (a) and (c): VDSI analysis based scheme versus H.264 JM7.6 with constant QP. (b) and (d): VDSI analysis based scheme versus H.264 JM7.6 with rate control.
TABLE IV
COMPLEXITYANALYSIS OF THEPROPOSEDALGORITHM
shows that the processing stage of Canny edge detector is the most time consuming. In the experiment, the VDSI analysis and the proposed bit allocation scheme together take about 30 s for theSTEFANsequence (300 frames) and 26 s for theFOOTBALL (260 frames) sequence on a Pentium 4 2.8 G Hz processor. The rest of the encoding time is the same as a regular H.264 encoder with constant QP.
VI. CONCLUSIONS
In this paper, we propose a novel video coder bit allocation technique based on visual distortion sensitivity analysis. This analysis directs the video coder to assign fewer bits to regions that tolerates larger distortions, and accordingly, the bit-rate saving is achieved. The key idea of this approach is to make use
366–406, Mar. 1980.
[2] Subjective Test Results for the CfP on Scalable Video Coding
Tech-nology, Munich, Germany, Mar. 2004, MPEG Meeting Doc. N6383.
[3] D. H. Kelly, “Visual contrast sensitivity,” Opt. Acta, vol. 24, pp. 107–129, 1977.
[4] K. C. Lai, S. C. Wong, and D. Lun, “A rate control algorithm using human visual system for video conferencing systems,” in Proc. Int. Conf.
Signal Processing, vol. 1, Aug. 2002, pp. 656–659.
[5] S. Lee, M. S. Pattichis, and A. C. Bovik, “Foveated video compression with optimal rate control,” IEEE Trans. Image Process., vol. 10, no. 7, pp. 977–992, Jul. 2001.
[6] C.-W. Wong, O. C. Au, B. Meng, and H.-K. Lam, “Perceptual rate con-trol for low-delay video communications,” in Proc. Int. Conf.
Multi-media and Expo, vol. 3, Jul. 2003, pp. 361–364.
[7] (2000, Mar.) Final Report From the Video Quality Experts Group on the Validation of Objective Models of Video Quality Assessment. [On-line]http://www.vqeg.org
[8] M.-J. Chen, M.-C. Chi, C.-T. Hsu, and J.-W. Chen, “ROI video coding based on H.263+ with robust skin-color detection technique,” IEEE
Trans. Consumer Electron., vol. 49, no. 3, Aug. 2003.
[9] T. Adiono, T. Isshiki, K. Ito, T. Ohtsuka, D. Li, C. Honsawek, and H. Ku-nieda, “Face focus coding under H.263+ video coding standard,” in Proc.
Int. Conf. Asia-Pacific Circuits and Systems, Dec. 2000, pp. 461–464.
[10] S. Sengupta, S. K. Gupta, and J. M. Hannah, “Perceptually motivated bit-allocation for H.264 encoded video sequences,” in Proc. ICIP, vol. 3, 2003, pp. 793–799.
[11] Y.-F. Ma and H.-J. Zhang, “A model of motion attention for video skim-ming,” in Proc. ICIP, vol. 1, Sept. 2002, pp. I-129–I-132.
[12] Y.-F. Ma, L. Lu, H.-J. Zhang, and M. J. Li, “A user attention model for video summarization,” in ACM Multimedia’02, Dec. 2002.
[13] B. Girod, “Eye movements and coding of video sequences,” Proc. SPIE,
Visual Communications and Image Processing, pp. 398–405, 1988.
[14] W. James, The Principles of Psychology. Cmabridge, MA: Harvard Univ. Press, 1890.
[15] A. Oliva, A. Torralba, M. S. Castelhano, and J. M. Henderson, “Top-down control of visual attention in object detection,” in Proc. ICIP, vol. 1, Sep. 2003, pp. 253–256.
[16] L. Itti, C. Koch, and E. Niebur, “A model of saliency-based visual atten-tion for rapid scene analysis,” IEEE Trans. Patt. Anal. Mach. Intell., vol. 20, no. 11, Nov. 1998.
[17] J. Han, M. Li, H. Zhang, and L. Guo, “Automatic attention object ex-traction from images,” in Proc. ICIP, vol. 2, Sep. 2003, pp. 403–406. [18] W. Osberger and A. J. Maeder, “Automatic identification of perceptually
important regions in an image,” in Proc. Int. Conf. Pattern Recognition, vol. 1, Aug. 1998, pp. 701–704.
[19] P. Reinagel and A. M. Zador, “Natural scene statistics at the center of gaze,” Network: Comput. Neural Syst., vol. 10, no. 1–10, 1999. [20] J. F. Canny, “A computational approach to edge detection,” IEEE Trans.
Patt. Anal. Mach. Intell., vol. PAMI–8, pp. 679–698, 1986.
[21] R. C. Gonzalez and R. E. Woods, Digital Image Processing. Reading, MA: Addison-Wesley, 1992.
[22] Z. Wang and A. C. Bovik, “A human visual system-based objective video distortion measurement system,” in Proc. Int. Conf. Multimedia
Processing and Systems, Aug. 2000.
[23] Z. Wang, L. Lu, and A. C. Bovik, “Video quality assessment based on structural distortion measurement,” Signal Process.: Image Commun., vol. 19, no. 2, pp. 121–132, Feb. 2004.
[24] A Multimedia Material Visual Quality Ranking Procedure Based on
Single or Multiple Viewing, Redmond, WA, Jul. 2004, MPEG Meeting
Doc. M10935.
Institute, Hsinchu. Her research interests include multimedia signal processing and multimedia communication.
Ching-Ho Chen was born in Kaohsiung, Taiwan, R.O.C., in 1980. He received the B.S. degree in computer science and information engineering from Nation Cheng Kung University, Taiwan, in 2002, and the M.S. degree in computer science and information engineering from Nation Chiao-Tung University, Hsinchu, Taiwan, in 2004.
His research interests are data compression, com-puter networks, and communication systems. For his master thesis, he was working on rate control and rate distortion optimization mechanisms for MPEG-4 and H.264 video coding. In addition, he also developed hardware/software co-design solutions for video rate control. Currently, he is a Research and Development Engineer with Novatek Microelectronics Corporation Taiwan.
Ya-Hui Yu was born in Taipei, Taiwan, R.O.C., in 1980. In 2003, she received the B.S. degree in computer science and information engineering from National Chiao-Tung University, Hsinchu, Taiwan, where she is currently pursuing the M.S. degree. Her research interests include image and video com-pression techniques and rate-distortion modeling of video contents.
Chun-Jen Tsai received the B.S. degree in math-ematics from Fu-Jen Catholic University, Taiwan, R.O.C., in 1989, the M.S. degree in computer science and information engineering from National Taiwan University, Taipei, in 1992, and the Ph.D. degree in electrical engineering from Northwestern University, Evanston, IL, in 1998.
From 1999 to 2002, he was with PacketVideo Cor-poration, San Diego, CA, where he was working on video codec for embedded systems and wireless mul-timedia streaming system design. Since 2000, he has been an U.S. National Body Delegate for ISO/IEC MPEG organization. In 2002, he joined the Department of Computer Science and Information Engineering, National Chiao-Tung University, Hsinchu, Taiwan, where he is currently an As-sistant Professor. His current research interests are in multimedia embedded sys-tems hardware/software co-design, theory and optimization of video compres-sion technologies, and distributed multimedia systems.