台灣房價與少子化關係之探討 - 政大學術集成
65
0
0
全文
(2) The Relationship between Housing Price and Low Fertility Rate. 謝. 誌. 時光飛逝,沒想到一轉眼就到了寫謝誌的這一刻,心中五味雜陳,除了 感激、開心,還有懷念。尤其是攻讀研究所的過程更是難忘,在完成論文的 路上常遇到重重關卡,一波未平一波又起,但我 非常幸運的得到許多貴人的 幫忙及鼓勵,才得以讓我順利畢業,並同時完成自己的夢想。對於最親愛的 你(妳)們,除了感謝,還是感謝! 最感謝的莫過於我的指導教授 -林左裕老師。能當老師的指導學生真的 是我的福氣,老師即使在學術上及行政上的公務繁忙,對學生論文的指導與 關心始終不曾間斷。當我在論文上遇瓶頸時,承蒙老師適時的提點,讓我每 次 meeting 完都有醍醐灌頂的喜悅!也要感謝老師給我機會撰寫英文論文, 讓我在提升研究能力的同時也能訓練英文寫作能力,收穫不少!另外,感謝 彭建文教授及林哲群教授,於百忙之中擔任我的口試委員,並提出不少精闢 的見解,讓本研究更臻完善。還有林秋瑾教授、財政系的吳文傑教授與黃智 聰教授,每當我在模型上有疑慮時皆不厭其煩的給我方向,減少我在摸索時. 立. 政 治 大. ‧ 國. 學. ‧. 間序列模型時的徬徨感 。以及博士班的學長姐 -曉龍學長、芳妮學姊及筱 蓉 學姊,於期中及期末報告時撥空閱讀我的論文及提出許多建議,讓學妹的論 文不論在架構或研究方法上皆更為清楚,也更確定研究方向。另外,感謝信 義房屋企研室的蘇經理提供本研究房價指數之數據,才得以完成此篇論文!. sit. y. Nat. n. al. er. io. 特 別 感 謝 研 究 所 同 窗 好 友 的 陪 伴 及 鼓 勵 -魔 術 社 社 長 耀 宗 、 小 倉 鼠 蕙 瑩、罩哥健宇、活潑可愛的謝女季庭及家齊、所花戴比、帥氣又專業的志豪 哥等人,以及昔日大學的同窗好友大白及 GB、展其、采資、郁涵、婉慈等 人,謝謝你們願意耐心聽我吐苦水及瘋言瘋語。左家學長姐的關心及鼓勵更 讓我窩心,能成為左家一分子十分開心及驕傲!尤其感謝逸芬學姊及佳貞在 我 迷 惘 時 給 我 指 點迷 津 。 此 外 , 感 謝 左家 學 弟妹 黃 斐 及 虹 芢 在 期 中期 末 報 告、口試報告與行政事務上的協助,辛苦你們了!以及桃園地政事務所的同 事們,感謝你們在我碩士倒數生涯時期的鼓勵與照顧,今後也請多多指教!. Ch. engchi. i n U. v. 最後,感謝父母之養育之恩,也謝謝你們總是支持我的決定 !現在我終 於要結束人生的求學階段,不期待有一帆風順的未來,只期望自己在職場上 能虛心學習,並不怕挫敗的繼續接受人生的挑戰 !. 淑苹. 謹致於桃園的家 2013 年 8 月. II.
(3) The Relationship between Housing Price and Low Fertility Rate. 摘要 台灣近年來面臨決定性的人口轉型,並邁入少子高齡化社會。根據台灣 內 政 部 戶 政 司 的 資 料 顯 示 , 台 灣 之 育 齡 婦 女 總 生 育 率 (Total Fertility Rate)於西元 2003 年起皆低於 1.3 人,成為超低生育率(the lowest-low fertility)之國家。因此,政府目前已將少子化現象視為國家安全問題,極 力鼓吹國民正視此議題,同時以生育補貼鼓勵國民生育。過去雖有文獻探討 少子化之成因,卻多僅以論述形式從人口及社會的角度切入,鮮少自經濟的 觀點來探討。然對於家庭的生育行為而言,經濟因素中生育成本的多寡應是 導致少子化的主要因素,且本研究認為,總體經濟因素中的高房價更可能占 了舉足輕重之角色。有鑑於此,本研究綜合社會及經濟的變數(房價指數、 女性勞動參與比率、失業率、家戶所得年增率、物價指數年增率)以模型實 證研究,運用共整合分析檢視影響少子化的因素,並以 Granger 因果關係檢 定了解各變數與生育率之領先落後關係。. 立. 政 治 大. ‧. ‧ 國. 學. 研究結果顯示生育率與房價及家戶所得年增率有共整合關係,亦即長期 而言有顯著關係。而根據 Granger 因果關係檢定,生育率領先於房價與女性 勞動參與率,但落後於失業率、女性勞動參與比率及消費者物價指數。本實 證 結果 可 提 供 為 政策 研 擬之 依 據 , 以 改善 生 育環 境 , 例 如 住宅 政 策上 的 調 整、稅負優惠、生育補貼等。未來期能提高台灣的生育率,進而調整人口結 構,以增加國家競爭力。. er. io. sit. y. Nat. al. n. 關鍵詞:少子化、房價、共整合、向量誤差修正模型、向量自我回歸模型、 Granger 因果關係. Ch. engchi. III. i n U. v.
(4) The Relationship between Housing Price and Low Fertility Rate. Abstract Taiwan has been facing demographic transition in recent years, and turned into an ageing society with fewer children. The total fertility rate (TFR) of Taiwan has been lower than 1.3 children since 2003. From then on, Taiwan has become the lowest-low fertility country. Taiwan’s government regards this situation as a national security issue, and attempts to encourage fertility behavior by subsidy. In order to improve it, the academic researchers have sparked off numerous studies to investigate the underlying reasons affecting the fertility decision. Most of them address this issue from demographic and sociological perspectives, yet few studies emphasize from the economic viewpoints. However, the opportunity cost of raising children might be the main factor leading to low fertility rate. This study therefore integrates sociological and economic factors which are housing price index, female labor force participant rate, unemployment rate, household income growth rate, and consumer price index growth rate to investigate the low fertility rate by Cointegration test. Furthermore, this study also employs Granger Causality test to realize the lead-lag relation among the variables.. 立. 政 治 大. ‧. ‧ 國. 學. y. Nat. sit. Results of this study present evidence that TFR is cointegrated with. n. al. er. io. housing price and household income growth rate, i.e., TFR moves together with these two variables over the long horizon. According to Granger Causality test, TFR Granger causes housing price and female labor force participant; while TFR is Granger caused by unemployment rate, female labor force participant, and consumer price index growth rate. The results may provide suggestions to the policy makers, and improve the environment for enhancing fertility, such as the adjustment of housing policy, tax reduction, and fertility subsidy. In the long run, we expect to reshape the population structure gradually and increase the country’s competitiveness.. Ch. engchi. i n U. v. Key words : Low fertility rate, Housing price, Cointegration, Vector Error Correction Model (VECM), Vector Autoregression (VAR), Granger Causality. IV.
(5) The Relationship between Housing Price and Low Fertility Rate. Context Chapter 1 1.1. Introduction ............................................................................................................ 9 General Background and Research Motivation .............................................................. 9. 1.1.1. General Background ................................................................................................... 9. 1.1.2. Research motivation ................................................................................................. 14. 1.1.3. Research Purpose ..................................................................................................... 15. 1.2. Research Method and Scope ........................................................................................ 17. 治 政 大 1.2.2 Research Scope ......................................................................................................... 17 立 1.3 Research Overview ....................................................................................................... 18 Research Method ..................................................................................................... 17. 1.3.1. Research Framework ................................................................................................ 18. 1.3.2. Research Process ...................................................................................................... 19. ‧ 國. ‧. Literature Review .......................................................................................... 20. Nat. y. Chapter 2. 學. 1.2.1. 2.2. Review of Low Fertility Rate Factors............................................................................. 22. 2.3. The Relationship Between Housing Price and Low Fertility Rate ................................. 24. n. al. er. sit. The Exploration of “The Lowest-low Fertility” .............................................................. 20. io. 2.1. Chapter 3 3.1. Ch. engchi. i n U. v. Research Method and Data Information ........................................................ 27 Research Method .......................................................................................................... 27. 3.1.1. Cointegration ............................................................................................................ 27. 3.1.2. Granger Causality Test .............................................................................................. 28. 3.2. Data Information........................................................................................................... 30. 3.2.1. Variable Selection ..................................................................................................... 30. 3.2.2. Data Source .............................................................................................................. 35. Chapter 4 4.1. Empirical Results ........................................................................................... 38 Structural Change ......................................................................................................... 38 5.
(6) The Relationship between Housing Price and Low Fertility Rate. 4.2. Unit-root Test................................................................................................................ 42. 4.3. Cointegration Test......................................................................................................... 43. 4.4. Vector Error Correction Model ..................................................................................... 50. 4.5. Vector Autoregressive Model ....................................................................................... 53. 4.6. Granger Causality Test .................................................................................................. 57. Chapter 5. Conclusions and Discussion ...................................................................... ……59. 5.1. Conclusions ................................................................................................................... 59. 5.2. Suggestions and Limitations ......................................................................................... 61. 政 治 大. References ………………………………………………………………………………………………………………………….62. 立. ‧. ‧ 國. 學. n. er. io. sit. y. Nat. al. Ch. engchi. 6. i n U. v.
(7) The Relationship between Housing Price and Low Fertility Rate. List of Figures Figure 1-1 The trend of fertility rate of the world ........................................ 10 Figure 1-2 The trend of TFR of Taiwan ....................................................... 11 Figure 1-3 Percentage of population by ages in Taiwan ............................... 12 Figure 1-4 1998Q1-2012Q2 The trend of housing price index of Taiwan ..... 15 Figure 3-1 1991Q1-2011Q1 The trend of Housing Price Index and TFR ...... 30 Figure 3-2 1991Q1-2011Q1 The trend of Female Labor Force Participant Rate. 政 治 大 1991Q1-2011Q1 立 The trend of Household Income Growth Rate and. and TFR ..................................................................................... 32 Figure 3-3. ‧ 國. 學. TFR ........................................................................................... 33 Figure 3-4 1991Q1-2011Q1 The trend of Unemployment Rate and TFR ...... 34. ‧. Figure 3-5 1998Q1-2011Q1 The trend of CPI Growth Rate and TFR ........... 35. sit. y. Nat. Figure 4-1 Result of CUSUM Test for TFR ................................................. 38. io. er. Figure 4-2 Result of CUSUM Test for HPI .................................................. 39. al. v i n C h for UR ................................................... Result of CUSUM Test 40 engchi U n. Figure 4-3 Result of CUSUM Test for LAB ................................................ 39 Figure 4-4 Figure 4-5. Result of CUSUM Test for HIR ................................................. 40. Figure 4-6 Result of CUSUM Test for CPI .................................................. 41 Figure 4-7 Number of households in Taiwan ............................................... 48 Figure 4-8 The amount of M2 ..................................................................... 48. 7.
(8) The Relationship between Housing Price and Low Fertility Rate. List of Tables Table 4-1 Results of Unit-root test .............................................................. 42 Table 4-2 The Optimal Lag Length .............................................................. 44 Table 4-3 Test statistics for the Cointegration between TFR and HPI ........... 45 Table 4-4 Test statistics for the Cointegration between TFR and HIR ........... 45 Table 4-5 Test statistics for the Cointegration between TFR and UR ............ 46 Table 4-6. 治 政 大 TFR and LAB .......... 46 Test statistics for the Cointegration between 立 ‧ 國. 學. Table 4-7 Normalized cointegrating coefficients of HPI ............................... 47 Table 4-8 VECM Analysis on TFR and HPI ................................................. 51. ‧. Table 4-9 VECM Analysis on TFR and HIR ................................................ 52. sit. y. Nat. io. n. al. er. Table 4-10 VAR Analysis on TFR and LAB ................................................. 54. i n U. v. Table 4-11 VAR Analysis on TFR and UR ................................................... 55. Ch. engchi. Table 4-12 VAR Analysis on TFR and CPI .................................................. 56 Table 4-13 Granger Causality Test Result of TFR and HPI ........................... 58 Table 4-14 Granger Causality Test Result of TFR and LAB ......................... 58 Table 4-15 Granger Causality Test Result of TFR and UR ............................ 58 Table 4-16 Granger Causality Test Result of TFR and HIR .......................... 58 Table 4-17 Granger Causality Test Result of TFR and CPI ........................... 58. 8.
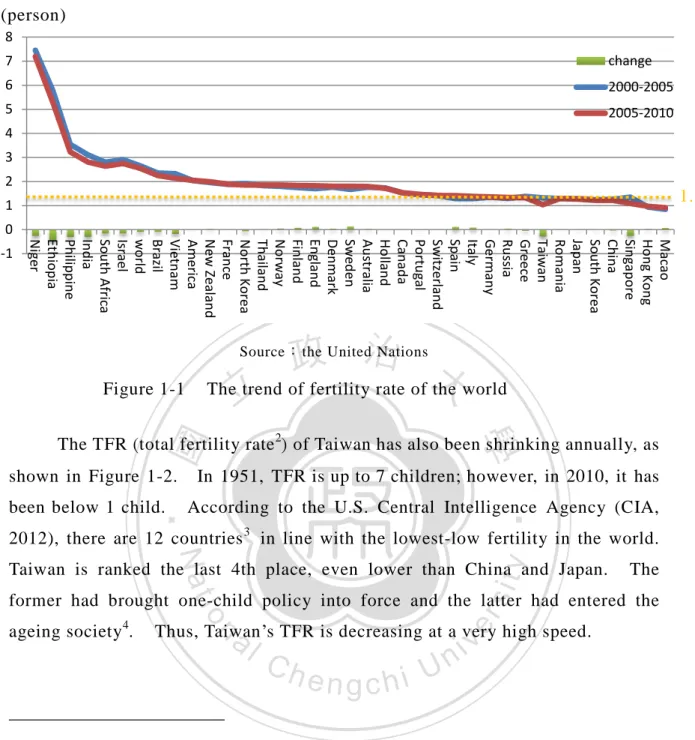
(9) The Relationship between Housing Price and Low Fertility Rate. Chapter 1 Introduction 1.1 General Background and Research Motivation 1.1.1 General Background Over the past decades, most of the countries around the world, whether industrialized or not, are experiencing crucial demographic issues.. One of the. most important of which is the rapidly declining population.. Notestein (1945). formulated the pattern as so-called “demographic transition”.. In the beginning,. 政 治 大. countries experience declining mortality and rising fertility rate, which increases population.. With some time lag, the reduction in mortality triggers the reducing. 立. of fertility rate, which lead to fewer population, contrarily.. Therefore, we. ‧. ‧ 國. population size.. 學. should get more concern about demographic transition due to the changes in world. Enduring declines in fertility have gradually become an alarming issue in According to the United Nations, the fertility rates among. sit. y. Nat. most of the world.. countries in recent 5 years are lower than the fertility rates from 2000 to 2005, as. io. Besides, the average fertility rate of the world has reduced. n. al. er. shown in Figure 1-1.. 6.7 percent since 2000.. i n U. v. In particular, the total fertility rate (TFR) of some. Ch. engchi. countries, such as South Korea, Singapore, Japan and Taiwan, are even lower than 1.3 children, becoming the lowest-low fertility 1 countries.. It seems that no. matter in Europe, North America or East Asia, the declining fertility rate phenomenon has become one of the trends of globalization.. 1 Which means the TFR is lower than 1.3 people. This phenomenon was sta rted from Europe in 1990, after then occurred in Asian. 9.
(10) The Relationship between Housing Price and Low Fertility Rate. (person) 8 7. change. 6. 2000-2005. 5. 2005-2010. 4 3 2. 1.3. 1 0 Macao Hong Kong Singapore China South Korea Japan Romania Taiwan Greece Russia Germany Italy Spain Switzerland Portugal Canada Holland Australia Sweden Denmark England Finland Norway Thailand North Korea France New Zealand America Vietnam Brazil world Israel South Africa India Philippine Ethiopia Niger. -1. 政 治 大 The trend of fertility rate of the world 立 Source:the United Nations. 學. ‧ 國. Figure 1-1. The TFR (total fertility rate 2) of Taiwan has also been shrinking annually, as shown in Figure 1-2.. According to the U.S. Central Intelligence Agency (CIA,. ‧. been below 1 child.. In 1951, TFR is up to 7 children; however, in 2010, it has. 2012), there are 12 countries 3 in line with the lowest-low fertility in the world.. y. Nat. sit. Taiwan is ranked the last 4th place, even lower than China and Japan.. The. er. al. v. Thus, Taiwan’s TFR is decreasing at a very high speed.. n. ageing society 4.. io. former had brought one-child policy into force and the latter had entered the. Ch. engchi. i n U. 2. According to Ministry of the Interior, total fertility rate is defined as the average number of children that would be born alive to 1,000 women during their lifetime if they were to pass their childbearing ages 15-49 year experiencing the age-specific fertility rate prevailing in that year. 3. Ranging from the highest to the lowest are Ukraine, Bosnia and Herzegovina, Montserrat, Belarus, Czech, Lithuania, South Korea, British Virgin Islands, Taiwan, Hong Kong, Macao, Singapore.. 4. The World Health Organization (WHO) defines ages over 65 as elderly people. When the proportion of the elderly population is up to 7%, defined as an Ageing Society; over 14%, defined as an Aged Society; as more than 20%, is defined as a Super Aged Society. According to Communications population statistics of Ministry of Internal Affairs of Japan, the proportion of elderly people was up to 23% in 2010. 10.
(11) The Relationship between Housing Price and Low Fertility Rate. (1000 people) 8,000 7,000 6,000 5,000 4,000 3,000 2,000 1,000 0. 政 治 大. 1947 1952 1957 1962 1967 1972 1977 1982 1987 1992 1997 2002 2007 2012. 立. Source:the Ministry of the Interior Department of Household Registration (update to June, 2013). ‧ 國. The trend of TFR of Taiwan. 學. Figure1-2. Due to social and economic changes, Taiwan is confronted with a. ‧. demographic transition these years.. The population structure of Taiwan has been According to. y. Nat. transformed into an ageing society with fewer children.. Sixty-five years later, it has increased to 10.89%, as. er. io. aged over 65 was 2.53%.. sit. Department of Household Registration, in 1947, the proportion of populations. al. n. v i n C h from 42.33% U aged from 0-14 years old has dropped e n g c h i to 15.08%, showing the trace of population recession. Obviously, the proportion of the elderly population has reported in Figure 1-3.. On the contrary, the proportion of juvenile population. risen increasingly, while the proportion of juvenile population has not been improved at all, which modifies the population structure of Taiwan.. As a result,. the situation of demography has turned to a new development, namely the low fertility rate.. 11.
(12) The Relationship between Housing Price and Low Fertility Rate. 100% 90% 80% 70% 60% Ages 0ver 64. 50%. Ages 15-64. 40%. Ages 0-14. 30% 20% 10%. 政 治 大. 1946 1949 1952 1955 1958 1961 1964 1967 1970 1973 1976 1979 1982 1985 1988 1991 1994 1997 2000 2003 2006 2009 2012. 0%. 立. Source:Department of Household Registration (update to June, 2013). ‧ 國. 學. Figure1-3. Percentage of population by ages in Taiwan. ‧. The effects of low fertility rate are very wide, as Hui et al. (2012) said, low. Nat. al. the aspects of demography, sociology, and government.. er. Overall, the influence of declining fertility rate can be seen from. io. fiscal burden.. Moreover, it could increase government’s. sit. potential consumers and labor force.. y. fertility rate could cause issues of rapid ageing, high dependency ratio, lacks of. First of all, in terms of. n. v decrease due to the i demographic perspective, the number of total population will n Ch i U the population xplosion. e nable g ctohimprove decline of young people. It might be. However, it will speed up population ageing as well, which means the ratio of elderly people will increase greatly in the future. ageing society since 1993.. In fact, Taiwan has entered. According to the estimating of Institute for. Information Industry (MIC), Taiwan's elderly population will be 16.2% in 2017 and officially entered the aged society.. Hence, we will see more and more. elderly people everywhere in Taiwan, just like Japan. As for sociological perspective, since the declining of fertility rate will speed up population ageing, sooner or later the current financial support for the elderly provided by the economically active will become insufficient, and the 12.
(13) The Relationship between Housing Price and Low Fertility Rate. sources could be shifted from reproduction to support for the elderly (Jovan, Daniel and Thomas, 2010).. In addition, fewer labors derived from low fertility. rate will result in the aggravation of dependency burden, long-term elderly care, and social insurance. problems.. This is to say low fertility rate may cause plenty of social. Furthermore, supposing that low fertility rate continues for a long. period of time, the social inertia and social self-reinforcing mechanism processes may make it fall into the so-called “low fertility trap” (Lutz and Skirebekk, 2005).. In other words, if this trend remains unchanged, the one-child nuclear. families and even DINK 5 will become the mainstream type of family in the future.. Combining with incremental non-marriage rate, low fertility rate will. 政 治 大. become an irreversible phenomenon.. 立. In terms of government, low fertility rate will not only lead to a reduction. ‧ 國. 學. of young adults, but cause a major threat to national competitiveness.. In the. future, this situation will reduce the national revenue and make government owe more bonds.. Therefore, Taiwan’s government regards this situation as a national. ‧. security issue, and attempts to encourage fertility behavior by subsidy.. Other than. sit. y. Nat. encouraging civil servants to increase the number of children, they also resort to. io. er. fertility policies to stabilize the decreasing speed of Taiwan's fertility rate.. al. v i n C hreasons affectingUthe fertility decision. Most studies to investigate the underlying engchi of them address this issue from demographic and sociological perspectives, such as n. In order to improve it, the academic researchers have sparked off numerous. female labor force participant rate, mortality rate, unemployment rate, yet few studies emphasize from the economic viewpoints.. However, the cost of. childbearing might be the main factor leading to low fertility rate.. In light of this. concern, this study demonstrates the relationship between low fertility rate and economic and sociological factors, especially focusing on housing price.. 5. The abbreviation of “ Double Income No Kid. ” 13.
(14) The Relationship between Housing Price and Low Fertility Rate. 1.1.2 Research motivation As mentioned above, it’s traditional to explore the mechanism of low fertility rate from demographic perspective; nevertheless, it cannot fully explain However, it is arguable that housing price may. large and rapid fertility declines.. play a key role in household childbearing behavior. What’s the connection between housing price and low fertility rate?. Hui,. Zheng and Jiang (2012) made the points that housing price can affect household fertility behavior in two ways.. First, if the housing price is too high to afford by. household, it will have a negative effect on couple formation and hence depress fertility behavior.. 政 治 大 mortgage payment. This. Second, even if couples own the houses, they may be greatly. 立. burdened by large bundles of. kind of cost may. home-owning couples to delay childbearing.. 學. ‧ 國. somehow compete with the cost of bearing and raising children, which leads new These statements indicate that. under limited budget resources available in each household, the homeownership. ‧. and childbearing decisions seem to compete and crowd out each other (Lo, 2012).. y. Nat. As a result, the motivation of this study is to figure out the connection between. er. io. sit. housing price and low fertility rate.. al. v i n soaring beginning from decadesC ago. Comparing to h e n g c h i Uthe previous Figure 1-3, yet Taiwan’s TFR diminished a lot. The high inflation of housing price will change n. Moreover, as seen in Figure 1-4 below, the housing price in Taiwan has been. household’s budget constraint and may naturally induce a demographic transition. Therefore, we suggest that housing price and low fertility rate should have equilibrium relationship in the long-run.. Additionally, taking the opportunity. cost of fertility behavior into account, housing price is likely to be associated with fertility decisions.. However, do low fertility rate cause falling housing price by. reducing demand fundamentals?. These are the targets what we aim to do later,. yet need to be examined by empirical results.. 14.
(15) The Relationship between Housing Price and Low Fertility Rate. (index) 180 160 140 120 100 80 60 40 20 1998Q1 1998Q3 1999Q1 1999Q3 2000Q1 2000Q3 2001Q1 2001Q3 2002Q1 2002Q3 2003Q1 2003Q3 2004Q1 2004Q3 2005Q1 2005Q3 2006Q1 2006Q3 2007Q1 2007Q3 2008Q1 2008Q3 2009Q1 2009Q3 2010Q1 2010Q3 2011Q1 2011Q3 2012Q1. 0. 政 治 大 1998Q1-2012Q2 The trend of housing price index of Taiwan 立 Source: Sinyi Realty. Figure1-4. ‧ 國. 學. Comparing to the growing practices and discussions of foreign academic literature, the amount of domestic researches exploring the relationship between Yet there are more and. ‧. low fertility rate and housing price are still insufficient.. more editorial discussing this kind of issue, showing that the problem has been. Nat. Hence, this paper sheds light on the. sit. y. getting more and more concern now.. io. with low fertility rate through the empirical results.. n. al. Ch. er. connection between housing price and other sociological and economic variables To sum up, the motivations. i n U. v. of this study are to fill the lacks of domestic literatures, and to provide. engchi. suggestions for fertility policy or housing policy for government. 1.1.3 Research Purpose Based on the motivations mentioned above, the goals of the study that we hope to achieve are as follows: (1) To explore the impact of fertility factors.. This study is expected to aggregate. sociological and economic points of views to explore the important variables of declining fertility rate, including housing price. investigate the factors affecting TFR first.. 15. In short, this study will.
(16) The Relationship between Housing Price and Low Fertility Rate. (2) To examine the existence of equilibrium relationships among these variables and TFR in the long-run by using cointegration analysis.. If they are. cointegrated, we can investigate the short-run dynamics by vector error correction model (VECM); otherwise, we can employ vector autoregression (VAR). (3) To find out the lead-lag relation between TFR and these variables by Granger Causality test.. 立. 政 治 大. ‧. ‧ 國. 學. n. er. io. sit. y. Nat. al. Ch. engchi. 16. i n U. v.
(17) The Relationship between Housing Price and Low Fertility Rate. 1.2. Research Method and Scope. 1.2.1 Research Method (1) Theory and Literature Review In the beginning, we investigate the literatures and the theories related to low fertility rate phenomena worldwide to understand the impact of the factors in fertility, and sort out the important variables for this study.. Then we reviewed. the relevant previous studies which researched the relationship between housing price and low fertility rate to select the appropriate research models and empirical. 政 治 大. methods which can be employed in this study.. 立. (2) Modeling an Empirical Analysis. ‧ 國. 學. This study examines the relationship between TFR and housing price in Taiwan by empirical modeling analysis.. After selecting the important variables. ‧. for this study from above literatures, we firstly employ cointegration test by using. y. sit. Secondly, we apply VECM or VAR to explore the short-run. io. dynamics between TFR and those variables.. n. al. Finally, we clarify the lead-lag. er. in the long run.. Nat. Eviews statistical software to understand which factors affect Taiwan’s fertility rate. i n U. v. relation between housing price and TFR by Granger Causality test. 1.2.2 Research Scope. Ch. engchi. (1) Research Objects In this study, we choose Sinyi Realty Housing Price Index and total fertility rate (TFR) as housing price and fertility rate.. As to the other sociological and. economic variables, we employ the data of Directorate-General of Budget, Accounting and Statistics (DGBAS) in Taiwan.. 17.
(18) The Relationship between Housing Price and Low Fertility Rate. (2) Time and Spatial Scope Although low fertility rate phenomenon has lasted for decades, the research period of housing price data that we can get is limited.. After overlapping the. time scope of the house price index and other variables, we select the period ranges from the first quarter of 1991 to the first quarter of 2011. spatial scope refers to the data of Taiwan.. Besides, the. In short, this study produces time. series from 1991 to 2011 of Taiwan.. 1.3. Research Overview. 政 治 大. 1.3.1 Research Framework. 立. This study consists of five chapters, as described as follows.. The first. ‧ 國. 學. chapter is "Introduction", which contains the main explanation of the general background, research motive and research purpose.. Besides, the research. ‧. method and scope as well as the research overview are introduced in this chapter. The second chapter is "Literature Review," which discusses the issues of the. y. Nat. al. The third chapter of this study is "Research. er. io. housing price and fertility rate.. sit. literatures, such as the factors influencing fertility and the relationship between. In this section, we present the research. n. Method and Data Information.". Ch. i n U. v. methodology, data information and definition of the variables.. engchi. The fourth. chapter is "Empirical Results," analyzing the results of the estimation models and exploring the practical meanings from the results. "Conclusions and Discussion.". The last chapter is. Based on the results, this chapter summarizes. the implications and explanations of this study comprehensively, and proposes some suggestions for fertility policies or housing policies.. 18.
(19) The Relationship between Housing Price and Low Fertility Rate. 1.3.2 Research Process. General Background and Research Motivation. Literature Review. 政 治 大 Fertility Rate 立Review of Low Factors. The Exploration of “the Lowest-low Fertility”. ‧. ‧ 國. 學 Research Method and. Nat. sit. y. Data Information. n. al. er. io. Cointegration. The Relationship between Housing Price and Low Fertility Rate. Ch. Empirical Results. engchi. VECM / VAR. Conclusions and Discussion. 19. i n U. v. Granger Causality test.
(20) The Relationship between Housing Price and Low Fertility Rate. Chapter 2 Literature Review The objective of this study is to investigate the relationship between housing price and low fertility rate.. Since most of the previous studies often tend to. discuss the overall trend or the demographic factors of fertility rate, yet few of them emphasize the relationship between house price and low fertility rate. Especially, this type of research is relatively rare in Taiwan.. Therefore, we will. focus on the theory of low fertility rate first, then move to the previous studies discussed the relationship between housing price and low fertility rate. part describes the "the 政 治 First 大 lowest-low fertility" theory,立 and the second part discusses the factors affecting This chapter is divided into three parts.. fertility behavior by reviewing the past studies.. Lastly, we conclude with. ‧ 國. 學. discussions of the relationship between housing price and low fertility rate.. The Exploration of “The Lowest-low Fertility”. ‧. 2.1. y. Nat. al. According to Kohler et al (2002), the lowest-low. n. fertility phenomenon began in Europe in the 1990s. and Spain in 1993. countries.. Ch. er. io. to or less than 1.3 children.. sit. In standard definition, the lowest-low fertility means that the TFR is equal. It occurred earliest in Italy. i n U. v. Since then, they maintained "the lowest-low fertility". engchi. In the late 1990s, the TFR of 14 countries of central, eastern and. southern Europe are also lower than 1.3 children. phenomenon began to spread to Asia.. Not much longer, the. For example, Taiwan has become one of. the "the lowest-low fertility" countries since 2003. However, Goldstein et al (2009) pointed out that in recent years, the countries widely known as the lowest-low fertility countries in Europe and East Asia have reduced from 21 in 2003 to 5 in 2008.. Moreover, the upturn in the. TFR was not confined to lowest-fertility countries, but affected the whole developed world.. They admit that economic downturn may restrain TFR in the. short run, but the fertility rates of the lowest-low fertility countries will continue 20.
(21) The Relationship between Housing Price and Low Fertility Rate. to increase. ended.. Hence, they argued that the era of lowest-low fertility in Europe has. As for East Asia, the TFR of Japan has risen above the 1.3 threshold.. However, in Hong Kong, South Korea, and Taiwan, the TFR still recorded below 1.2 children in 2008, Taiwan’s TFR is particularly still falling and reaching a level of 1.05.. In conclusion, the fertility rate in Europe has risen recently, while low. fertility rate phenomenon still continues in Asia now. Some scholars forewarn the Low-fertility trap from the demographic doctrinal warning.. Lutz and Skirbekk (2005) pointed out that once fertility rate. has been very low for a period of time, social inertia and self-reinforcing processes may make it difficult to return to higher levels, creating “low-fertility trap.”. 政 治 大. Moreover, long-term low fertility may also cause the irreversibility to. replacement level.. 立. According to the department of Research, Development and. ‧ 國. 學. Evaluation Commission (R.D.E.C.) at Executive Yuan, the long-term low fertility will bring about inertial effects and married unwillingness among young population, further leading to the increase of childbearing costs.. The result of. ‧. the vicious cycle is the continuous decline of fertility rate.. In order to avoid the. sit. y. Nat. cyclical result, the-lowest-low-fertility countries are all trying to come up with some countermeasures, hoping to mitigate the impact of reduction in fertility by. io. For instance, the rebound phenomenon of European fertility in recent. er. policies.. n. al. i n U. v. years is considered to be associated with the government's fertility policy.. Ch short, to keep away from the low-fertility e n gtrap, c h icountries. which are facing low. fertility problem now all attempt in policy making for increasing fertility rate.. 21. In.
(22) The Relationship between Housing Price and Low Fertility Rate. 2.2 Review of Low Fertility Rate Factors The spread and impact of the declining fertility rate have instigated quantities of researches and discussions, most of them investigated the mechanism and the underlying reasons.. For example, Freedman (1995) pointed out that. there are three necessary explanatory variables discussing the influence of fertility behavior, which are mortality decline, broad social and economic development, and family planning programs.. The most popular point of view is to explore the. links between demographic factors and fertility, especially the relationship between increase of life expectancy and decline of fertility.. Yakita (2001) found. that the increase of life expectancy often lead to decreasing fertility rate and. 政 治 大 decline has a strong positive 立relationship with the reduction in fertility, while. increasing life-cycle saving.. Murphy et al (2008) declared that the mortality. ‧ 國. relationship with fertility. in different countries.. 學. rising labor force participant rate levels of parents have a strong negative In addition, some scholars studied empirical results. They discovered that a decline in the infant mortality rate. ‧. will also promote lower fertility (Hondroyiannis and Papapetrou, 2002; Narayan,. sit. y. Nat. 2006; Murphy et al, 2008).. n. al. er. io. As for sociological factors, previous studies tend to focus on the impact of. v ni. fertility on female education and female labor force participation rate.. Ch. engchi U. Narayan. (2006) used ARDL empirical analysis and found that female education and female labor force participation rate are the key determinants of fertility behavior in Taiwan in the long run.. McNown and Rajbhandary (2003) employed the data of. 1948-1997 in the United States by cointegration analysis and found that the TFR and the female labor force participation rate, female wages, and the standard of female education have cointegration relationships.. Taking the opportunity costs. of raising children into account, the fertility of women who have the ability to work are lower than the fertility of women without the ability to work. Nevertheless, life expectancy, mortality, female education, and female labor force participation rate can only reflect the demographic and social point of views. The neglect of economic factors in current studies may not fully explain the. 22.
(23) The Relationship between Housing Price and Low Fertility Rate. phenomenon of low fertility rate but lead to estimation bias. From the economic viewpoint, there is a crucial linkage between economic growth and fertility behavior, but the directions of impact may be in opposite ways.. On one hand, some studies provide empirical evidence that gross. domestic product and household income have significantly negative relationships with fertility rate (Bar and Leukhina, 2010; Schultz, 2001, 2007; Wigniolle, 2002).. In general, the higher the economic development, the lower is the. fertility rates.. Hui et al (2012) indicated that in industrial countries, most. parents transfer wealth to their children (e.g. heritage, labor force participant rate); however, in developing countries, children offer assistance to their parents, like young human resources.. 立. 政 治 大. On the other hand, other scholars assert that the. overall economic growth will improve fertility.. Hondroyiannis and Papapetrou. ‧ 國. 學. (2002) employed data in Greece in 1960-1996, and the empirical results show that real GDP per capita is positively correlated with fertility rate.. ‧. Other than economic growth, some scholars point out that household. y. Nat. income and unemployment rate are also significantly correlated with fertility rate.. n. al. However, other scholars. er. io. household income should improve fertility decision.. Hence, increase in. sit. In theory, children are not inferior goods but normal goods.. iv n current U income. claim that household income is negatively correlated with fertility rate.. Ch. engchi. Hondroyiannis (2010) asserts that not only the. but also the. expected income in the future would affect fertility rate; therefore, any uncertainty in labor market could prevent household from childbearing. Similarly, Hondroyiannis and Papapetrou (2002) find that real income and fertility rate have negative association as well.. As for unemployment rate, a number of. researchers state that increase in unemployment rate may cause declining fertility rate (Huang, Kao and Hung, 2006; Hondroyiannis, 2010).. In summary, economic. viewpoint provides a more comprehensive thinking in discussing low fertility rate.. 23.
(24) The Relationship between Housing Price and Low Fertility Rate. 2.3 The Relationship Between Housing Price and Low Fertility Rate Overall, the demographic transition cannot fully explain the changes in fertility; hence, many scholars have spotlighted on the variations in the real estate market (e.g. residential policies or real estate price levels).. This could be a. crucial aspect to examine the phenomenon of low fertility rate in recent years (Krishnan and Krotki, 1993; Mulder, 2006; Mulder and Billari, 2010; Yi and Zhang, 2010). Previous studies tend to reveal the influence of demographic change on the. 政 治 大 population decline and population ageing on house price in Scotland and England 立 by difference-in-differences methodology. The analysis of their result suggests. For example, Levin et al. (2009) explore the effect of. 學. ‧ 國. housing market.. that population decline and population ageing put downward pressure on prices; thus, they assume that the long-run trend of rising house price cannot continue. ‧. into the future, particularly in Scotland.. In fact, there are many factors affecting. the housing price, covering national policy, national income, economic growth,. y. Nat. In order to avoid external factors interfering the influence of study,. sit. taxes, etc.. er. io. Malmberg (2010) used the Swedish panel data to make it possible controlling the. al. v i n time effects. The results showCthat population ageing h e n g c h i U could lead to less rapid house price growth in the first decade of the twenty first century, compared to the n. effect of national-level policy shifts and macroeconomic events through the fixed. last decade of the twentieth century.. In brief, the change of demography. structure may impact on housing market. In addition, a large body of research argued that housing market conditions (e.g., low homeownership rate) will bring about the postponement of family formation and fertility choice (Krishnan Krotki, 1993; Mulder, 2006; Mulder and Billari, 2010).. Murphy et al (2008) found that population density has a negative. impact on fertility.. Mulder and Billari (2010) investigated the association. between fertility and the organization of homeownership in Western countries. They point out that one “difficult” homeownership regime is particularly 24.
(25) The Relationship between Housing Price and Low Fertility Rate. associated with problematic housing-market entry and combined a high share of owner-occupation and low access to mortgages. phenomenon of low fertility in Europe.. Kohler et al (2002) explored the. One of the reasons of its development is. the availability of housing, especially in Italy and Spain.. The results of. Giannelli and Monfardini (2003) support the hypothesis that increase in the cost of housing relative to other consumer prices has continued to delay family formation. (ARDL). Hui et al (2012) employed the Autoregressive Distributed Lag and. Granger. causality models. to. disentangle. the. complicated. relationships between birth rate, housing price and elderly dependency in long-run and short-run.. The empirical results show that 1% increase in housing prices. In 治 政 addition, both housing price and elderly dependency大 Granger cause birth rate in 立room as a proxy of the price of living space, Simon the long-run. Using rent per and elderly leads to 0.52% and 1.65% decreases in birth rate respectively.. ‧ 國. 學. et al (2009) used U.S. census data from 1940 to 2000 to investigate the negative relationship between fertility and rent.. The price of living space turns out to. ‧. have a significant negative correlation to household fertility decisions.. In. summary, whether measured by housing price or rent, the price of living space is. io. sit. y. Nat. negatively correlated to fertility rate from the results of previous studies.. n. al. rate and the demand for land.. er. Domestic researches mostly explore the relationship between low fertility. i n U. v. For example, Lien and Huang (2009) analyze the. Ch. engchi. influence of population structure transition to land use demands, including schools, medical sites, and residential land by means of the tendency of population transition in Taiwan.. The results show that TFR is negatively related. to the average living space per household. However, no research in Taiwan directly investigates the declining fertility rates and house price so far. Recently, some researchers began to test the association between homeownership rate and low fertility rate.. Lo (2012) constructed the regional panel data. including 23 cities in Taiwan from 1994 to 2007 to investigate how homeownership rate affects fertility rate.. Their empirical results show that the. private homeownership rate has a negative relation with the fertility rate. Similarly, Peng and Tsai (2012) revealed that fertility rates have a long-term. 25.
(26) The Relationship between Housing Price and Low Fertility Rate. equilibrium relationship with homeownership rates, household income, proportion of married couples, and percentage of higher educated females.. By reviewing. the domestic research, to our knowledge, seldom studies examine the relationship between housing price and low fertility rate directly. In conclusion, the academic researchers have sparked off numerous studies to investigate the underlying reasons affecting the fertility decision.. Most of them. address this issue from demographic and sociological perspectives, yet few studies emphasize from the economic viewpoints.. However, the opportunity cost of. raising children might be the main factor leading to low fertility rate.. This study. therefore integrates sociological and economic factors which are housing price,. 政 治 大. female labor force participant rate, unemployment rate, household income growth. 立. rate, and consumer price index to investigate the low fertility rate.. Moreover,. ‧ 國. 學. housing price could be the most expensive one of the opportunity costs; consequently, this paper focuses on the relationship between housing price and low fertility rate especially.. ‧. n. er. io. sit. y. Nat. al. Ch. engchi. 26. i n U. v.
(27) The Relationship between Housing Price and Low Fertility Rate. Chapter 3 Research Method and Data Information 3.1 Research Method The purposes of this study are to explore the impact of fertility factors and the lead-lag relations between TFR and other variables by empirical results. For the former section, we use Johansen cointegration method to analyze TFR and other variables respectively. As for the latter section, granger causality test is employed to figure out the lead-lag relations. 3.1.1 Cointegration. 立. 政 治 大. Engle and Granger firstly proposed Cointegration test in 1987 to analyze Since most economic time series are non-stationary, the. ‧ 國. 學. economic variables.. results which estimate the series directly would cause the problem of spurious The common solution is to take time difference so that the series. ‧. regression.. would be stationary; meanwhile, it may lose the accuracy messages of the data.. Nat. If a set of series are. sit. y. Thus, another solution is to conduct cointegration.. io. er. individually integrated but some linear combination of them have different order of integration, then the series are called cointegrated, which also means there. n. al. Ch. i n U. v. exists a long-run equilibrium relationship among the variables.. engchi. A common. example is where the individual series are first-order integrated (I(1)) but some vector of coefficients exist to form a stationary linear combination of them. The main time series variables of this study are housing price (HPIt ) and fertility rate (TFR t ).. The regression can be written as follows.. TFR t = c0 + a1 HPIt + εt. (1). In this equation, c0 and a1 represent the coefficient; TFR t represents total fertility rate; HPIt represents housing price index; εt represents the error term. If εt is stationary, housing price and fertility rate are thus cointegrated.. 27.
(28) The Relationship between Housing Price and Low Fertility Rate. Therefore, we should test whether the residual series have a unit root or not. The equation can be expressed as: ∆εt = ρεt−1 + ∑ki=1 δi ∆εt−i + vt. (2). In this equation, ρ and δi represent the estimated parameter; vt represents estimated error term; i represents the lag term.. The null hypothesis of the. equation is that there is no relationship between the two variables.. If the result. cannot reject the null hypothesis (ρ = 0), then there is no cointegration between housing price and fertility rate.. 政 治 大 Juselius addressed maximum likelihood estimation in 1990. 立. After Engle and Granger proposed two–step method in 1987, Johansen and In general, Engle. and Granger (1987) can effectively avoid spurious regression.. But the results. ‧ 國. 學. could be influenced in some specific situations, such as small amount of samples. Contrarily, the Johansen cointegration approach provides a more flexible and. ‧. robust way to interpret the equilibrium relationship between variables.. y. Nat. er. io. sit. 3.1.2 Granger Causality Test. We aim at the relationship between housing price and low fertility rate, especially the lead-lag relations. From the past studies, the relationship between housing price and fertility rate could not be one-way, but is instead two-way. Thus, this study conducts Granger causality test to investigate the causalities both of TFR on housing price and of housing price on TFR. By causality, we mean the existence of lead-lag relations between housing price and TFR, which also means the ability of one variable to predict another. The definition of Granger causality is that there exists two variables, X t and Yt , Xt = bij Yt−k and Yt = aij Xt−k . When past value of Xt can be explained by current and past values of. n. al. Ch. engchi. Yt , Xt is said to be Granger-caused by Yt . prediction of Xt .. i n U. In other words, Yt helps in the. The hypothesis is expressed as:. H0 :aij = bij = 0, represents there’s no causality. H1 :aij ≠ 0 or bij ≠ 0, represents there exists causality. 28. v.
(29) The Relationship between Housing Price and Low Fertility Rate. The Granger causality equation of this study is written as follows.. In this. equation, k means lag terms. ε1t and ε2t are independent to each other. TFR t = αi + ∑ki=1 α1i TFR t−i + ∑ki=1 α2i HPIt−i + ε1t. (3). HPIt = βi + ∑ki=1 β1i HPIt−i + ∑ki=1 β2i TFR t−i + ε2t. (4). Granger causality must be employed on the base of stationary variables. Therefore, we need to take time difference for non-stationary series first, then conduct Granger causality test. 3.1.3 Process of Research Method. 政 治 大. 立Structural Change. ‧ 國. 學 y. ‧. Nat. io. sit. Non-stationary series. n. al. er. Stationary series. Unit-root Test. Ch. NO. engchi. i n U. v. Cointegration. YES. VAR VECM. Granger Causality. 29.
(30) The Relationship between Housing Price and Low Fertility Rate. 3.2. Data Information. 3.2.1 Variable Selection (1) Housing Price When households make fertility decisions, the opportunity costs of fertility are often taken into account.. Those may widely cover from housing price,. household income, government subsidy to tuition fee. price could be the most expensive shade price.. In particular, housing. Especially in recent years, the. housing price has risen sharply, shown in Figure 3-1.. In the same period, the. It 治 政 大 from fertility behavior seems like rising housing price would deter household 立anticipates that housing price may be negatively somehow. Hence, this study decline of fertility has been more rapid and pervasive than was expected.. y. sit. n. al. er. io. Ch. engchi. i n U. v. (index) 250.0000 200.0000 150.0000 100.0000 50.0000 0.0000. 1991Q1 1992Q1 1993Q1 1994Q1 1995Q1 1996Q1 1997Q1 1998Q1 1999Q1 2000Q1 2001Q1 2002Q1 2003Q1 2004Q1 2005Q1 2006Q1 2007Q1 2008Q1 2009Q1 2010Q1 2011Q1. 2.0000 1.8000 1.6000 1.4000 1.2000 1.0000 0.8000 0.6000 0.4000 0.2000 0.0000. Nat. (person). ‧. ‧ 國. 學. correlated with fertility rate.. TFR. Housing Price Index. Source: Sinyi Realty (Housing Price Index) and the Ministry of the Interior Department of Household Registration (TFR). Figure3-1. 1991Q1-2011Q1 The trend of Housing Price Index and TFR 30.
(31) The Relationship between Housing Price and Low Fertility Rate. Other than housing price, other essential variables are also analyzed in this study.. Since many demographic variables will influence each other, we decide. not to take demographic variables into consideration.. For example, the. population of elderly people or the nuptiality rate will influence fertility rate. Therefore, this study aims at the impact of social variables and economic variables on fertility rate. (2) Social Variables The social variables of this study contain female labor force participant rate and household income growth rate.. Higher female education will postpone the. 政 治 大 This is 立 to say that female education and female labor force. timing of female childbearing; and further, it will enhance the female labor force participation rate.. ‧ 國. both.. 學. participation rate will affect each other, so we choose one of them rather than After collecting those two data, we decide to research female labor force. participant rate because the research period of female education is limited.. ‧. Most of the industrialized countries have witnessed an increase in female. y. Nat. sit. labor force participant rate with a simultaneous decrease in fertility.. Same as. er. io. mentioned in chapter 2, the ability to work will increase the opportunity cost of. al. v i n of declining number of children. C hBesides, as seenUin Figure 3-2, the trend of e significantly g c h i negative with fertility rate. female labor force participant rate is n n. the fertility decision-making, so women who have jobs are likely to be the cause. As a result, this study expects that the increase of female labor force participant rate will reduce the fertility rate.. 31.
(32) The Relationship between Housing Price and Low Fertility Rate. (%). 2.0000 1.8000 1.6000 1.4000 1.2000 1.0000 0.8000 0.6000 0.4000 0.2000 0.0000. 51.0000 50.0000 49.0000 48.0000 47.0000 46.0000 45.0000 44.0000 43.0000 42.0000 41.0000 1991Q1 1992Q1 1993Q1 1994Q1 1995Q1 1996Q1 1997Q1 1998Q1 1999Q1 2000Q1 2001Q1 2002Q1 2003Q1 2004Q1 2005Q1 2006Q1 2007Q1 2008Q1 2009Q1 2010Q1 2011Q1. (person). TFR. 政 治 大. Female Labor Force Participant Rate. 立. Source: DGBAS (Female Labor Force Participant Rate) and. ‧ 國. Figure3-2. 學. the Ministry of the Interior Department of Household Registration. (TFR). 1991Q1-2011Q1 The trend of Female Labor Force Participant Rate and TFR. ‧. In addition, the increase in household income may also reduce fertility rate Yet it may contrarily increase fertility rate due. y. Nat. by expanding opportunity cost.. sit. to the increasing income, household can thus afford costs of childbearing.. er. io. Especially, the more wealthy people will choose to increase fertility in order to. n. a l As we can see in Figure i3-3, v there’s no obvious n connection between income and C fertility. this study considers the h e n gConsequently, chi U inherit the family business.. increase of income may affect fertility rate at both positive and negative signs.. 32.
(33) The Relationship between Housing Price and Low Fertility Rate. (%). 2.0000 1.8000 1.6000 1.4000 1.2000 1.0000 0.8000 0.6000 0.4000 0.2000 0.0000. 0.1600 0.1400 0.1200 0.1000 0.0800 0.0600 0.0400 0.0200 0.0000 -0.0200 -0.0400 1991Q1 1992Q1 1993Q1 1994Q1 1995Q1 1996Q1 1997Q1 1998Q1 1999Q1 2000Q1 2001Q1 2002Q1 2003Q1 2004Q1 2005Q1 2006Q1 2007Q1 2008Q1 2009Q1 2010Q1 2011Q1. (person). TFR. 立. 政 治 大. Household Income Growth Rate. Source: National Statistics (Household Income Growth Rate) and the Ministry of the Interior Department of Household Registration. ‧ 國. 學. Figure3-3. (TFR). 1991Q1-2011Q1 The trend of Household Income Growth Rate and TFR. ‧. (3) Economic Variables. sit. y. Nat. In terms of economic variables, this study investigates the impact of unemployment rate and the consumer price index growth rate on fertility rate.. io. n. al. er. First of all, high unemployment rate is often accompanied by the overall economic. i n U. v. downturn, thus households will choose to work more and postpone or stop childbearing.. Ch. engchi. So the unemployment rate is expected to have negative. relationship with fertility rate.. In Figure 3-4, it seems like the unemployment. rate is weakly negatively related to fertility rate.. 33.
(34) The Relationship between Housing Price and Low Fertility Rate. (person). (%). 2.0000 1.8000 1.6000 1.4000 1.2000 1.0000 0.8000 0.6000 0.4000 0.2000 0.0000. 7.0000 6.0000 5.0000 4.0000 3.0000 2.0000 1.0000 1991Q1 1992Q1 1993Q1 1994Q1 1995Q1 1996Q1 1997Q1 1998Q1 1999Q1 2000Q1 2001Q1 2002Q1 2003Q1 2004Q1 2005Q1 2006Q1 2007Q1 2008Q1 2009Q1 2010Q1 2011Q1. 0.0000. TFR. 立. 政 治 大 Unemployment Rate. Source: DGBAS (Unemployment Rate) and. ‧ 國. 學. the Ministry of the Interior Department of Household Registration. Figure3-4. (TFR). 1991Q1-2011Q1 The trend of Unemployment Rate and TFR. ‧. Lastly, related literatures rarely discuss the relationship between fertility. sit. y. Nat. and consumer price index, perhaps because it could be interfered by other economic elements easily.. Therefore, this study adopts the growth rate of. io. n. al. er. household income as proxy of income, in order to eliminate the interference of consumer price.. i n U. v. After adjusting the variable, we decide to explore the impact of. Ch. consumer price on fertility behavior.. Shown en g c hin iFigure 3-5, the consumer price. index appears to have no connection with fertility rate.. Nonetheless, taking. opportunity cost into consideration; we presume that increases of consumer price would lead to decreases in fertility rate.. 34.
(35) The Relationship between Housing Price and Low Fertility Rate. (person). (%). 2.0000 1.8000 1.6000 1.4000 1.2000 1.0000 0.8000 0.6000 0.4000 0.2000 0.0000. 7.0000 6.0000 5.0000 4.0000 3.0000 2.0000 1.0000 0.0000 -1.0000 1991Q1 1992Q1 1993Q1 1994Q1 1995Q1 1996Q1 1997Q1 1998Q1 1999Q1 2000Q1 2001Q1 2002Q1 2003Q1 2004Q1 2005Q1 2006Q1 2007Q1 2008Q1 2009Q1 2010Q1 2011Q1. -2.0000. 立. TFR. 政 治 大 CPI Growth Rate. Source: DGBAS (CPI Growth Rate) and. ‧ 國. Figure3-5. 學. the Ministry of the Interior Department of Household Registration. (TFR). 1998Q1-2011Q1 The trend of CPI Growth Rate and TFR. ‧. n. er. io. sit. y. Nat. al. 3.2.2 Data Source. Ch. engchi. i n U. v. This study employed the data in Taiwan from the first quarter of 1991 to the first quarter of 2011, 486 samples in total.. The descriptions and sources of each. variable are as shown in Table 3-1 below.. In fact, we faced a number of data. limitations.. Although low fertility rate phenomenon traced decades ago, the. housing price data are not transparent in Taiwan now.. As a result, we can only. conduct the research through the limited data mentioned above.. 35.
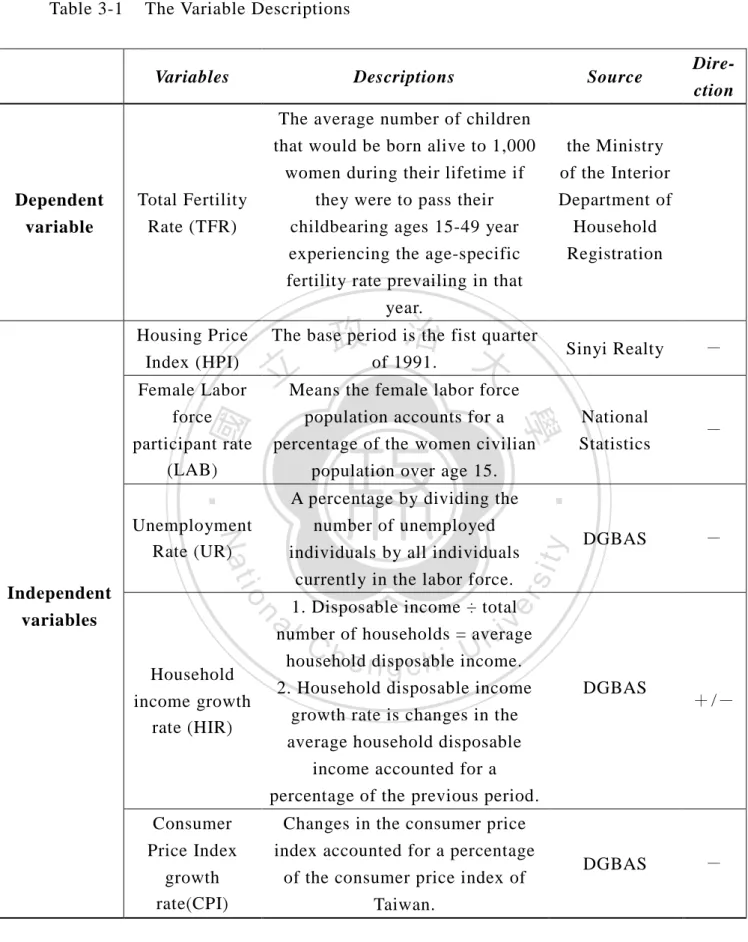
(36) The Relationship between Housing Price and Low Fertility Rate. Table 3-1. The Variable Descriptions. Variables. Dependent variable. Total Fertility Rate (TFR). Descriptions. Source. The average number of children that would be born alive to 1,000 women during their lifetime if they were to pass their childbearing ages 15-49 year experiencing the age-specific fertility rate prevailing in that. the Ministry of the Interior Department of Household Registration. Direction. year.. 政 治 大. The base period is the fist quarter of 1991.. 立Means the female labor force. -. DGBAS. -. sit. y. ‧ 國. io. currently in the labor force.. ‧. A percentage by dividing the number of unemployed individuals by all individuals. Nat. 1. Disposable income ÷ total anumber iv l C of households = average n U h e ndisposable household g c h i income.. n Household income growth rate (HIR). National Statistics. population accounts for a percentage of the women civilian population over age 15.. Unemployment Rate (UR) Independent variables. -. 學. Female Labor force participant rate (LAB). Sinyi Realty. er. Housing Price Index (HPI). 2. Household disposable income growth rate is changes in the average household disposable income accounted for a percentage of the previous period.. Consumer Price Index. Changes in the consumer price index accounted for a percentage. growth rate(CPI). of the consumer price index of Taiwan.. 36. DGBAS. DGBAS. +/-. -.
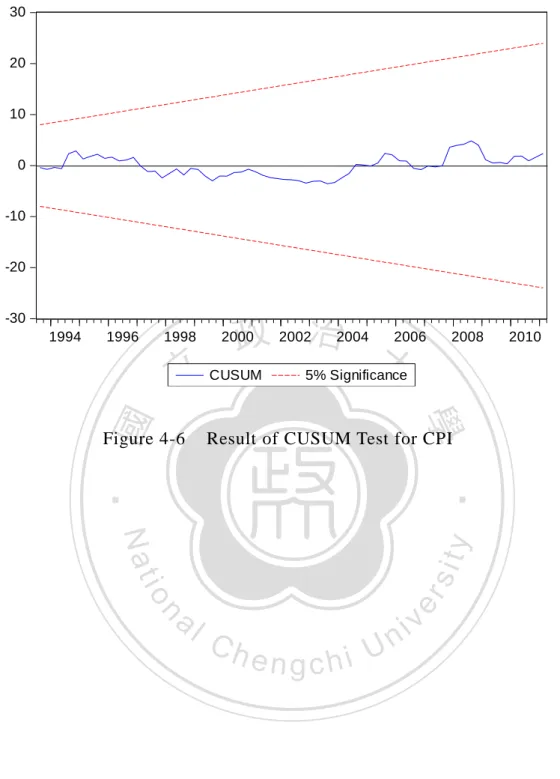
(37) The Relationship between Housing Price and Low Fertility Rate. 3.3. Data Analysis Before estimating models, we should understand the characteristics and. dispersion of the data. Table 3-2.. The descriptive statistics of variables are reported in. From the first quarter of our research period, Taiwan’s TFR remains. below replacement level, which shows that how serious of our low fertility rate problem.. In the same period, housing price has risen a lot in recent 20 years.. Moreover, the maximum of housing price are nearly eight times greater than the We can thus realize the astonishing growing speed of housing price. in Taiwan.. 政 治 大. 學. Descriptive Statistics of Variables LAB. UR. Mean Median Maximum. 1.406207 1.400000 1.775000. 126.0100 117.4567 215.9436. 46.89914 46.24000 49.72000. 3.417411 3.656700 6.080000. Minimum Std. Dev.. 0.895000 0.300958. 96.39290 27.15425. 44.32000 1.758118. 1.296700 1.404595. io. n. al. Ch. engchi. 37. HIR. CPI. 0.026022 0.012200 0.137900. 1.767786 1.516700 5.963300. -0.028500 -1.343300 0.040345 1.746667. er. HPI. ‧. TFR. Nat. Variables. y. Table3-2. ‧ 國. 立. sit. average one.. i n U. v.
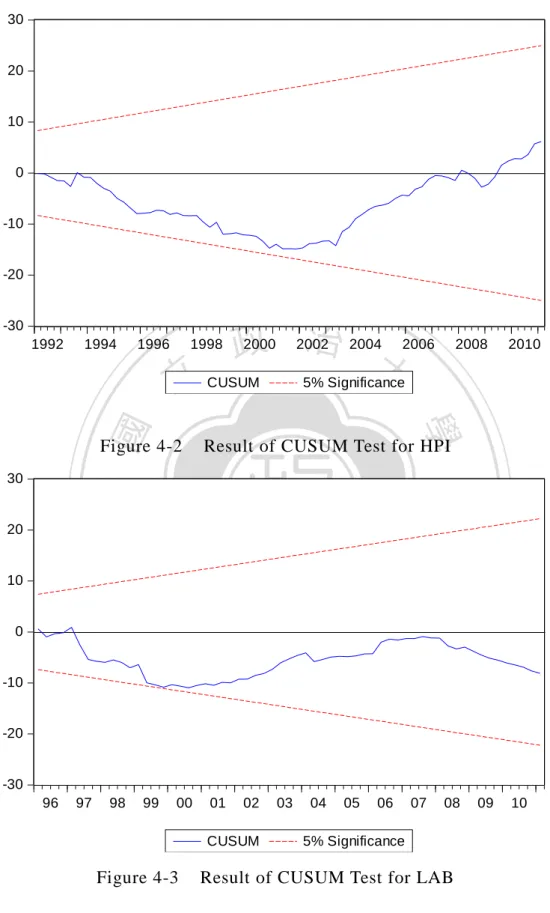
(38) The Relationship between Housing Price and Low Fertility Rate. Chapter 4 Empirical Results 4.1 Structural Change Before performing unit root test, we should confirm whether there is any structural change during the studying period or not.. Since time series data are. employed in this study, there could be some disturbing shocks during the research period, such as wars, revolutions, policies, or economic development.. If there is. a structural change in the period, the result of the unit root test would be biased. In order to avoid the deviated estimation, we apply the Cumulative Sum. 政 治 大. (CUSUM) of the recursive residuals test in this study.. 立. As we can see from Figure 4-1 to Figure 4-6, each variables do not exceed. ‧ 國. 學. the critical value at the 5% significance level (dashed line).. In other words,. there is no structural change among these variables during the studying period.. ‧. Hence, the time series data are useable for the following test, which means the results are authentic.. n. al. er. io. sit. y. Nat. 30. 20. 10. Ch. engchi. i n U. v. 0. -10. -20. -30 96. 97. 98. 99. 00. 01. 02. 03. CUSUM. Figure 4-1. 04. 05. 06. 07. 08. 5% Significance. Result of CUSUM Test for TFR. 38. 09. 10.
(39) The Relationship between Housing Price and Low Fertility Rate 30. 20. 10. 0. -10. -20. -30 1992. 1994. 1996. 1998. Figure 4-2. 30. 2002. CUSUM. 2004. 2006. Result of CUSUM Test for HPI. y. sit. n. al. er. io. 0. 2010. 5% Significance. Nat. 10. 2008. ‧. 20. 2000. 學. ‧ 國. 立. 政 治 大. Ch. -10. engchi. i n U. v. 06. 07. -20. -30 96. 97. 98. 99. 00. 01. 02. 03. CUSUM. Figure 4-3. 04. 05. 08. 5% Significance. Result of CUSUM Test for LAB. 39. 09. 10.
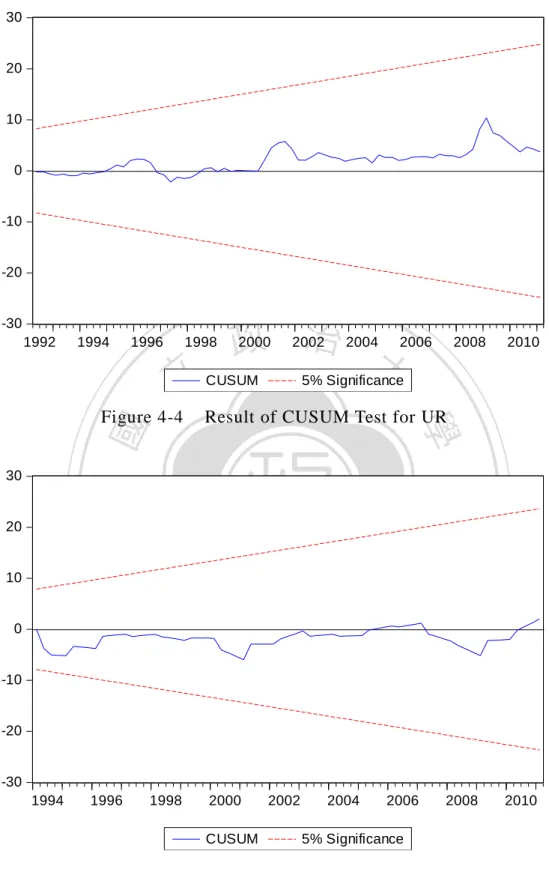
(40) The Relationship between Housing Price and Low Fertility Rate 30. 20. 10. 0. -10. -20. -30 1992. 1994. 1996. 1998. 立. 20. 2002. CUSUM. 2004. 2006. Result of CUSUM Test for UR. y. sit. n. al. er. io. 0. 2010. 5% Significance. Nat. 10. 2008. ‧. ‧ 國. 30. 2000. 學. Figure 4-4. 政 治 大. Ch. -10. engchi. i n U. v. -20. -30 1994. 1996. 1998. 2000. 2002. CUSUM. Figure 4-5. 2004. 2006. 2008. 5% Significance. Result of CUSUM Test for HIR. 40. 2010.
(41) The Relationship between Housing Price and Low Fertility Rate 30. 20. 10. 0. -10. -20. -30 1996. 1998. 立 Figure 4-6. 政 治 大. 2000. 2002. CUSUM. 2004. 2006. 2008. 5% Significance. 學. ‧ 國. Result of CUSUM Test for CPI. ‧. io. sit. y. Nat. n. al. er. 1994. Ch. engchi. 41. i n U. v. 2010.
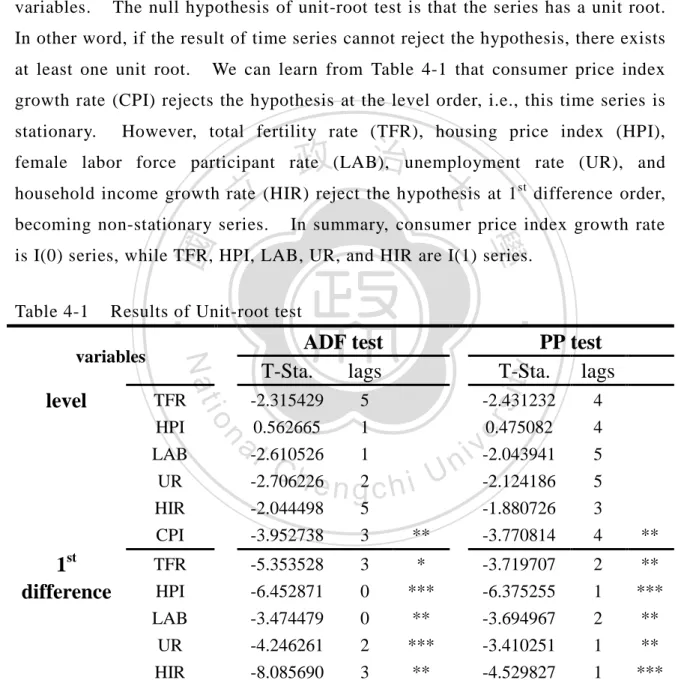
(42) The Relationship between Housing Price and Low Fertility Rate. 4.2 Unit-root Test After ensuring the structural change, the second step is to confirm whether the series data are stationary or not.. This study applies Augmented. Dickey-Fuller (ADF) and Phillips-Perron (PP) unit-root tests to examine the variables.. The null hypothesis of unit-root test is that the series has a unit root.. In other word, if the result of time series cannot reject the hypothesis, there exists at least one unit root.. We can learn from Table 4-1 that consumer price index. growth rate (CPI) rejects the hypothesis at the level order, i.e., this time series is stationary.. However, total fertility rate (TFR), housing price index (HPI),. 政 治 大 household income growth rate (HIR) reject the hypothesis at 1 立. female labor force participant rate (LAB), unemployment rate (UR), and. becoming non-stationary series.. st. difference order,. In summary, consumer price index growth rate. ‧ 國. 學. is I(0) series, while TFR, HPI, LAB, UR, and HIR are I(1) series. Results of Unit-root test. TFR HPI LAB UR HIR. -5.353528 -6.452871 -3.474479 -4.246261 -8.085690. 3 0 0 2 3. Ch. y. sit. 5 1 1 2 5 3. PP test T-Sta. lags. **. -2.431232 0.475082 -2.043941 -2.124186 -1.880726 -3.770814. 4 4 5 5 3 4. **. * *** ** *** **. -3.719707 -6.375255 -3.694967 -3.410251 -4.529827. 2 1 2 1 1. ** *** ** ** ***. er. -2.315429 0.562665 -2.610526 -2.706226 -2.044498 -3.952738. al. n. 1st difference. TFR HPI LAB UR HIR CPI. io. level. ADF test T-Sta. lags. Nat. variables. ‧. Table 4-1. engchi. i n U. v. Note: *** ,** and * denote significance at the 1%, 5% and 10%, respectively.. 42.
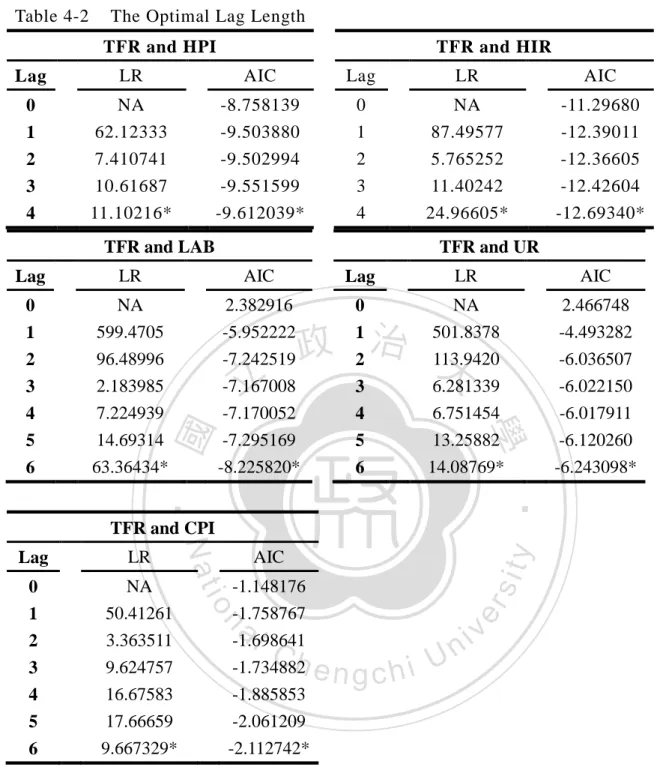
(43) The Relationship between Housing Price and Low Fertility Rate. 4.3. Cointegration Test One of the purposes of this study is to investigate the factors affecting. fertility, thus we employ Johansen (1988) cointegration test to analyze the long-term factors.. From the results of unit-root test in the previous section, TFR. is non-stationary I(1) series.. If cointegration exists between TFR and another. non-stationary variable, indicating that these two variables have a long-term equilibrium relationship.. In this way, we can directly use the standard value to. employ vector error correction model (VECM) to observe the short-term dynamic relationship.. Conversely, if TFR is not cointegrated with another variable,. In this 政 治 大 case, we can conduct vector autoregressive (VAR) model to analyze the short-run 立 relationship between the variables at first-order differential. Consequently, this. which means that these two variables have no long-run relationship.. ‧ 國. 學. study applies the Trace test and Maximum Eigenvalue proposed by Johansen to examine the long-term equilibrium relationship.. ‧. 4.3.1 The Optimal Lag Length. sit. y. Nat. Johansen cointegration test is based on the VAR approach which is. io. n. al. er. extremely sensitive to the lag length, so before estimating the cointegration test, we. i n U. v. should determine the optimal lag length of an unrestricted VAR.. Ch. engchi. In this study,. we use Akaike information criterion (AIC) and Likelihood ratio (LR) test statistic to select the lag length.. The results are shown in Table 4-2.. 43.
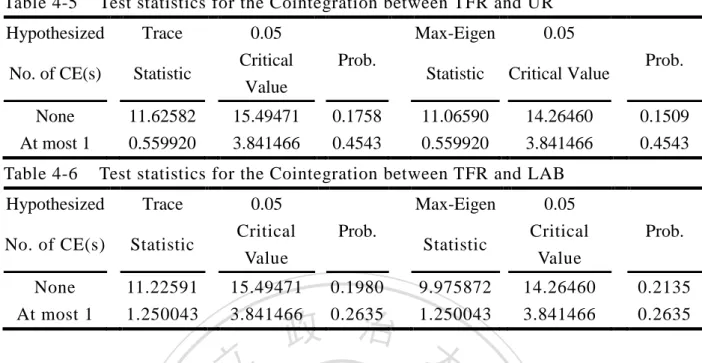
(44) The Relationship between Housing Price and Low Fertility Rate. Table 4-2. The Optimal Lag Length TFR and HPI. TFR and HIR. Lag. LR. AIC. Lag. LR. AIC. 0 1 2 3 4. NA 62.12333 7.410741 10.61687 11.10216*. -8.758139 -9.503880 -9.502994 -9.551599 -9.612039*. 0 1 2 3 4. NA 87.49577 5.765252 11.40242 24.96605*. -11.29680 -12.39011 -12.36605 -12.42604 -12.69340*. TFR and LAB. TFR and UR. Lag. LR. AIC. Lag. LR. AIC. 0 1 2 3 4 5 6. NA 599.4705 96.48996. 2.382916 -5.952222 -7.242519. NA 501.8378 113.9420. 2.466748 -4.493282 -6.036507. 2.183985 7.224939 14.69314 63.36434*. -7.167008 -7.170052 -7.295169 -8.225820*. 0 1 2 3 4 5 6. 6.281339 6.751454 13.25882 14.08769*. -6.022150 -6.017911 -6.120260 -6.243098*. 學 ‧. ‧ 國. 立. 政 治 大. al. sit. -1.148176 -1.758767 -1.698641 -1.734882 -1.885853 -2.061209 -2.112742*. er. NA 50.41261 3.363511 9.624757 16.67583 17.66659 9.667329*. n. 0 1 2 3 4 5 6. AIC. io. LR. Nat. Lag. y. TFR and CPI. Ch. engchi. i n U. v. Note:* denotes the lag order selected by AIC and LR. 4.3.2 Results of Cointegration Test The results of cointegration test are listed from Table 4-3 to Table 4-6. Apparently, there are two variables cointegrated with TFR.. The first one is HPI,. as shown in Table 4-3, the test statistics between TFR and HPI under the Trace test reject the null hypothesis of no cointegration at the 5% significance. 44. The.
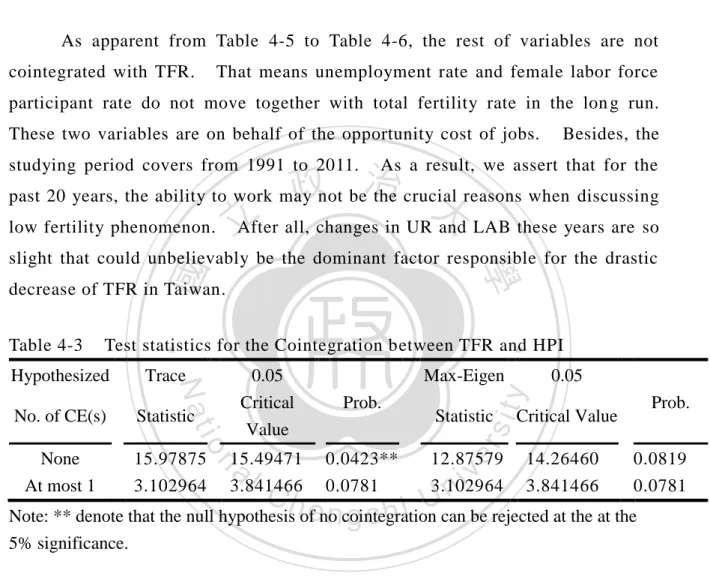
(45) The Relationship between Housing Price and Low Fertility Rate. second one is HIR, as we can see from Table 4-4, the test statistics between TFR and HIR under the Trace test and Maximum Eigenvalue test reject the null hypothesis of no cointegration at the 5% significance.. That is, housing price and. household income growth rate have long-run cointegration relationships with total fertility rate. As apparent from Table 4-5 to Table 4-6, the rest of variables are not cointegrated with TFR.. That means unemployment rate and female labor force. participant rate do not move together with total fertility rate in the lon g run. These two variables are on behalf of the opportunity cost of jobs.. Besides, the. studying period covers from 1991 to 2011.. As a result, we assert that for the 治 政not be the crucial past 20 years, the ability to work may 大 reasons when discussing low fertility phenomenon. 立 After all, changes in UR and LAB these years are so. ‧ 國. 學. slight that could unbelievably be the dominant factor responsible for the drastic decrease of TFR in Taiwan.. ‧. Test statistics for the Cointegration between TFR and HPI. Statistic. None At most 1. 15.97875 3.102964. Max-Eigen Prob.. io. Value. al. n. 15.49471 3.841466. Ch. 0.0423** 0.0781. 0.05. y. No. of CE(s). 0.05 Critical. Prob.. sit. Trace. Nat. Hypothesized. Statistic. er. Table 4-3. 12.87579 3.102964. engchi U. v ni. Critical Value 14.26460 3.841466. 0.0819 0.0781. Note: ** denote that the null hypothesis of no cointegration can be rejected at the at the 5% significance. Table 4-4. Test statistics for the Cointegration between TFR and HIR. Hypothesized. Trace. No. of CE(s). Statistic. None At most 1. 14.02430 6.484713. 0.05 Critical Value 15.49471 3.841466. Prob. 0.0823 0.0109**. Max-Eigen. 0.05. Statistic. Critical Value. 7.539583 6.484713. 14.26460 3.841466. Prob. 0.4274 0.0109**. Note: ** denote that the null hypothesis of no cointegration can be rejected at the at the 5% significance.. 45.
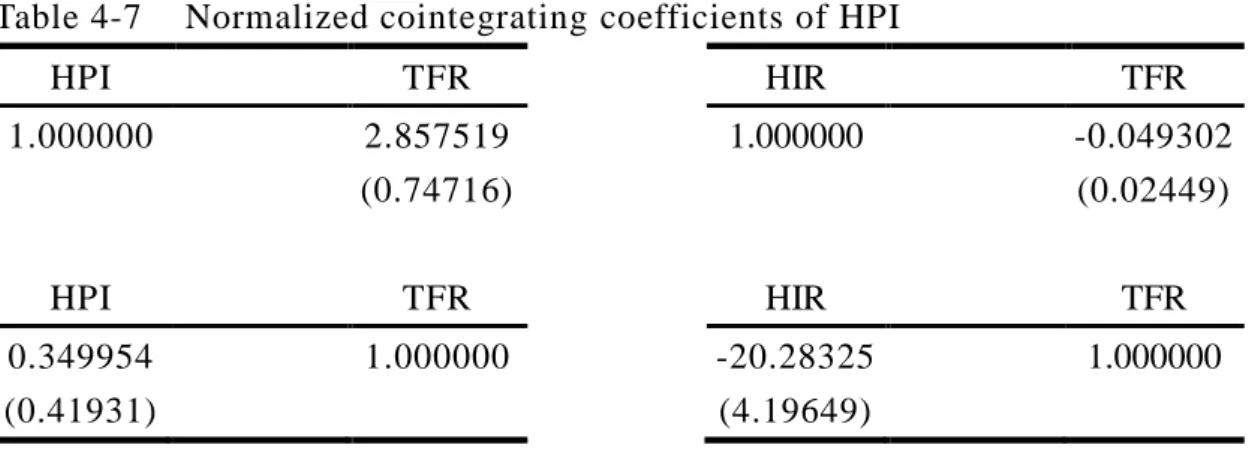
(46) The Relationship between Housing Price and Low Fertility Rate. Table 4-5. Test statistics for the Cointegration between TFR and UR. Hypothesized. Trace. No. of CE(s). Statistic. None At most 1. 11.62582 0.559920. Table 4-6. 0.05 Critical Value. Prob.. 15.49471 3.841466. 0.1758 0.4543. Max-Eigen. 0.05. Statistic. Critical Value. 11.06590 0.559920. 14.26460 3.841466. Prob. 0.1509 0.4543. Test statistics for the Cointegration between TFR and LAB. Hypothesized. Trace. No. of CE(s). Statistic. None At most 1. 11.22591 1.250043. 0.05 Critical Value. Max-Eigen Prob.. 15.49471 3.841466. 0.1980 0.2635. Statistic 9.975872 1.250043. 政 治 大. 立. 0.05 Critical Value. Prob.. 14.26460 3.841466. 0.2135 0.2635. Since HPI and HIR have a long-run cointegration relationship with TFR,. ‧ 國. variables.. 學. we also plan to figure out the signs of impact between TFR and these two In light of this concern, we can see the normalized cointegrating. coefficients from the Table 4-7.. In the economic sense, the coefficient of the. ‧. explanatory variable denotes the percentage change in the explanatory variable.. sit. y. Nat. Notably, a positive (negative) estimated coefficient implies a negative (positive) relationship between the fertility and the variable under consideration (Enders,. io. Specifically, as Table 4-7 reports, a 1% increase in HPI leads to a. n. al. er. 2004, 365).. i n U. v. 0.34% decrease in TFR, while a 1% increase in TFR decrease HPI by 2.85% in the long run.. Ch. engchi. The negative impact of housing price on fertility rate is in line with. Hui et al (2012) and our expected direction.. In other words, basing on our. estimated coefficients supports the hypothesis that the increase in the cost has contributed to decrease TFR over the past 20 years.. However, we didn’t. anticipate that declining fertility rate will cause housing price going up.. It. seems that the traditional economics of supply and demand theory is unable to apply to discuss the relationship between housing price and low fertility rate in this study.. 46.
(47) The Relationship between Housing Price and Low Fertility Rate. Table 4-7. Normalized cointegrating coefficients of HPI. HPI. TFR. HIR. TFR. 1.000000. 2.857519 (0.74716). 1.000000. -0.049302 (0.02449). HPI. TFR. HIR. TFR. 0.349954 (0.41931). 1.000000. -20.28325 (4.19649). 1.000000. Note: Standard error is show in parentheses. There are three plausible interpretations of this concern. First of all, as Lo. 政 治 大. (2012) stated, under limited budget resources available in each household, home-owning and birth-giving seem to compete and crowd out each other.. 立. However, the housing price of Taiwan has keeping soaring for decades, making. ‧ 國. 學. some households eagerly buying houses as soon as possible.. Furthermore,. Taiwanese household mostly prefer to own a house first, and then to plan the. ‧. fertility decision, for a more stable environment for fertility.. Therefore,. Taiwanese household would postpone fertility decision or decrease the number of That is why our empirical. sit. y. Nat. children in order to save more money to buy a house.. io. er. result shows that the decrease of fertility rate would increase housing price. Second, despite the declining TFR, the number of households increases slightly. n. al. year by year, as shown in Figure 4-7.. Ch. i n U. v. This indicates that the real demand of. engchi. home-owning has increased these years, triggering housing price going up. Third, not only the real demand increased, but the artificial demand gained a lot as well.. Referring to Figure 4-8, the amount of M2 has increased during the. studying period, implying that the artificial demand of housing-investing has growing.. In short, increases of real demand and artificial demand make housing. price of Taiwan rised astonishingly as we can see these years.. 47.
數據
+7
相關文件
3- 按大類、組別及細分組計算之旅遊物價指數及其變動率 Índice de Preços Turísticos e variações por secções, grupos e subgrupos Tourist Price Index and rate of change by
zero-coupon bond prices, forward rates, or the short rate.. • Bond price and forward rate models are usually non-Markovian
zero-coupon bond prices, forward rates, or the short rate.. • Bond price and forward rate models are usually non-Markovian
zero-coupon bond prices, forward rates, or the short rate. • Bond price and forward rate models are usually non-Markovian
按大類、組別及細分組計算之旅遊物價指數及其變動率 Índice de Preços Turísticos e variações por secções, grupos e subgrupos Tourist Price Index and rate of change by
按大類、組別及細分組計算之旅遊物價指數及其變動率 Índice de Preços Turísticos e variações por secções, grupos e subgrupos Tourist Price Index and rate of change by
按大類、組別及細分組計算之旅遊物價指數及其變動率 Índice de Preços Turísticos e variações por secções, grupos e subgrupos Tourist Price Index and rate of change by
按大類、組別及細分組計算之旅遊物價指數及其變動率 Índice de Preços Turísticos e variações por secções, grupos e subgrupos Tourist Price Index and rate of change by
