海外投資及避險策略與保險公司價值之探討 - 政大學術集成
84
0
0
全文
(2) Contents 謝辭. 7. Preface. 8. 摘要. 9. Abstract. 10. Chapter I. Introduction ............................................................................................12. Chapter II. Is Asset Allocation a Myth or a Reality? An Empirical Study on Taiwan Life Insurance Industry...........................................................................16. 2.1 2.2. 政 治 大 Literature Review............................................................................................23 立 Introduction ....................................................................................................16. International Diversification ................................................................... 23. 2.2.2. Home Equity Bias Puzzle ......................................................................... 24. 2.3. Research Design..............................................................................................26. 2.3.1. Home Equity Bias Puzzle ......................................................................... 26. 2.3.2. International Portfolio Holdings and Investment Performance................ 26. 2.4. Empirical Analysis............................................................................................28. 2.4.1. Data and Variables .................................................................................. 28. 2.4.2. Variable Descriptive Statistics and Correlation Analysis........................... 31. 2.5. Empirical Model ..............................................................................................34. 2.5.1. Home Equity Bias Puzzle ......................................................................... 35. 2.5.2. The Relationship between International Portfolio and Investment Performance. ‧. ‧ 國. 學. 2.2.1. n. er. io. sit. y. Nat. al. Ch. engchi. i n U. v. of Taiwan Life Insurers............................................................................. 35 2.6. Empirical Results .............................................................................................38. 2.6.1. Empirical Results of Home Equity Bias Puzzle Hypothesis........................ 38. 2.6.2. Empirical Results of the Relationship between Foreign Investment and. 1.
(3) Asset Allocation Performance ................................................................. 39 2.6.3. Testing the Impact of Outlier .................................................................. 45. 2.6.4. Testing the Size Effects............................................................................ 47. 2.7. Concluding Remarks .......................................................................................48. Chapter III Striving for Home Advantages? An Empirical Study of Currency Hedging of Taiwan Life Insurers ...........................................................................49 3.1. Introduction ....................................................................................................49. 3.2. Literature Review ............................................................................................55. 3.2.1. 政 治 大 The Relationship between Hedging and Performance ............................. 56 立. 3.2.3. Optimal Hedging Strategy ....................................................................... 56. 學. ‧ 國. 3.2.2. Hedging Motives..................................................................................... 55. Research Design ..............................................................................................57. 3.3.1. Relationship between Currency Hedging and Investment Performance .................. 57. 3.3.2. The Relationship among Currency Hedging, Manager Incentive and. ‧. 3.3. sit. y. Nat. 3.4.2. Empirical Analysis............................................................................................59. al. v i n Ch Data and Variables .................................................................................. 59 engchi U n. 3.4.1. io. 3.4. er. Economy of Scale .................................................................................... 58. Variable Descriptive Statistics and Correlation Analysis........................... 61. 3.5. Empirical Model ..............................................................................................63. 3.5.1. The Relationship between Foreign Investment and Investment Performance ........................................................................................... 63. 3.5.2. The Relationship among Currency Hedging, Manager Incentive and Economy of Scale .................................................................................... 64. 3.6 3.6.1. Empirical Results ...............................................................................................65 Empirical Results of the Relationship between Foreign Investment and Investment Performance ........................................................................................... 65 2.
(4) 3.6.2. Empirical Results of the Relationship among Currency Hedging, Manager Incentive and Economy of Scale .............................................................. 67. 3.6.3. Empirical Results of the Relationship between Currency Hedging and ROE (ROA)....................................................................................................... 71. 3.7. Concluding Remarks..........................................................................................72. Chapter IV. Conclusions and Future Research...........................................................74. Reference .....................................................................................................................76. 立. 政 治 大. ‧. ‧ 國. 學. n. er. io. sit. y. Nat. al. Ch. engchi. 3. i n U. v.
(5) List of Tables Table 2.1. Foreign Investment in Taiwan Life Insurance ..........................................21. Table 2.2. Sample Companies ..................................................................................29. Table 2.3. Sample Companies ..................................................................................29. Table 2.4. Variable Definition...................................................................................30. Table 2.5. Summary Statistics ..................................................................................32. Table 2.6. Ratio.........................................................................................................32. Table 2.7. 政 治 大 Return ......................................................................................................33 立 FinR..........................................................................................................33. Table 2.9. Correlation Matrix ...................................................................................34. Table 2.10. Test Home Equity Bias Puzzle Hypothesis (pooled model)......................39. Table 2.11. Test the Factors Influencing the Foreign Investment Ratio .....................42. Table 2.12. Test the Relationship between Foreign Investment and Investment. ‧. ‧ 國. 學. Table 2.8. n. er. io. sit. y. Nat. al. v. Performance...........................................................................................43. Ch. engchi. i n U. Table 2.13. Effect of 2008 Financial Crisis on Return on Foreign Investment............46. Table 2.14. Size Effects on Ratio and Return..............................................................47. Table 3.1. Sample Companies ..................................................................................60. Table 3.2. Sample Companies ..................................................................................60. Table 3.3. Variable Definition...................................................................................61. Table 3.4. Variables Statistics ...................................................................................62. Table 3.5. Correlation Matrix ...................................................................................63. Table 3.6. The Relationship between Currency Hedging and Investment Performance...........................................................................................67. 4.
(6) Table 3.7. The Relationship among Currency Hedging and Manager Incentive......69. Table 3.8. The Relationship among Currency Hedging and Economy of Scale ........70. Table 3.9. The Relationship among Currency Hedging and Economy of Scale(OLS)71. 立. 政 治 大. ‧. ‧ 國. 學. n. er. io. sit. y. Nat. al. Ch. engchi. 5. i n U. v.
(7) List of Figures Figure 2.1. Investment Portfolios of Taiwan Life Insurers (1996-2008)...................18. Figure 2.2. Investment Portfolios of Taiwan Life Insurers (1996-2008)...................18. Figure 2.3. Investment Portfolios of Taiwan Life Insurers (2004-2009) ...................20. Figure 2.4. Taiwan Ten-year Government Bond Yield and Three-Year Deposit Interest Rate, and U.S. Ten-Year Government Bond Yield. ....................20. Exchange Rates of the New Taiwan Dollar against the U.S. Dollar. .......52. 學. ‧. io. sit. y. Nat. n. al. er. Figure 3.2. 政 治 大 and U.S. Ten-Year 立 Government Bond Yield. ...........................................51 Taiwan Three-Year Deposit Interest Rate and Foreign Investment Ratio,. ‧ 國. Figure 3.1. Ch. engchi. 6. i n U. v.
(8) 謝辭. 謹將本論文獻給摯愛的家人以及栽培我的中央信託局暨臺灣銀行。 首先要感謝朱浩民教授及張士傑教授的指導,讓我得以順利完成主要論文的 撰寫與發表,朱老師讓我學習到做學問的態度,而張老師的產學專業及熱誠讓本 論文更具使命感,每次 meeting 後的”素珠加油”都讓我更認真的往前走。感謝 口試委員余士迪教授、張元晨教授及郝充仁教授精闢又寶貴的意見,讓本論文更 為嚴謹、完整。 沈中華教授在淡大財金碩士在職專班的課程,以及邱忠榮教授指導獲獎的碩. 政 治 大. 士論文開啟了我的博士學習之旅;霍德明教授的鼓勵讓我撐過最苦的博一日子,. 立. 何靜嫺教授的亦師亦友,讓賽局理論與金融實務產生火花。謝謝陪我走過資格考. ‧ 國. 學. 的同窗好友秉倫、豪漳,淑華,冠臻及計量小老師-子雄。. 感謝許董事長嘉棟的薦送,讓我得以在職進修博士。感謝劉副處長土金及張. ‧. 副處長美月對新人的帶領與包容,讓我得於中信局併入臺銀後繼續未完成的課. y. Nat. 業。感謝徐副處長玉海允許我像麻雀般聒噪的快樂工作,最要感謝張總稽核鴻基. sit. 四年來的肯定,教導與提拔,讓我可以用心工作,努力進修及快樂成長。謝謝上. n. al. er. io. 課期間所有在工作上的備援、協助及鼓勵我的同仁及長官。. Ch. i n U. v. 感謝婆婆的呵護體諒,讓我得以兼顧工作、課業及生活,感謝含莘茹苦的媽. engchi. 媽栽培我長大,更要感謝六年來陪著我念 PAPER、考 TOEIC、鞭策我寫論文, 心情不好還要被我唸的老公,謝謝您成就我得以選擇不同的生活。. 許素珠 謹誌於政治大學金融所 100 年 6 月. 7.
(9) Preface This dissertation consists two essays relevant to Taiwan’s life insurance industry: international asset allocation and currency hedging. The first essay based on Chapter 2, has been presented at the third annual conference on Taiwan Risk and Insurance Association (December 5, 2009), Financial crisis and risk management strategies and development seminar (December 18, 2009). We thank Professor Yu, Shihti and associate professor Peng, Jin Lung for comment, this essay has been published in. 政 治 大. Journal of Risk Management Vol.12 No.1 (May 2010). The second essay based on. 立. Chapter 3, has been presented at 2010 annual conference on Taiwan Economic. ‧ 國. 學. Association (Decmber 18, 2010), the fourth annual conference on Taiwan Risk and Insurance Association (Decmber18, 2010). We thank associate professor Chung-Jen. ‧. Hao and associate professor Chun-Ping Chang for comment, this essay has been. Nat. n. al. er. io. sit. y. published in Middle Eastern Finance and Economics, Vol.12 (April 2011).. Ch. engchi. 8. i n U. v.
(10) 摘要. 本論文包含台灣壽險業資產配置國際化及匯率避險兩個主題。首先,探討台 灣壽險業積極向主管機關申請核准提高國外資產配置比率,與美國投資人偏好投 資自己國家資產不一致的現象,是台灣壽險業資產配置不得不的策略,或是國際 化的迷思? 以 25 家壽險公司 2004 年至 2008 年財務資料實證結果發現,國外資 產納入投資組合對壽險業投資績效有利。如果將樣本公司依據所有權區分為本資 公司與外資公司,資料顯示,本資公司國際資產配置較為積極,惟其報酬績效與 外資公司差異並不顯著。研究亦發現,2008 年美國次貸風暴顯著負向影響台灣. 政 治 大. 壽險公司國外投資報酬,即提高國外資產配置雖可提高報酬,惟匯率風險、信用 風險及系統風險暴露亦相對提高,建議壽險公司於追球較高報酬同時,應同時加. 立. 強風險管理。另實證亦發現,資產規模愈大公司之投資報酬率相對較遜,建議於. ‧ 國. 學. 追求保費市占率成長時,應重視投資報酬績效的實質提升。. 第二部分探討 2004 年至 2008 年台灣壽險業國外投資匯率風險管理策略對. ‧. 投資績效影響。以整體產業觀察,匯率避險對投資報酬率有正面效果;本資公司. sit. y. Nat. 避險策略相較外資公司積極,報酬率亦相對較優;股票上市公司有財報揭露股價 波動之壓力,經理人有較強誘因採取避險策略,投資報酬率相較優於股票未上市. io. n. al. er. 公司,惟差異並不顯著。實證結果支持 Glen and Jorion (1993) and Campbell et al.. i n U. v. (2010)避險可以降低匯率風險提升投資報酬績效之研究結論,2006 年實施之 34. Ch. engchi. 號會計公報,顯著影響本資公司與上市公司之避險行為。. 關鍵字: 關鍵字. 資產配置; 匯率風險; 本國股權投資偏好迷思;避險策略; 經理人裁決 假說. 9.
(11) Abstract. In this study, we study two essays on international asset allocation and the currency hedging problem for Taiwan life insurer industry. In the first essay, we investigate the high percentage of foreign investments placed by Taiwan life insurers and how this phenomenon is at odds with the bias for investing at home common among American investors. The holdings of 25 Taiwan life insurance companies, between the years 2004 and 2008, are scrutinized with a view towards evaluating home bias and its financial impact. We find that foreign investment has proven profitable for. 政 治 大 ownership structure, i.e.,. the life insurance industry. However, if the life insurance industry is divided into two categories according to its. domestic-owned and. 立 foreign-owned companies, and that while the performance of investments made by. ‧ 國. 學. domestic-owned life insurers differs from that of foreign-owned life insurers, the difference is insignificant. We also found that global financial turmoil in 2008 had a. ‧. massively negative impact on the foreign investments of Taiwan life insurance. y. Nat. companies and firm size and return on investment is negative correlated, suggesting. n. al. er. io. management.. sit. that life insurers should focus on enhancing investment performance and risk. Ch. i n U. v. In the second essay, we examine the currency hedging strategy and its impact. engchi. on the performance of Taiwan life insurance industry investments from 2004 to 2008. We find that currency hedging strategies have yielded positive results, overall, for the industry. However, if the life insurance industry is divided into two categories according to its ownership structure, i.e., domestic-owned and foreign-owned companies, the results show that the currency hedging strategies employed by the domestic-owned companies enjoy advantages over those of foreign-owned firms. If the sample is further divided into those publicly listed on the TAIEX and others, our results show that a hedging strategy has positive effects on listed company. Our findings support the work in Glen and Jorion (1993) and Campbell et al. (2010), which reveal that hedging strategies improve foreign investment returns and can reduce currency risks in comparison to non-hedging strategies. Our empirical results 10.
(12) indicate that SFAS No. 34 has a significant effect on currency hedging behavior among domestically owned and listed companies.. Asset Allocation; Exchange Rate Risk; Home Equity Bias Puzzle; Hedging Strategy; Managerial Discretion Hypothesis. 立. 政 治 大. 學 ‧. ‧ 國 io. sit. y. Nat. n. al. er. Keywords:. Ch. engchi. 11. i n U. v.
(13) Chapter I Introduction There are two opposing views regarding whether or not having international investments improves the performance of a portfolio. Grubel (1968), Levy and Sarnat (1970), Grauer and Hakansson(1987), Eun and Resnick (1988), Glen and Jorion (1993), Solnik (1995), De Roon et al.(2001), Nijman and De Roon (2001), Goetzmann et al.(2005) suggest that the hedging effect makes foreign investments more profitable. In contrast, Levy and Lerman (1988), Detzler (1999) state that the transaction costs,. 治 政 大does not effectively reduce Solnik (1995) finds that diversification of a portfolio 立 exchange rate risk. Glen and Jorion (1993) propose that portfolios containing of. or fees paid to the fund managers, will offset the foreign investment performance;. ‧ 國. 學. equity securities from different countries may reduce return volatility and diversify risk. For that reason, including equity securities from various countries has become. ‧. an increasingly popular among pension funds.. sit. y. Nat. According to financial theory, a portfolio should be internationally diversified,. io. er. but French and Poterba (1991), Cooper and Kaplanis (1994) and Tesar and Werner (1995) find that most investors hold nearly all of their wealth in terms of domestic. n. al. Ch. i n U. v. assets. Statistics from French and Poterba (1991) show that 98.11% of Japanese. engchi. securities are held domestically, 93.8% of the U.S. securities are held within America, and 82% of the securities of the United Kingdom are held within Great Britain. The U.S. hosts the largest stock markets in the world, with market capitalization accounting for as much as 34% of the global equity securities, and yet Cooper and Kaplanis (1994) found that 97% of equity securities are held by American mutual funds. Studies by Coval and Moskowitz (1999) and Huberman (2001) came to similar findings. When the dot-com boom burst in late 2000, the global economy suffered a downturn that impacted on economic performance worldwide, including Taiwan. As a result, the Central Bank of Taiwan pursued a low-interest rate policy to stimulate. 12.
(14) economy. This negatively influences fixed income investment instruments. Taiwan-based life insurance companies confront interest rate risks – the lower the interest rate, the more policy sales the more policy reserve should be set. The severe interest-rate problem negatively affected debt of life insurance companies. To alleviate problems stemming from the interest-rate spread, Taiwan life insurance companies gradually increased share of foreign asset. Relevant authorities relaxed restrictions on the use of funds and raised the foreign investment limits from 5% in 2000, up to 35% in 2003, and 45% in 2007. By the end of 2009, the foreign investment rate of Taiwan-based life insurance companies collectively reached 32.17% of all funds available for investment, amounting to NT$2.98 trillion. 政 治 大 Taiwan life insurance industry 立 in their portfolio selection and to investigate the Essay I of this dissertation aims to examine whether a home bias exists in. ‧ 國. 學. relationship between decision factors and foreign investment, and the relationship between foreign investment and investment performance in the industry. Twenty-five Taiwan life insurance companies, during the years 2004 and 2008, are. ‧. examined home bias and its financial impact. We find that: (1) Foreign investment is. sit. y. Nat. profitable for the life insurance industry. The performance of investments made by. io. er. domestic-owned life insurers differs from that of foreign-owned life insurers, the difference is insignificant. (2) The study also finds that global financial turmoil in. n. al. Ch. i n U. v. 2008 had a negative impact on the return on foreign investments of Taiwan life. engchi. insurance companies. This indicates that, in 2008, the U.S. sub-prime mortgage crisis causes huge losses on security bonds, and affects returns on foreign assets. To deal with such shocks, we suggest that improved asset performance and risk management are important. (3) Firm size and return on investment is negative correlated. This suggests that life insurers should focus on improving investment performance. Two opposing views debate whether international investment portfolios should have currency hedging strategies. According to the proposition in Modigliani and Miller (1958), hedging strategies in perfect capital markets, --- no asymmetric information, no taxes, and no transactions costs --- should not affect the value of the firm; the firm value is independent of hedging policy. Conversely, Kaplanis and. 13.
(15) Schaefer (1991) proposed that hedging could reduce the volatility of a company's cash flow and currency risk, and thus increase the value of the company. Studies of Glen and Jorion (1993), Froot et al. (1993), Eun and Resnick (1994) and Odier and Solnik (1993) support foreign stock investment hedging. Several empirical papers, including Nance et al. (1983), Allayannis and Weston (2001), Haushalter (2000), Bartram et al. (2004), and Ben Khediri and Folus (2009a, b) support the value-enhancing hypothesis. However, Karim’s (2010) study shows that using derivatives has no effect on firm valuation in French non-financial firms. Hedging can stabilize a company’s value and maximize lifelong expected utility; therefore, managers often use hedging strategies (Gunther and Siems, 1995; Colquitt and Hoyt,. 政 治 大 In 2008, foreign assets 立already exceeded 30.31% of the industry asset portfolio. 1997).. ‧ 國. 學. and reached 2.4 trillion NT$ (also see Figure 3). However, currency risk exposure has risen and NTD against USD exchange rate volatility was a major currency risk. The investment asset evaluation rule changed from historical cost to fair value when the. ‧. Statement of Financial Accounting Standard (SFAS) No. 34 was implemented in 2006.. sit. y. Nat. Currency hedging derivatives positions should mark to market, which affects the. io. er. volatility of reported earnings. Currency risk management thus became an important issue for Taiwan life insurance industry. Therefore, in Essay II, we examine currency. n. al. Ch. i n U. v. hedging strategies and their impact on the investment performance of Taiwan life. engchi. insurance industry from 2004 to 2008.. We find that: (1) Currency hedging strategies have creates positive results for the industry. (2) Currency hedging strategies employment by the domestic-owned companies and listed companies have more advantages than those of the foreign-owned firms. Our findings support the work in Glen and Jorion (1993) and Campbell et al. (2010), which shows that hedging strategies improve foreign investment returns and can reduce the currency risks compared to non-hedging strategies. Our empirical results indicate that SFAS No. 34 has a significant effect on the currency hedging behaviors of domestic-owned and listed companies.. 14.
(16) The remainder of this dissertation is organized as follows. Chapter II investigates the international asset allocation and impact for Taiwan life insurer industry. Chapter III examines the currency hedging problem for Taiwan life insurer industry. Chapter IV concludes the dissertation.. 立. 政 治 大. ‧. ‧ 國. 學. n. er. io. sit. y. Nat. al. Ch. engchi. 15. i n U. v.
(17) Chapter II Is Asset Allocation a Myth or a Reality? An Empirical Study on Taiwan Life Insurance Industry 2.1. Introduction. There are two opposing views regarding whether or not having international investments enhances the performance of a portfolio.1 Grubel (1968), among others, suggests that the hedging effect 2 makes a portfolio with foreign investments significantly more profitable. In contrast, Levy and Lerman (1988), Detzler (1999). 治 政 foreign investment performance; Solnik (1995) finds that 大awareness of exchange rate 立 of a portfolio does not effectively reduce that risk. risk is rising and the diversification state that the transaction costs, or fees paid to the fund managers, will offset the. ‧ 國. 學. Glen and Jorion (1993) propose that portfolios consisting of equity securities from different countries may reduce return volatility and diversify risk. For that reason,. ‧. including equity securities from various countries has become an increasingly popular trend among pension funds.. sit. y. Nat. io. er. However, internationally diversified portfolio must take account of exchange rate risk; thus, a conservative investor will have a strong preference for domestic. n. al. i n U. v. equity, despite the well-documented gains from diversified international investments;. Ch. engchi. This remains an important, yet unresolved, empirical puzzle in financial economics (Coval and Moskowitz, 1999). This phenomenon is known in literature as the Home Equity Bias Puzzle. According to financial theory, a portfolio should be internationally diversify, but French and Poterba (1991), Cooper and Kaplanis (1994) and Tesar and Werner (1995) find that most investors hold nearly all of their wealth in domestic 1. See Grubel (1968), Levy and Sarnat (1970), Grauer and Hakansson(1987), Eun and Resnick (1988),. Glen and Jorion (1993), Solnik (1995), De Roon et al.(2001), Nijman and De Roon (2001), Goetzmann et al.(2005). 2. Glen and Jorion (1993) propose that it is less effective for a company investing in a single country to. reduce the risk on its domestic investment income because its assets face the same systemic risk. According to French and Poterba (1991), during the period from 1975 to 1989, the correlation coefficient of rate of return in the securities markets of the United States, Japan, Britain, France, Germany and Canada was 0.502. 16.
(18) assets. Statistics from French and Poterba (1991) show that 98.11% of Japanese securities are held domestically, 93.8% of the U.S. securities are held within America, and 82% of the securities of the United Kingdom are held within Great Britain. The U.S. hosts the largest stock markets in the world, with market capitalization accounting for as much as 34% of the global equity securities, and yet Cooper and Kaplanis (1994) found that 97% of equity securities are held by American mutual funds. Studies by Coval and Moskowitz (1999) and Huberman (2001) came to similar findings. The Home Equity Bias Puzzle is clearly evident in the financial markets. What motive drives the Home Equity Bias Puzzle and causes investors to ignore foreign opportunities and the benefits of diversification? Academics offer a variety of. 政 治 大 associated with transacting立 in foreign securities, withholding taxes, and political risk,. explanations, which include both barriers to capital flows created by higher costs. ‧ 國. 學. as well as other factors such as the failure of purchasing power parity (PPP), information asymmetries, and regulation (Brennan and Cao, 1997). French and Poterba (1991), and Fidora et al. (2007) suggest that most investors prefer to buy. ‧. home-country securities because of exchange rate risk and transaction costs.3 Adler. sit. y. Nat. and Dumas (1983) and Uppal (1993) show that deviations from PPP that lead. io. er. investors in different countries to choose portfolios to hedge against different inflation rates could also create a home bias. Coval and Moskowitz (1999) suggest. n. al. Ch. i n U. v. that asymmetric information between local and non-local investors may drive the. engchi. preference for geographically proximate investment. Bertaut and Kole (2004), Chan et al. (2005), Faruqee et al. (2004) and Lane and Milesi-Ferretti (2005) find that distance and language barriers are primary reasons for the home-country investment preference. Sercu and Vanpee (2007) in a literature review on the Home Equity Bias Puzzle, point out those institutional investors have a strong preference for domestic equity because of the feasibility of hedging, transaction costs, capital controls, information asymmetry, national differences and differences in corporate governance. Individual investors prefer home-country asset allocation due to familiarity with the target investments, patriotism, and other factors. 3. Fidora et al. (2007) suggested if the real exchange rate volatility decreases, an investor may reduce. his/her home-country investment preference in bonds by 60% or in equity by about 20%. 17.
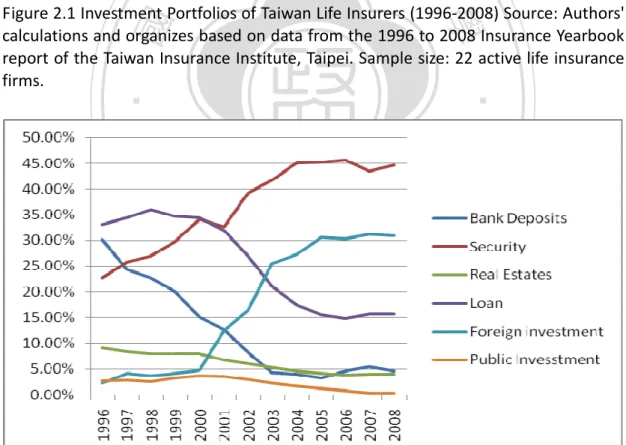
(19) 立. 政 治 大. ‧. ‧ 國. 學. Figure 2.1 Investment Portfolios of Taiwan Life Insurers (1996-2008) Source: Authors' calculations and organizes based on data from the 1996 to 2008 Insurance Yearbook report of the Taiwan Insurance Institute, Taipei. Sample size: 22 active life insurance firms.. n. er. io. sit. y. Nat. al. Ch. engchi. i n U. v. Figure 2.2 Investment Portfolios of Taiwan Life Insurers (1996-2008) Source: Authors' calculations and organizes based on data from the 1996 to 2008 Insurance Yearbook report of the Taiwan Insurance Institute, Taipei. Sample size: 22 active life insurance firms.. 18.
(20) Based on Interest rate parity (IRP) theory, the interest rate spread between the two countries will affect currency values and capital movement, reflecting the differences in the forward rates and the spot rates in currency exchanges. Hung et al. (2009) state that in accordance with equilibrium theory, investors tend to choose domestic investments due to the impacts of exchange rate on the foreign asset, and of the home country exchange rate risk premium. The higher the interest rates in the home country, the greater the investment in the home country and the less in foreign bonds. When the interest rate and exchange rate remain in equilibrium, the discount or premium on the forward exchange rate should be equal to the spread between the interest rates of the two countries. Shukla and Inwegen (1995) report that. 治 政 大 that at least part of this performance shortfall is attributable to inferior market 立 timing by the foreign funds. So room remains for discussion of the advantages and. foreign managed mutual funds in the U.S. are outperformed by domestic funds and. ‧ 國. 學. disadvantages of foreign investment. This paper aims to examine the relationship between the allocation of life insurance funds from Taiwan to international markets. ‧. and the performance of those funds.. sit. y. Nat. The focus of competition among Taiwan life insurance operations is market. io. er. share. The majority of insurance company funds are allocated to interest-sensitive assets, for example bank term deposits, real estate investments, mortgage loans and. n. al. Ch. i n U. v. loans to policy holders (see Figure 2.1, Figure 2.2, Figure 2.3). These assets are. engchi. insensitive with respect to asset and liability management. When the dot-com bubble burst in late 2000, the global economy suffered a downturn that impacted on economic performance worldwide, including in Taiwan. As a result, the Central Bank of Taiwan pursued a low-interest rate policy to foster local investment, and three-year deposit interest rates fell from 5% to 1.5% between 2001 and 2003 (see Figure 2.4). This negatively impacted fixed income investment instruments, and Taiwan-based life insurance companies faced severe interest rate risks – the lower the interest rate, the more policy reserve should be set. The severe interest-rate problem negatively affected the solvency of life insurance companies. To alleviate problems stemming from the negative interest-rate spread, Taiwan life insurance companies gradually increased their foreign asset allocations. The relevant 19.
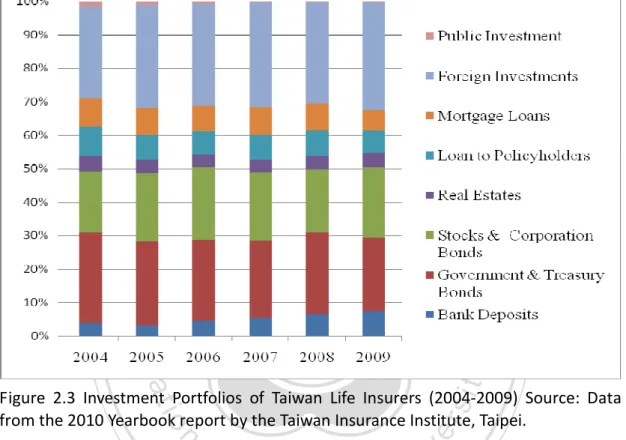
(21) authorities relaxed restrictions on the use of funds and raised the foreign investment limits from 5% in 2000, up to 35% in 2003, and 45% in 2007. By the end of 2009, the foreign investment rate of Taiwan life insurance companies collectively reached 32.17% of life insurance enterprise total funds, amounting to NT$2.98 trillion (Table2.1).. 立. 政 治 大. ‧. ‧ 國. 學 sit. y. Nat. n. al. er. io. Figure 2.3 Investment Portfolios of Taiwan Life Insurers (2004-2009) Source: Data from the 2010 Yearbook report by the Taiwan Insurance Institute, Taipei.. Ch. engchi. i n U. v. Figure 2.4 Taiwan Ten-year Government Bond Yield and Three-Year Deposit Interest Rate, and U.S. Ten-Year Government Bond Yield. Source: TEJ Data Bank.. 20.
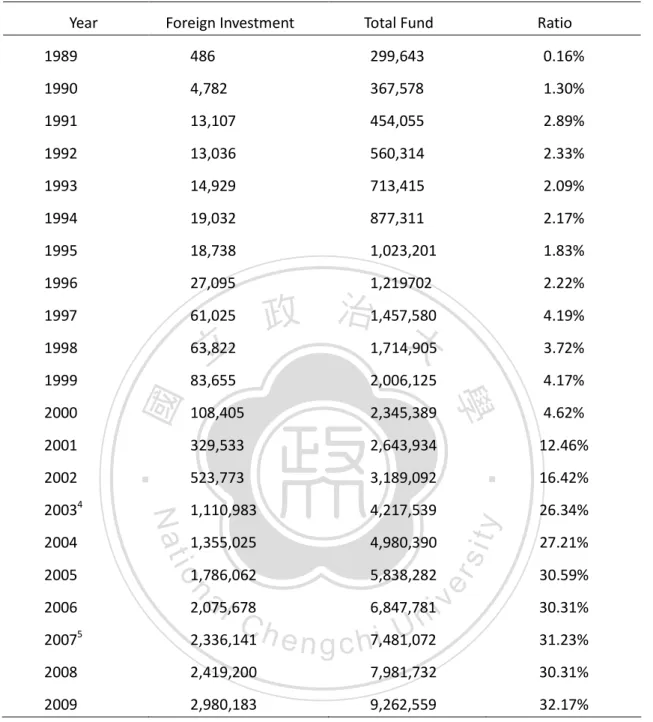
(22) Table 2.1 Foreign Investment in Taiwan Life Insurance Year. Foreign Investment. NT$: million. Total Fund. Ratio. 1989. 486. 299,643. 0.16%. 1990. 4,782. 367,578. 1.30%. 1991. 13,107. 454,055. 2.89%. 1992. 13,036. 560,314. 2.33%. 1993. 14,929. 713,415. 2.09%. 1994. 19,032. 877,311. 2.17%. 1995. 18,738. 1,023,201. 1.83%. 1996. 27,095. 1,219702. 1997. 61,025. 1998. 63,822. 政 治1,457,580 大 1,714,905. 2.22%. 1999. 83,655. 2,006,125. 108,405. 2,345,389. 329,533. 2,643,934. 523,773. 3,189,092. 1,110,983. 4,217,539. 1,355,025. 4,980,390. 1,786,062. y. 5,838,282. n. al. sit. io. 2005. i n U. 4.62% 12.46%. er. 2004. Nat. 20034. 4.17%. ‧. 2002. ‧ 國. 2001. 3.72%. 學. 2000. 立. 4.19%. v. 16.42% 26.34% 27.21% 30.59%. 2006. 2,075,678. 6,847,781. 20075. 2,336,141. i e n g c h7,481,072. 31.23%. 2008. 2,419,200. 7,981,732. 30.31%. 2009. 2,980,183. 9,262,559. 32.17%. Ch. 30.31%. Source: Insurance Yearbook report by the Taiwan Insurance Institute, Taipei.. 4 2001 amendment to Insurance Law, Insurance Law, and Section 146 of the addition of 4: "The insurance industry may apply for foreign investment in the fund; its scope and content, determined by the competent authority. Preceding paragraph shall not exceed the total investment of insurance funds to 5%. However, as the competent authority their operation may be appropriately adjusted annually. Before the adjustment, which shall not exceed 20% of the insurance funds ", in 2003 the proportion of foreign investment limit from 20% to 35%. 5 2007 amendment to Insurance Act, the proportion of foreign investment limits from 35% and then rose to 45%. 21.
(23) Brennan and Cao (1997) show that when domestic investors possess an information advantage over foreign investors about their domestic market, investors tend to purchase foreign assets when returns on foreign assets are high, and to sell when returns are low. Before the year 2000, asset allocation within Taiwan life insurance industry preferred local equity and enjoyed high rates of return; after 2000, the companies have to invest internationally due to low return on domestic investment and negative interest-rate spreads. However, return on foreign investment is sensitive to exchange rate volatility, and the yield of ten-year US Treasuries has been higher than ten-year Taiwan government bonds since 2000 (also see Figure 2.4). Taiwan life insurance firms need to pay 1.5% to 2% currency hedging. 治 政 大 and language barriers costs reduce the return on foreign investment. Distance 立 between the two countries increase transaction costs when dealing with foreign. costs when they adopt currency hedging strategies. Therefore, currency hedging. ‧ 國. 學. securities, withholding taxes, political risk, and information asymmetry. Investment in foreign assets has already exceeded 30% of life insurance enterprise total funds.. ‧. Therefore, it is worthy to investigate whether or not the foreign investment strategy. sit. y. Nat. creates positive benefits.. io. er. This chapter aims to examine if international diversification of asset allocation is a myth or a reality on Taiwan life insurance industry. Twenty-five Taiwan life. n. al. Ch. i n U. v. insurance companies between 2004 and 2008 are selected to unravel the Home. engchi. Equity Bias Puzzle and its financial impact. However, if the sample is divided into two categories. according. to. ownership. structure,. i.e.,. domestic-owned. and. foreign-owned companies, the results show that domestic-owned companies are more aggressive on foreign investment than are foreign-owned firms, and have more advantages than foreign-owned firms. The major results and policy implications are as follows: (1) Empirical results show that foreign investment has a positive impact regarding return on investment in Taiwan life insurance industry. We also found that global financial turmoil in 2008 had a massively negative impact on the foreign investments of Taiwan life insurance companies. This indicates that, in 2008, the U.S. sub-prime mortgage crisis cause huge losses for security bonds, and affecting returns on foreign assets. To deal with such shocks, we suggest that enhanced asset 22.
(24) performance and risk management are important; (2) The size of insurance firms and returns on investment are negatively correlated, suggesting that life insurers should increase their focus on enhancing investment performance as their market share grows. The rest of this chapter is organized as follows. Section 2.2 presents the related literature. Section 2.3 describes the sample, variables and methodology employed in this study. Section 2.4 presents empirical result. Finally, we conclude and provide some policy implications.. 2.2 2.2.1. Literature Review. 政 治 大. International Diversification. 立. The gains from diversification depend on the correlation of returns in different equity. ‧ 國. 學. markets. French and Poterba (1991) compute real returns from the perspective of a U.S. investor, assuming that the investor uses three-month forward contracts to lock. ‧. in an exchange rate for the amount of his initial investment each quarter. The average. y. Nat. pairwise correlation between quarterly returns on the equity markets in the United. sit. States, Japan, Britain, France, Germany and Canada for the 1975-89 periods is 0.502.. er. io. Glen and Jorion (1993) propose that it is less efficient for a single country to attempt. al. n. v i n C On the other hand,Uas there is no entirely positive return volatility and systemic risk. h engchi to reduce risks to its domestic investment income because its assets face the same. correlation6 in the stock price volatility in the stock markets of different countries, a portfolio consisting of equity securities from different countries may reduce volatility. and achieve the objective of risk dispersion (See Grubel, 1968; Levy and Sarnat, 1970; Grauer and Hakansson, 1987; Solnik, 1995 and etc.). Even when the international capital markets return volatility has gradually become more and more relevant, a portfolio of international equity assets can still reduce volatility risk on returns (Goetzmann et al., 2005). Brennan and Cao (1997) show that when domestic investors possess a cumulative information advantage over foreign investors about 6 According to French and Poterba (1991), during the period from 1975 to 1989, the correlation coefficient of rate of return in the securities markets of the United States, Japan, Britain, France, Germany and Canada was 0.502. 23.
(25) their domestic market, investors tend to purchase foreign assets in periods when returns on foreign assets are high and to sell when returns are low. Gelos and Wei (2005) suggest that more transparency is an effective way for countries to benefit from international financial integration while reducing its potentially unpleasant side effects.. 2.2.2. Home Equity Bias Puzzle. A striking feature of international portfolio investment is the extent to which equity portfolios are concentrated in investors’ domestic markets. French and Poterba (1991) estimate that the domestic ownership share of the world’s five largest stock markets to be 92.2% for the US, 95.7% for Japan, 92% for the UK, 79% for Germany,. 政 治 大. and 89.4% for France (figures for the year 1990). Although international portfolio. 立. theory proposes that the addition of foreign equities to a largely domestic portfolio. ‧ 國. 學. can reduce return volatility and enhance performance, a strong preference for domestic equity is nonetheless exhibited by investors in international markets.. ‧. Reasons for this bias may include transaction costs, information costs and exchange rate risks (Sercu and Vanpee, 2007). With regard to transaction costs, Bertaut and. y. Nat. sit. Kole (2004), Chan et al. (2005), Faruqee et al. (2004) and Lane and Milesi-Ferretti. er. io. (2005) find that distance and language barriers between the two countries can. al. explain the home-country investment preference. Martin and Rey (2004) show that. n. v i n transaction cost is a significantC reason for the home-country investment preference. hengchi U Burger and Warnock (2003, 2007) conclude that sound macro-economic policies and laws and regulations affect the willingness of foreign investors to invest in a particular country. Karlsson and Norde’n (2007) analyze new Swedish pension system findings that less-sophisticated individuals tend to be relatively more home-biased. Moreover, in the case of government employees, who enjoy relatively greater job security, there is a greater focus on hedging against domestic inflation than on international diversification, thus, there is a bias towards domestic assets. Tesar and Werner (1995) study the investment turnover rates of equity securities in the United States and Canada, and the results of their empirical research show that foreign investments are bought and sold much more frequently than the domestic investments, which suggests that transaction costs cannot fully explain the Home Equity Bias Puzzle. 24.
(26) On the analysis of information costs, when there is information asymmetry with respect to the target assets, risk-averse investors will prefer to invest in assets for which information is more accessible. Normally, the more standardized the assets, the lower the associated information costs. For example, Treasury bills have lower information costs than corporate bonds or stocks (see Harris and Raviv, 1991; Ahearne et al., 2004; Brennan et al., 2005). When a company's investment information or private information are made public, foreign investors might nonetheless find it more difficult to access information than will domestic investors, therefore, individual American investors will earn higher returns on investment in the United States than in countries far from home. For this reason, greater ease of access. 治 政 大2001; Malloy, 2005; Ivković for home-country investment (see Coval and Moskowitz, 立 and Weisbenner, 2005). Massa and Simonov (2006), looking at Sweden investors, find. to private information relevant to domestic companies will give rise to the preference. ‧ 國. 學. similar results; However, Grinblatt and Keloharju (2000), compare Finnish investors and foreign investors’ performance, and find that foreign investors outperformed. ‧. domestic Finnish investors. Seasholes and Zhu (2007) examine whether Finnish. y. Nat. investors have informational advantages over than foreign investors. Their conclusion. sit. is that there is no significant difference regarding the return on investment, if. er. io. individual investors invest in S&P500 stocks, which have a relatively small degree of. al. n. v i n C results of theseUtwo studies are contradictory, information than foreign investors.hThe engchi. information asymmetry. This means that domestic investors do not possess more. but it seems clear that information costs alone are insufficient to explain fully the reasons preferring domestic equity. Regarding the exchange rate risk analysis, French and Poterba (1991) suggest that exchange rate risk and transaction costs are sufficient to motivate the majority of investors to prefer domestic equity. Traditional or conservative investors will be unwilling to expose themselves to exchange rate risk, and would seek currency hedges for their foreign assets (Campbell et al., 2003). Fidora et al. (2007) has found that fluctuations in exchange rates would significantly affect the preference for domestic equity. The lower real exchange rate volatility, the lower the preference for local equity. Hung et al. (2009) used the general equilibrium theory to analyze the 25.
(27) impact of exchange rates on foreign asset allocation, recognizing that investors tend to choose the investment in their home country due to considerations such as the exchange rate risk premium, and that higher interest rates induce the preference for domestic equity and reduce their foreign bond investments.. 2.3. Research Design. After reviewing the literature in the proceeding sections, this section examine whether or not the Home Equity Bias Puzzle is relevant to Taiwan life insurance companies, then analyzes the raising of the ceiling on foreign investment to determine if this helped improve the performance of investments made by life insurance companies.. 立. Home Equity Bias Puzzle. 學. ‧ 國. 2.3.1. 政 治 大. According to financial theory, a portfolio should be international, but French and Poterba (1991), found a strong preference for domestic equity among investors in the. ‧. international markets. More traditional or conservative investors are less inclined to. y. Nat. exposing themselves to exchange rate risks. Thus, when holding foreign assets, they. sit. tend to hedge against exchange rates, thus reducing their positions returns on. er. io. domestic fixed-income securities (Campbell et al., 2003). As the international capital. al. n. v i n C h expected to increase Taiwan life insurance companies are e n g c h i U their international holdings. market provides many more investment vehicles than are available domestically,. At present, under Section 146-4 of the Insurance Law limits the foreign investment ratio to 45%, and yet the foreign assets of Taiwan life insurance industry account for. approximately 30% of their funds, so there is room for further investment abroad, and the question should be asked: why hasn’t the industry further diversified? This chapter wishes to explore the following hypothesis: H1:. 2.3.2. Taiwan Life insurer shows Home Equity Bias.. International Portfolio Holdings and Investment Performance. The gains realized from diversification depend on the correlation of returns derived 26.
(28) from different equity markets, according to French and Poterba (1991). The volatility of stock prices in different countries is not well correlated. A portfolio of equity securities from different countries can reduce volatility and disperse risk (See Grubel, 1968; Levy and Sarnat, 1970; Grauer and Hakansson, 1987; Solnik, 1995, etc.). Even if international capital markets the volatility of investment on reurns are growing more and more relevant, a portfolio consisting of international equity assets can still reduce the volatility of return on investment (Goetzmann et al., 2005). Having a diverse international portfolio has become a trend among long-term funds and institutional investors. Taiwan life insurance companies struggle to improve their risk management and. 政 治 大 and thereby enhance the. risk-based capital requirements to acquire competent authorities approval for a. 立. higher foreign invest ratio. performance of their. ‧ 國. 學. investments. U.S. bonds are issued regularly, and secondary markets are well developed, contributing to America’s status as a major world capital market. Also, U.S. ten-year government bonds offer a higher yield than do Taiwan ten-year government. ‧. bonds, meaning that Taiwan long-term bond market and trading volume are at a. sit. y. Nat. competitive disadvantage. Taiwan investment tools, trading volume, and returns. io. er. cannot satisfy the needs of life insurers for asset allocation, and low interest rates since 200l have increased their exposure to interest rate risk. Domestically owned. n. al. Ch. i n U. v. companies will normally consider acquiring foreign bonds for their portfolios.. engchi. Therefore, as the competent authorities gradually deregulate foreign investment limit ratio, this deregulation policy will enhance the asset investment performance. We develop the following hypothesis: H2: Raising the ratio of foreign investment can improve asset investment performance of Taiwan life insurance companies.. 27.
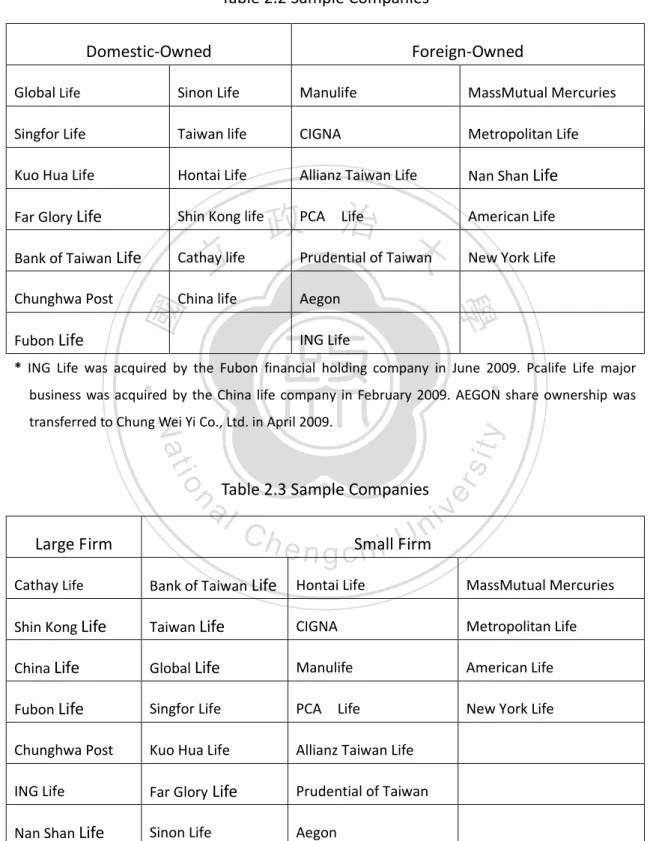
(29) 2.4. Empirical Analysis. This paper aims to investigate whether a home bias exists in Taiwan life insurance industry in their portfolio selection, evaluate the relationship between decision factors and foreign investment and the relationship between foreign investment and investment performance in the industry. Because their parent companies of foreign-owned firms have experienced foreign investment and risk management teams to assist in decision-making for their subsidiaries, the risk profile of their foreign investments is roughly equivalent to that of their domestic investments;. 治 政 Hence, we wish to大explore. Foreign-owned companies also enjoy the benefit of having access to best-practice asset-liability management.. 立. whether or not. domestic-owned firms adopting diverse international portfolios perform better than. ‧ 國. 學. foreign-owned firms. The financial and economic data are extracted from the Insurance Year Book, issued by the Taiwan Insurance Institute, the Taiwan Economic. ‧. Journal Data Bank (TEJ), and the TWSE Market Observation Post System. NTD Exchange Rates (annual) are extracted from the Central Bank of the Republic of China. y. Nat. n. a. er. io. Rates.. sit. (Taiwan) Exchange Rates of the NTD against the USD Interbank Spot Market Closing. 2.4.1. l Data and Variables. Ch. engchi. i n U. v. Because Taiwan insurance institute data base build form 2004, and majority Taiwan life insurers are not publicly issued stocks, the difficulty in collecting return on investment (Return) and exchange rate gains and losses (FinR) data, this study data . Therefore, this study data period is from 2004 to 2008, and the sample comprises 25 active life insurance companies. The study attempts to compare foreign asset allocation decisions and the investment efficiency of Taiwan life insurance firms. The 25 sample companies were segmented into two categories according to the equity-owner. If 50% of equity was held overseas, it is classified as a foreign-owned firm; otherwise it is considered a domestic-owned firm. In total, there were a total of 13 domestic-owned companies and 12 foreign-owned companies exist (see Table 2.2). If 25 sample companies were segmented into two categories according to the asset. 28.
(30) If firm’s asset is larger than average (263 billion), it is labeled as a large firm; otherwise it is a small firm. In total, there are 7 large companies and 18 small companies (see Table 2.3). The variables are defined in Table2.4. Table 2.2 Sample Companies Domestic-Owned. Foreign-Owned. Global Life. Sinon Life. Manulife. MassMutual Mercuries. Singfor Life. Taiwan life. CIGNA. Metropolitan Life. Kuo Hua Life. Hontai Life. Allianz Taiwan Life. Nan Shan Life. Far Glory Life. Shin Kong life. Bank of Taiwan Life. Cathay life. Chunghwa Post. China life. ‧ 國. Aegon. American Life New York Life. 學. Fubon Life. 立. Life 政PCA 治 大 Prudential of Taiwan. ING Life. ‧. * ING Life was acquired by the Fubon financial holding company in June 2009. Pcalife Life major business was acquired by the China life company in February 2009. AEGON share ownership was. Table 2.3 Sample Companies. n. al. Large Firm. er. io. sit. y. Nat. transferred to Chung Wei Yi Co., Ltd. in April 2009.. i n Ch U e n g cSmall h i Firm. v. Cathay Life. Bank of Taiwan Life. Hontai Life. MassMutual Mercuries. Shin Kong Life. Taiwan Life. CIGNA. Metropolitan Life. China Life. Global Life. Manulife. American Life. Fubon Life. Singfor Life. PCA. New York Life. Chunghwa Post. Kuo Hua Life. Allianz Taiwan Life. ING Life. Far Glory Life. Prudential of Taiwan. Nan Shan Life. Sinon Life. Aegon. 29. Life.
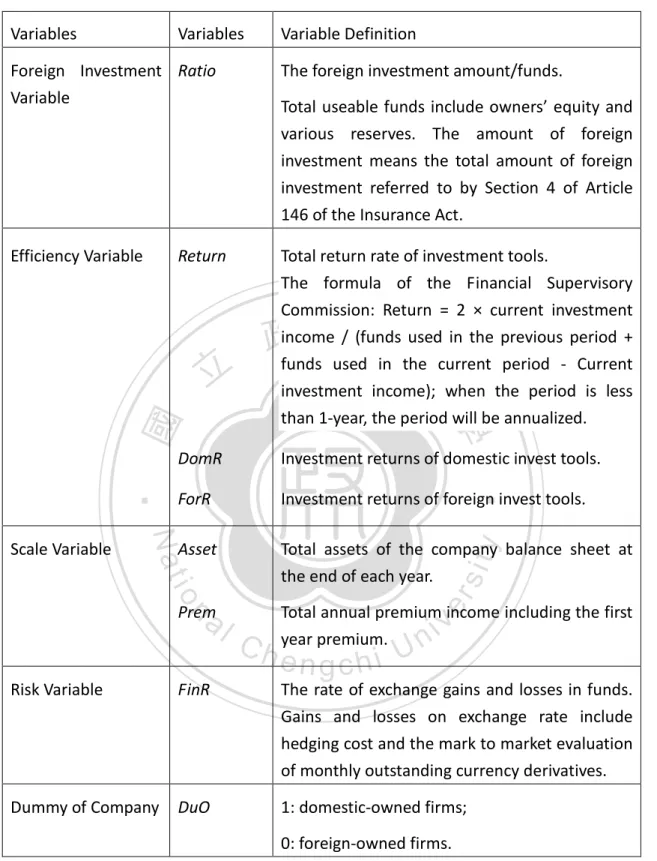
(31) Table 2.4 Variable Definition Variables. Variables. Variable Definition. Foreign Investment Ratio Variable. The foreign investment amount/funds.. Efficiency Variable. Total return rate of investment tools. The formula of the Financial Supervisory Commission: Return = 2 × current investment income / (funds used in the previous period +. Return. 政 治 大 funds used in the current period - Current investment income); when the period is less than 1-year, the period will be annualized.. 學. DomR. Investment returns of domestic invest tools.. ForR. Investment returns of foreign invest tools.. ‧. ‧ 國. 立. y. Nat. Total assets of the company balance sheet at the end of each year.. io. al. sit. Asset. er. Scale Variable. Total useable funds include owners’ equity and various reserves. The amount of foreign investment means the total amount of foreign investment referred to by Section 4 of Article 146 of the Insurance Act.. n. Prem. Ch. v. Total annual premium income including the first year premium.. engchi. i n U. Risk Variable. FinR. The rate of exchange gains and losses in funds. Gains and losses on exchange rate include hedging cost and the mark to market evaluation of monthly outstanding currency derivatives.. Dummy of Company. DuO. 1: domestic-owned firms; 0: foreign-owned firms.. 30.
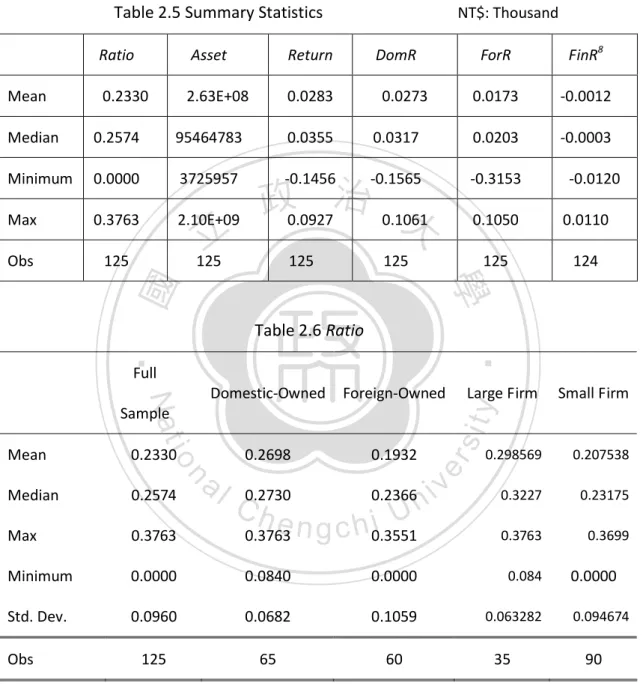
(32) 2.4.2 Variable Descriptive Statistics and Correlation Analysis Variables associated with the descriptive statistics of the study sample are listed in Table 2.5. The average rate of foreign investment is 23.30%, with a median of 25.74%. The highest rate of foreign investment is 37.63% and the lowest is 0%7; The average rate of foreign investment in domestic-owned companies is 26.98%, with a median of 27.30%, which are higher than those of foreign-owned companies at 19.32% and 23.66% (see Table 2.6). In other words, domestic-owned companies more aggressively pursue an international investment strategy than do foreign-owned companies. The average rate of return on investment is 2.83%, with a median of 3.55%. The. 政 治 大. highest rate of investment return, 9.27%, and the worst performance, -14.56% in. 立. 2008 due to the U.S. sub-prime mortgage crisis (see Table 2.7). The average rate of. ‧ 國. 學. return on investment among foreign-owned companies is 3.08%, which is higher than the 2.60% made by domestic-owned companies. However, in terms of median, the. ‧. domestic-owned companies realized profits of 4.11%, higher than the 3.24% earned by foreign-owned companies. The worst performance of domestic-owned firms. y. Nat. sit. (about -14.56%) in 2008 is underperformance than foreign-owned companies’. al. er. io. -1.43%. This means that internationalization has made asset return volatility more. n. relevant, higher proportion of foreign investment, and higher exposure to systemic risk.. Ch. engchi. i n U. v. The average return on investment was less than the median, showing a positive skew. The peak coefficient of 12.0738 is larger than 3, showing a kurtosis distribution. The basic statistical variables for the pursuit of higher returns in the international investment; companies must bear the currency, credit risk and systemic risk. The competent authorities have increased the ceiling for foreign investment to not exceed 45% of the insurance enterprise funds of each individual enterprise. When the insurers pursue higher returns by following an international investment strategy;. 7. For example, the CIGNA, a foreign-owned insurer, invested all its assets in Taiwan during the period. 2004-2006, and for this reason most of the revenue came from individual accident and health insurance, and term life insurance 31.
(33) in such a case, insurers also have to accept higher risks. Thus, raising the proportion of foreign investment does not yet fully redress the problem of negative interest-rate spreads for Taiwan life insurance industry.. Table 2.5 Summary Statistics. Mean. Ratio. Asset. Return. 0.2330. 2.63E+08. 0.0283. NT$: Thousand ForR. FinR8. 0.0173. -0.0012 -0.0003. DomR 0.0273. Median. 0.2574. 95464783. 0.0355. 0.0317. 0.0203. Minimum. 0.0000. 3725957. -0.1456. -0.1565. -0.3153. Max. 0.3763. 2.10E+09. Obs. 125. 125. 立. 政0.0927治 0.1061 大 125. 0.1050. 0.0110. 125. 124. 125. ‧ 國. 學 Table 2.6 Ratio. ‧. Full. Foreign-Owned. 0.2698. 0.1932. 0.2730. 0.2366. Large Firm. io. sit. y. Nat. Domestic-Owned. Sample. 0.2330. Median. 0.2574. Max. 0.3763. Minimum. 0.0000. 0.0840. 0.0000. 0.084. Std. Dev.. 0.0960. 0.0682. 0.1059. 0.063282. 125. 65. 60. n. al. Ch. er. Mean. Obs. -0.0120. i n U. i e n g c h 0.3551. 0.3763. v. Small Firm. 0.298569. 0.207538. 0.3227. 0.23175. 0.3763. 0.3699. 35. 0.0000 0.094674. 90. 8 The year of 2006 missing one sample, so the rate of exchange gains and losses in funds (FinR) sample= (25*5year)-1=124. 32.
(34) Table 2.7 Return Small. Full Domestic-Owned Foreign-Owned. Large Firm Firm. Sample Mean. 0.0283. 0.0260. 0.0308. 0.035831. 0.025427. Median. 0.0355. 0.0411. 0.0324. 0.0426. 0.0304. Max. 0.0927. 0.0845. 0.0927. 0.0845. 0.0927. Minimum. -0.1456. -0.1456. -0.0143. -0.0235. -0.1456. Std. Dev.. 0.0328. 0.02613. 0.034741. Skewness. -2.3641. 0.0195 政 治 大 -2.1388 0.0129. -0.78897. -2.58759. Kurtosis. 12.0738. 8.4892. 4.4163. 0.054338. 9.797642. 65. 60. ‧ 國. 立. 125. 35. 90. ‧. n. al. sit. Large. Small. Firm. Firm. 2.57E-05. -0.00166. -0.0007. -0.0002. Foreign-Owned. er. io. Domestic-Owned9. y. Table 2.8 FinR. Nat. Full. 學. Obs. 0.0415. v. Mean. -0.0012. -0.0018. i n U. Median. -0.0003. -0.0012. -9.01E-06. Maximum. 0.0110. 0.0098. 0.0110. 0.011. 0.0072. Min. -0.0120. -0.0103. -0.0120. -0.0072. -0.012. Std. Dev.. 0.0039. 0.0040. 0.0036. 0.003786. 0.003863. 124. 64. 60. Sample. Obs. 9. Ch. e n g c h i-0.0004. 35. 89. Bank of Taiwan life insurance missing one sample in 2006, so the rate of exchange gains and losses. in funds (FinR) sample = (13*5year)-1=64.. 33.
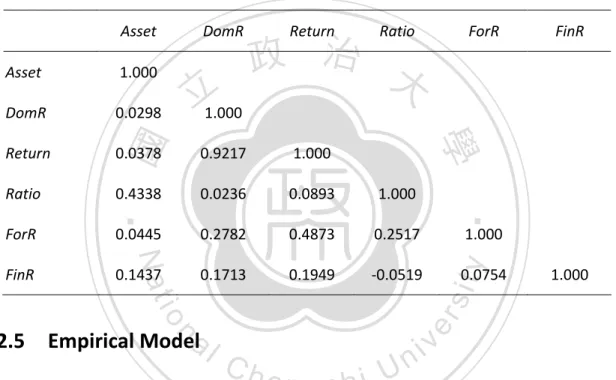
(35) Table 2.9 reports the correlation matrix of variables. The gains and losses on exchange rate (FinR) and return on investment (Retrun) correlation coefficient is 0.4873, and is negatively correlated with the proportion of foreign investment. Note that correlation coefficient between Investment return from domestic investing instruments (DomR) and return on investment (Return) is 0.9217, indicating that the two variables is highly-correlated. This may suffer from multicollinearity when both the two variables enter regression specification. In the following analysis, we avoid trap of multicollinearity when proceeding regression analysis. Table 2.9 Correlation Matrix. DomR. 0.0298. 0.1437. 政 治 大. 0.0378. 0.9217. 1.000. 0.4338. 0.0236. 0.0893. 1.000. 0.0445. 0.2782. 0.4873. 0.2517. 0.1713. 0.1949. -0.0519. Nat. n. Empirical Modela l. FinR. 1.000. 0.0754. 1.000. er. io. 2.5. ForR. ‧. FinR. Ratio. Ratio. 學. ForR. Return. 立1.000. Return. y. 1.000. ‧ 國. Asset. DomR. sit. Asset. Ch. engchi. i n U. v. There are two opposing views on whether or not asset portfolios should be broadly international. To reduce the negative interest-rate spread problem, Taiwan life insurers changed their asset allocation from home-biased to internationally diversified starting in 2000. The foreign investment allocation rose from 4.62% in 2000 to 27.21% in 2004. In 2009, foreign assets already exceeded 32.17% and reached NT$2.98 trillion. The high percentage of foreign investment on the balance sheets of Taiwan life insurers speaks against the Home Equity Bias Puzzle. This study attempts to evaluate the Home Equity Bias Puzzle and its financial impact on Taiwan life insurance industry. To verify the hypothesis, the following empirical models are employed in this study.. 34.
(36) 2.5.1. Home Equity Bias Puzzle. Before verifying the relationship between the proportion of foreign investment and investment efficiency, a Regression equation (1) is to verify whether the investment portfolios of Taiwan life insurance companies demonstrate a preference for local equity, and to review whether the domestically owned companies are more subject to the Home Equity Bias Puzzle than are foreign-owned companies. The regression equation is as follows:. Ratioi ,t = α i + β DuO i ,t + ui ,t. 立. (1). 政 治 大. i = 1, …, N stand for life insurance companies and t = 1, …, T for time period.. ‧ 國. 學. The dependent variable for Regression (1) is foreign investment ratio (Ratio). If. ‧. the β1 coefficient is negative, support hypothesis H1, it indicates that domestically owned firms have an Equity Home Equity Bias. In other words, the domestically. Nat. sit. y. owned company’s investment portfolio demonstrates a greater local equity. al. er. io. preference than does the foreign-owned company. If β1 coefficient is a positive,. n. reject hypothesis H1. This indicates that domestically owned companies are more. Ch. i n U. v. actively engaged in foreign investments than are foreign-owned companies.. 2.5.2. engchi. The Relationship between International Portfolio and Investment Performance of Taiwan Life Insurers. To improve the severity of the problem of the negative interest-rate spread, the competent authorities of Taiwan have amended insurance laws on many occasions, raising the proportion of foreign investment to help the insurance industry to enhance return on investments between the proportion of foreign investment and investment efficiency, regression equation (2) is to investigate what factors affect Taiwan life insurer’s foreign investment decision.. 35.
(37) What Factors Affect the Foreign Investment Decisions of Taiwan Life Insurers? Before examining the relationship between amount of foreign investment and investment performance, the regression equation (2) will check what factors affect the foreign investment decisions of Taiwan life insurers; the regression equation is as follows:. Ratioi ,t = γ i + γ 1 log( Asseti ,t ) + γ 2 DormRi ,t + γ 3 ForRi ,t + γ 4 FinRi ,t + ε i ,t. (2). 政 治 大. Investors reveal a Home Equity Bias in their investments due to exchange rate risk and unfamiliarity with the target investments (Sercu and Vanpee, 2007). Due to a. 立. lack of long-term capital instruments and in the absence of asset and liability. ‧ 國. 學. management, Taiwan life insurers faced a seriously negative interest-rate spread problem beginning in 2000. Large-scale companies are under greater pressure to. ‧. enhance the performance of their assets and want to deepen the diversity of their international portfolios, so it is expected that the γ 1 (Asset) coefficient is positive.. y. Nat. sit. Therefore, if domestic investments can offer higher returns, financial theory suggests. er. io. that life insurance companies will be reluctant to invest abroad because they wish to. al. avoid currency risk and asymmetric information. Thus, the γ 2 (DomR) coefficient is. n. v i n expected to be negative. On theCother if foreignUassets can be expected to earn h ehand, n gchi higher returns than bank deposits or other investment instruments, then insurers will increase their proportion of foreign assets, thus, the coefficient of γ 3 (ForR) is expected to be positive. The coefficient γ 4 (FinR), gains and losses on exchange rates include the cost of currency hedging and market-to-market gains and losses on outstanding derivatives. Because the yield of ten-year Taiwan government bonds are less than the yield on U.S. ten-year government bonds, insurance firms who adopt a hedging strategy and buy U.S. bonds will be required to pay a 1.5% to 2% currency hedging cost. Therefore, currency hedging costs will reduce the return on foreign investment. In other words, currency risk will reduce the willingness to invest. Therefore, the γ 4 coefficient is expected to be negative.. 36.
(38) Regression equation (2) analyses the factors affecting foreign investment decisions; regression equation (3) examines the relationship between foreign investment and the efficiency of asset allocation of Taiwan life insurance companies. The controlling variables are company size, gains and losses on exchange rate, and the proxy variables of corporate. The regression equation is as follow:. Returni,t = αi + α1 Ratioi,t + α2log(Asseti,t ) + α3 FinRi,t + α4 DuOi,t + µi,t. (3). If the α1 coefficient is positive, it represents proportion of foreign investment and. 政 治 大 proportion of foreign investment, the better the anticipated performance of the life 立 insurance companies. This result supports both the decisions of the competent. investment performance is positive relationship. In other words, the higher the. ‧ 國. 學. authorities to gradually raise the foreign investment limit ratio to enhance asset investment. performance,. and. hypothesis. H2.. Asset. management. has. ‧. scale-effects—larger or publicly listed life insurance companies tend to have greater. y. Nat. experience than do smaller firms in terms of asset management, risk management,. io. sit. and larger companies enjoy positive scale effects. Therefore, the α 2 coefficient will. n. al. er. be positive. The benefit of fully hedging portfolio assets is that this can reduce. i n U. v. fluctuations in the value of foreign assets. If hedging is not done, firms will save the. Ch. engchi. costs of hedging but face the risk of fluctuating valuations of the foreign investment portfolio and the associated impact on the value of the company. If the. α 3 coefficient is negative, it means that gains and losses on foreign exchange will reduce the return on assets and the value of the life insurance company. When the. α 3 coefficient is positive, this represents a favorable exchange rate change for foreign currency assets and will enhance the value of the company. If the regression result of. α 4 coefficient is positive, this means that the domestic companies have better asset management capabilities than do foreign-owned companies. On the other hand, when α 4 coefficient is negative, then the domestic companies have worse asset management capabilities than do foreign-owned companies.. 37.
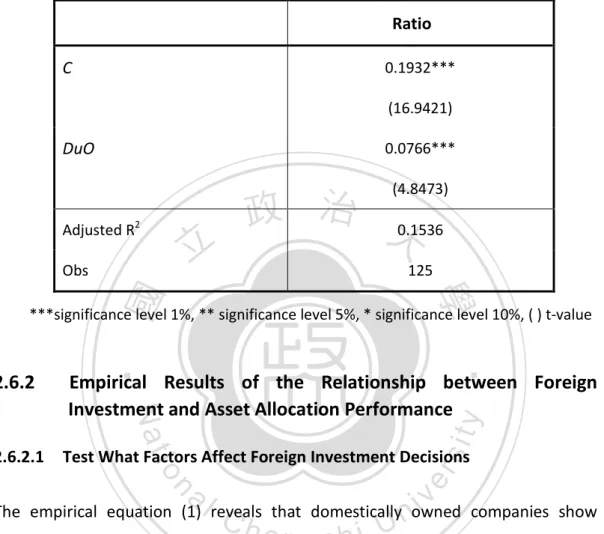
(39) 2.6. Empirical Results. The empirical data scrutinized in this study are panel data. We use Eviews software to analyze regression panel data that has the properties of both cross-sectional and time series. The increase in degrees of freedom can reduce a linear superposition degree, thereby increasing the efficiency of estimates, while at the same to enabling researchers to grasp the differences between individual companies and time series dynamics. It clarifies the relationship between variables and the implied meaning of the behavior, and reduces the possibility of estimation bias by the observation of Individual-Specific Error Term, Time-Specific Error Term, and Random Error Term.. 政 治 大. Fixed effects panel data model allows us to control the characteristics of each company and to calculate the differences between individual companies to observe. 立. the dynamics of each company and the scenario when it is subject to external shocks. ‧ 國. 學. (Nucci and Pozzolo, 2001). Asset management and hedge effectiveness may be influenced by unobservable characteristics, such as the effectiveness of the. ‧. company's managers, thus affecting the value of the company. Therefore, this study references the study of Allayannis and Weston (2001) and uses the fixed effects panel. y. Nat. sit. data model in hopes of better analyzing the relationship between making substantial. al. er. io. foreign investments and the return on investment while considering the. n. characteristics of individual companies.. 2.6.1. i n U. C. v. h e Equity Empirical Results of Home h i Puzzle Hypothesis n g cBias. Empirical model Equation (1) is used to review the allocation of capital assets of domestic companies and to see whether or not domestic companies display a greater preference to invest at home than do foreign companies. Table 2.10 shows the adjusted R2 coefficient is 0.153563. The β1 coefficient is significantly greater than 0 at the 1% level. In other words, domestic-owned companies show a greater preference to invest abroad than do foreign-owned companies. Empirical results differ from what the literature suggests concerning the barriers to capital flows created by higher costs associated with transacting in foreign securities, withholding taxes, political risk, information asymmetries, and regulation. Our empirical results reject the Hypothesis H1, that is, the domestic-owned firms’ asset allocation preferences 38.
(40) give rise to an Equity Home Bias, which in turn leads to a more aggressive stance regarding international asset allocation than is seen among foreign-owned companies. Table 2.10 Test Home Equity Bias Puzzle Hypothesis (pooled model) Ratio C. 0.1932*** (16.9421). DuO. 0.0766*** (4.8473). Adjusted R2. 立. Obs. 政 治 大0.1536 125. ‧ 國. 學. ***significance level 1%, ** significance level 5%, * significance level 10%, ( ) t-value. Empirical Results of the Relationship between Foreign Investment and Asset Allocation Performance. sit. y. Nat. n. al. er. Test What Factors Affect Foreign Investment Decisions. io. 2.6.2.1. ‧. 2.6.2. Ch. i n U. v. The empirical equation (1) reveals that domestically owned companies show a. engchi. preference to invest abroad. This conclusion differs from those of French & Poterba (1991), Cooper and Kaplanis (1994) and Tesar & Werner (1995), all of whom suggest that the Equity Home Bias is a factor. Therefore, this section will examine what factors affect the foreign investment decisions made by Taiwan life insurance industry. Table 2.11 presents the Equation (2) regression results. The pooled panel data model adjusted R2 is 0.338662 and the fixed effects panel data model adjusted R2 is 0.763656, indicating that the fixed effects panel data model has twice as much capability as the pooled panel data model to explain the phenomena. The fixed effects panel data model has a good degree of fitness and can be used to reduce the amount of information of individual companies in the. 39.
(41) information aggregation process and thus decreasing estimation errors by a significant degree. On the other words, fixed effects panel data model can be used to retain each company’s ability to manage the asset and hedge efficiency, which corresponds with the research results of Nucci and Pozzolo (2001), who state that fixed effects panel data model can be used to effectively observe the characteristics of individual companies. In addition, the fixed effects panel data model is used to verify the impact on asset and risk management10 when the competent authorities supervise the ratio of investment in foreign assets and individual companies make their investments in foreign assets. The regression results are summarized as follows: For all models γ 1 (Asset) were significantly positive, this indicates that the larger. 政 治 大 that the larger the asset 立 size of Taiwan companies, the stronger the tendency to. the asset size is the higher the proportion of foreign investment will be. It is verified. ‧ 國. 學. invest in foreign assets in order to overcome the problem of insufficient long-term capital instruments and reduce negative interest-rate problem. This empirical reflecting for reduce interest risk and improve lower interest rate higher premium. ‧. affect new policy sales problem, the new policy sale strategy from traditional life to. Bancassurance. aggressive. promotion. sit. channel,. y. change. Nat. insurance. io. er. Investment-Linked Insurance and Interest Rate Sensitivity Policies let high growth premium revenue let asset allocate myth in foreign investment.. al. n. v i n Creturns (DomR) domestic investment instruments were h e n on gchi U. For all models, γ 2. negative, and γ 3 (ForR), the greater the international investment allocation: the. higher the return on foreign investment, the greater the international investment allocation. This finding supports Brennan and Cao (1997), which demonstrated that when domestic investors possess a cumulative information advantage over foreign. 10. The FSC amended the Article 15 of “The Foreign Investment Management for the Insurance. Industry” in 2008, which stipulates that an insurer that has set up measures to process and monitor the foreign investment-related transactions can invest 10% of its insurance funds in foreign investment if the decision is approved by the board of directors. However, if the foreign investment amount reaches the 25-45% limits, the case should be reviewed and approved by the competent authority, depending on the implementation of internal controls, risk management capabilities, whether a risk management department and its risk-control chief are set up, experience in foreign venture capital investment, and the proportion of risk capital. 40.
(42) investors regarding domestic market conditions, investors tend to purchase foreign assets in periods when the return on foreign assets is high and to sell when the return is low. This result—showing that the return on domestic of investments is lower than foreign instruments—helps explain why Taiwan life insurance firms have continuously transferred life enterprise funds abroad since the year 2000. Thus, foreign investment ratios have increased from 4.62% in 2000 to 32.17% in 2009. Under the pooled panel data model, γ 4 (FinR) the gains and losses on exchange rates are significantly negative, which means the currency risk will reduce the willingness to invest in foreign assets. Because there is an interest-rate spread between Taiwan and the United States, those adopting the hedging strategies are. 政 治 大 return on foreign investment, 立there is a negative relationship between exchange rate required to pay between 1.5% and 2% in hedging costs. As hedging costs reduce the. ‧ 國. 學. risk and foreign investment. Under the fixed effects panel data model, which takes each company's characteristics into consideration, the γ 4 coefficient is negative but insignificant. It is inferred that the companies adopt different hedging strategies.. ‧. Larger companies tend to have a better capability for managing exchange rate risks. io. er. γ 4 coefficient, albeit not at a significant level.. sit. y. Nat. than do small- and medium-sized companies, thus leading to a negative. al. n. v i n C hwill have a significantly the returns on foreign investment e n g c h i U positive effect on foreign In summary, regression Equation (2) confirms that the scale of a company and. investment, while hedging costs and exchange rate fluctuations have a significant negative impact on foreign investment.. 41.
(43) Table 2.11 Test the Factors Influencing the Foreign Investment Ratio Ratio Pooled model. C. log(Asset). DomR. Fixed effect. -0.405463***. -0.444770. (-4.717832). (-1.356167). 0.034301***. 0.036867**. (7.381500). (2.068834). -0.076715. -0.114623. 政 治 大 0.412441*** (-0.356014). ForR. (2.045921). -3.027950* (-1.642592). -0.262000 (-0.203124). 0.338662. 0.763656. 124. 124. sit. y. Nat. Obs. (2.801021). ‧. Adjusted R2. 0.206009**. 學. FinR. ‧ 國. 立. (-0.816352). 1. ***significance level 1%, ** significance level 5%, * significance level 10%, ( ) t-value. io. n. al. er. 2. The variable FinR misses one sample. Also see footnote 8.. 2.6.2.2. Ch. engchi. i n U. v. Empirical Results of the Relationship between Foreign Investment and Investment Performance. Regression Equation (3) examines the relationship between foreign investment and investment performance. The dependent variable is return on investment (Return). The controlling variables are company size, the gains and losses on exchange rates, and the proxy variables of firms. Table 2.12 shows estimated results of regression (3). Four models are estimated. The first three are conventional models that only consider the casual link from Ratio to Return while the last further controls the possible effect of two-way interdependence of Ratio and Return. To solve the endogeneity between the two variables, two-stage least square estimation is 42.
數據

+7
相關文件
In terms of rehiring the same foreign worker, the employer needs to process document on his own prior to the worker's return to his or her home country (The employer does not need
To offer foreign fisherman employed to work in Taiwan sounder care and impose obligations on employers to manage foreign fishermen for the purpose of improving their
z Choose a delivery month that is as close as possible to, but later than, the end of the life of the hedge. z When there is no futures contract on the asset being hedged, choose
Now, nearly all of the current flows through wire S since it has a much lower resistance than the light bulb. The light bulb does not glow because the current flowing through it
Currency risk is the risk that the fair value or future cash flows of a financial instrument will fluctuate due to changes in currency exchange rates. The Fund’s
Currency risk is the risk that the fair value or future cash flows of a financial instrument will fluctuate due to changes in currency exchange rates. The Fund’s
Wallace (1989), "National price levels, purchasing power parity, and cointegration: a test of four high inflation economics," Journal of International Money and Finance,
Acceptance of donations for naming rights (i.e. donations made on the condition that the receiving organization will name a specified “asset”, such as a building, a school,
