會計制度對壽險公司資產負債管理之影響 - 政大學術集成
67
0
0
全文
(2) 謝辭 時光荏苒,碩士生活轉眼間也即將結束。猶記得剛進來時的自信滿滿及意氣 風發,總天真的認為自己能通曉所有學識、攻克所有難關,在經過兩年的打磨及 淬煉後才真正瞭解到學無止境,過去以至於現在所自認擁有的學問僅是在以管窺 天。因此這兩年除了學識上的充足之外,更深自警惕自己在未來的道路上應更加 謙卑且戒慎戒恐。 本篇論文所以能完成首先要感謝蔡政憲老師。我常自慚不是什麼勤奮的學生,. 政 治 大 導,耐心的提出建議及勸導,常令我不勝感激。除了課業上的指導,在老師身上 立. 總是習慣將事情延宕到最後一天才開始動工,而老師一直以來總是不厭其煩的指. 我還學到了品酒及泡茶等雅緻的興趣,豐富我的生活。感謝謝明華老師,不論是. ‧ 國. 學. 在課堂上及研究案都讓我獲益良多,並且在口試時也不吝提供寶貴的建議。感謝. ‧. 詹芳書學長在我撰寫論文的過程中給予極大的幫助,並且在口試時一一提點出本. y. Nat. 篇論文應該加強的部份。此外也要感謝悉心指導我的風管所老師們:感謝陳彩稚. er. io. sit. 老師在風險管理課程上的細心安排,奠定了我對保險及風險管理的基礎,並在每 週的報告及文獻閱讀中逐漸成長;感謝王儷玲老師兩年以來像大家長一樣不遺餘. al. n. v i n 力的照顧著我們,並總是以學生們的福祉做優先考量;感謝林建智老師為我們這 Ch engchi U. 些不懂法律的學生們開啟了一扇通往保險法的門扉,讓我們在老師活潑且風趣的. 講課下逐漸瞭解保險法的內涵;感謝黃泓智老師在壽險數學上完善的教學,我相 信在這堂課上所學會成為我就業時的利器;感謝張士傑老師帶我實地瞭解中國保 險市場的現況,老師的翩翩君子之風一直令我敬佩不已;感謝鄭士卿老師對論文 研究方法的教導,當時學到的統計方法不論是在學術或是就業上都非常實用;感 謝謝耀龍老師在行銷上面的指導,讓我學習到更多不同面相的事物。另外還要感 謝國貿系的郭維裕老師,不論是在課堂或是研究案上,老師的見解總是令我大開 眼界,並對財務金融有更深一層的體會。.
(3) 再來要感謝這兩年一起奮鬥的風管所同學們,很高興能在碩士兩年辛勞的生 活中還能有你們的陪伴,舒緩生活中的苦悶。這兩年來我們的足跡遍及台灣各地 甚至於上海,每一次出遊的時光都是值得珍惜的回憶。我相信畢業對我們來說不 是結束,只是一個新的開始。感謝管理組的各位,與你們一同為了報告在學校待 到半夜的生活至今仍讓我回味無窮,很感謝你們這兩年的扶持;感謝精算組的各 位,在每個充滿壓力的期中期末只要我感到煩躁,你們的悠閒總是能令我放鬆; 感謝法律組的同學們,能讓一路從理工背景上來的我嘗試從另一個角度看事情, 從你們的思考邏輯中我學習到許多寶貴的經驗。另外也要感謝歷屆學長姐們一直. 政 治 大 感謝所有一路幫助我的好朋友們,感謝你們忍受我的暴行至今。與你們之間 立. 對我們照顧有加,建立起如此歡樂且溫馨的大家庭。. ‧ 國. 學. 我想不太需要什麼客套的言詞,我知道在我需要的時候可以全心信任你們照看著 我的背後,而在你們需要的時候我也能義無反顧的支持你們到底。我始終相信好. ‧. 人會有好報,不管你們現在面臨什麼樣的困境,最後終能找到屬於自己的平安喜. sit. y. Nat. 樂。. n. al. er. io. 最後要感謝我的父母、妹妹及其他家人們。感謝你們始終包容我的任性,且. i n U. v. 在背後默默的為我付出。沒有你們,就沒有今天的我,如果我未來有任何值得說. Ch. 嘴的成就,那都是屬於你們的。. engchi. 由於篇幅有限,許多未被提及但仍在我生命中佔有一席之地的人們,在此也 對你們至上無限謝意,與你們的經歷造就了現在的我,並成就未來的我。. 伯軒 謹誌於 2011 年 11 月 11 日.
(4) 摘要 壽險業所販賣之商品通常為長年期保單,此一商品特性使得壽險公司的責任 準備金(負債)非常容易受到市場利率波動而產生變動,進而影響到公司的清償能 力。因此,資產負債管理對壽險公司來說一直是非常重要的一個課題。 過去的會計制度並未強制要求保險公司在財報中反應出準備金對利率的波 動,資產負債管理的好處便無法在這樣的會計制度之下產生原有的作用,進而可 能導致保險公司不重視這樣的管理方式。近年來保險監理的國際趨勢致力於加強 準備金公平衡量以及真實揭露保險業的負債價值,因此我們可以預期在未來準備. 政 治 大. 金的波動對保險公司的影響會較現在來得顯著,資產負債管理對壽險公司也應該 會有較為顯著的影響。. 立. ‧ 國. 學. 本研究採用模擬的方式,比較不同投資策略的壽險公司在不同會計制度之下 的財務狀況,進而探討資產負債管理的策略是否確實能讓保險人在公平價值準備. ‧. 金下較不受利率波動之影響。本研究的結果顯示在公平價值準備金的架構下,採. y. Nat. sit. 用資產負債管理的壽險公司其損益會較沒採用資產負債管理的壽險公司穩定;若. n. al. er. io. 是在帳面價值準備金的架構下,採用資產負債管理的公司反而因為做出了多餘的. i n U. v. 避險行為致使其損益較不穩定。另外,本研究發現若是保險公司在資產負債策略. Ch. engchi. 下所採用的避險指標不符合目前法規,對公司的損益也會造成不必要的波動。因 此本研究認為保險公司在實行資產負債管理策略時,應該參照目前會計制度下所 給定的方式來做避險,進而達到最大的效益。.
(5) Abstract Life insurers' liability value is relatively sensitive to interest rate due to the long term characteristic of the policies. The high leverage ratio strengthens the impact on how interest rate can influence solvency.. Life insurer therefore should manage their assets and liability in a prudent way. In the past, supervisory authorities used to regulate the insurer to recognize their liabilities in book value, which makes the benefits of ALM insignificant. Under such regulation, the main purpose of asset allocation for most of the life insurers was to. 政 治 大 maintain risk at acceptable立 level under book-value reserving. The international. generate higher investment return instead of matching asset with the liability, nor to. ‧ 國. 學. financial report standard No.4 (IFRS4) suggests that insurers should measure their liability under fair value in the future. The new regulation may increases the volatility. ‧. of the life insurer's liability and emerges the benefit of ALM. y. Nat. io. sit. The objective of this article is to compare the effect of ALM strategy on life. n. al. er. insurer's financial statement under both accounting standards via simulation methods.. i n U. v. The result shows that the insurers with ALM face more stable financial statement if. Ch. engchi. they manage their interest rate decently.. One of the results shows that the insurers who manage their asset based on fair value duration faces more volatility than insurers without ALM under book value reserve. This implies that the insurer with ALM still suffers higher volatility if the regulations do not support such behavior. We therefore suggest that the insurers should manage their asset based on their liability interest rate risk under the condition that they choose the appropriate interest rate risk indicator to fit different regulations..
(6) Contents 1.. Introduction ............................................................................................................. 1. 2.. Literatures Review .................................................................................................. 3 2.1 International Financial Reporting Standards 4 ................................................ 4 (a). The Objective of IFRS4 ................................................................ 5. (b). Best Estimated Liability ................................................................ 7. (c). Risk Adjustment .......................................................................... 12. 政 治 大 2.2 Quantitative Impact Study 5 .......................................................................... 16 立 Residual Margin .......................................................................... 15. (a). Best Estimation ........................................................................... 16. (b). Risk Margin ................................................................................. 21. ‧. ‧ 國. 學. (d). sit. ............................................................................................ 23. n. al. er. .............................................................................................. 24. io. (b). Nat. (a). y. 2.3 Fair Value Reserve Estimation ....................................................................... 22. (c) 3.. i n U. v. ............................................................................................. 26. Ch. engchi. Simulation ............................................................................................................. 26 3.1 The Investment Markets ................................................................................ 27 (a). Interest Rate Model and Bond Markets....................................... 27. (b). Stock markets .............................................................................. 28. 3.2 Policy's Specifications ................................................................................... 28 (a). Cash Flow of a Twenty-Year Endowment Policy ....................... 29. (b). Policy assumptions ...................................................................... 30.
(7) 3.3 Reserves ......................................................................................................... 30 (a). Policy reserves............................................................................. 30. (b). Reserve Duration ......................................................................... 33. 3.4 Investment Strategy ....................................................................................... 33 (a). Buy-and-Hold Strategy ............................................................... 34. (b). Duration Matching Strategy ........................................................ 35. 3.5 Insurer's Activities.......................................................................................... 37 (a) (b). Simulation Results ................................................................................................ 42. 學. ‧ 國. 4.. 政 治 大 At the Ending period ................................................................... 39 立. At the Beginning Period .............................................................. 37. 4.1 Balance Sheet Results .................................................................................... 44. ‧. Equity .......................................................................................... 45. (b). Profit and Loss ............................................................................ 48. sit. y. Nat. (a). n. al. er. io. 4.2 Sensitivity Test Results .................................................................................. 52. 5.. i n U. v. (a). Result 1........................................................................................ 53. (b). Result 2........................................................................................ 54. Ch. engchi. Conclusions........................................................................................................... 55. References .................................................................................................................... 57.
(8) Tables Contents Table 1. Taiwan's year work plans for IFRS ............................................................................................. 6. Table 2. Cash flows included or excluded. ............................................................................................. 10. Table 3. The adjusted liquidity premium (100%) for 20 Years ............................................................... 25. Table 4. Assumptions about the endowment product ............................................................................. 31. Table 5. Parameters of the simulation ..................................................................................................... 44. 政 治 大. Table 6. The weighted of efficient frontier portfolio .............................................................................. 44. 立. Table 7. The numerical result of average equity under different reserve regulation (n=10,000) ............ 45. ‧ 國. 學. Table 8. The numerical result of volatility equity under different reserve regulation (n=10,000) .......... 47. ‧. Table 9. The numerical result of VaR equity under different reserve regulation (α=95%) ..................... 48. Nat. io. sit. y. Table 10. The numerical result of average P/L under different reserve regulation (n=10,000) .............. 49. al. er. Table 11. The numerical result of P/L volatility under different reserve regulation (n=10,000) ............ 50. n. v i n Table 12. The numerical result of VaRC P/L under different reserve regulation (α=95%) ....................... 52 hengchi U.
(9) Figures Contents Figure 1. The amortization example for residual margin ........................................................................ 15. Figure 2. Structure of SCR ..................................................................................................................... 21. Figure. 3 The liquidity premium curve in different methods .................................................................. 24. Figure 4. The liquidity premium term structure for Taiwan ................................................................... 25. Figure 5. Insurer's activities at each period ............................................................................................ 42. 政 治 大. Figure 6. Average equity under different reserve regulation (n=10,000) ................................................ 45. 立. Figure 7. Volatility of equity under different reserve regulation (n=10,000) .......................................... 46. ‧ 國. 學. Figure 8. Average P/L under different reserve regulation (n=10,000) .................................................... 49. ‧. Figure 9. P/L volatility under different reserve regulation (n=10,000) ................................................... 50. sit. y. Nat. Figure 10. Volatility of P/L under book value reserve with different σr ................................................. 53. al. er. io. Figure 11. Volatility of P/L under fair value reserve with different σr .................................................... 54. n. v i n Figure 12. Average equity under fair reserve 54 C h in each strategy ................................................................ engchi U.
(10) 1.. Introduction Policy reserves of the life insurer are significant exposed to interest rate due to. the long term characteristic of the policies. The high leverage ratio strengthens the impact of interest rate variation on solvency. Life insurer therefore should manage their assets and liability in a prudent way. One general method to manage the interest risk related to the liabilities of the life insurer is duration matching. Duration matching suggests the insurer allocate assets based on matching the duration of the assets with the duration of current liabilities. 政 治 大. since duration has always been treated as a measurement for the interest rate risk. The. 立. strategy ensures that the change in interest rate does not affect the balance sheet. ‧ 國. 學. tremendously, provides adequate capital for solvency with less volatility and illiquidity.. ‧. sit. y. Nat. In the past, accounting standards used to regulate the insurer to recognize their. io. er. liabilities in book value, which makes the benefits of ALM insignificant. Since reserves remained stable regardless of the changing in interest rate, ALM strategy may. al. n. v i n generate lower return because ofCits relatively passive U h e n g c h i investment strategy. This may. causes that most of life insurers allocate their asset in order to generate higher return instead of matching asset with the liability or maintaining risk at acceptable level under book-value reserving. The international financial report standard No.4 (IFRS4) suggests the insurers should measure their liabilities under fair value in the future. This change increases the volatility of the life insurer's liability and emerges the benefits of ALM. In this case, even if the insurers without ALM can generate higher return from their 1.
(11) investment strategy, they may still suffer greater volatility from the interest risk and their equity or profit may be unstable. The objective of this article is to compare the effect of ALM strategy on life insurer's shareholder's equity, profit and loss under both accounting standards. We expect that the life insurers with ALM have more stable financial statement under fair value reserving. To achieve this goal, we apply the techniques of balance sheet simulation to simulate the dynamic of a life insurer. We assume that there are two kinds of the life. 政 治 大. insurers. Some of the insurers use buy-and-hold strategy. Under this strategy, the. 立. insurers invest their capitals on market assets in a given weighed which is independent. ‧ 國. 學. of time. Other insurers invest their capital by duration matching in order to eliminate the impact of the interest risk, which represents the insurers with ALM.. ‧. sit. y. Nat. We adopt IFRS4 to estimate the life insurance reserve in fair value and compare. io. er. the performances of these two kinds of insurers under different fair value reserving and book value reserving. Then we can find out whether it is true or not that the. al. n. v i n insurer without ALM generates C higher profit and equity h e n g c h i Uunder book value reserving, while the insurer with ALM gets more stable financial statement under fair value. reserving. The result shows that the insurer who allocates assets by book value duration has more stable financial statement while the insurer who uses buy and hold strategy suffers from relatively high volatility under book value reserve. One of the interesting results is that the insurer who allocates assets by fair value duration faces even more volatility than insurer with buy-and-hold strategy. This may imply that the insurer still 2.
(12) suffers great volatility under management if the regulations do not support such behavior. Under fair value reserve, the insurer who uses buy-and-hold strategy has greater volatility of its profit and loss than the insurer with ALM. It is reasonable because of the mismatching allocation. And for an insurer who uses book value duration matching faces more interest risk than book value duration matching insurer. Although the difference between each strategy can be observed from the volatility of profit and loss, our simulation cannot reflect such consequence on shareholder's equity. The results of shareholder's equity are dominated by the. 政 治 大 effect on the shareholder's 立 equity. This leaves an unfinished issue for further research. estimation method of reserve. Different strategy in different regulation shows little. ‧ 國. 學. This article is organized as follows. Section 2 reviews the literatures of fair value reserve techniques. Section 3 presents our simulation model, including the. ‧. assumptions and the setting of asset and liability sides. Section 4 exhibits the. y. Nat. Literatures Review. al. er. io. v i n C hpast accounting standards The primary different between and future accounting engchi U n. 2.. sit. simulation results and our comments. In section 5, we present our conclusions.. standards is the recognition of the reserve. Since most of the insurers still report their reserve as book value and one of our objectives is to compare fair value reserve with book value reserve, it is important to find a reasonable and convince method for estimating insurer's fair value reserve. For calculation of fair value reserve, our first concern is that the estimation of the fair value reserve can be consistent with future regulation as close as possible. Since more and more countries prepared to adopt International Financial Reporting 3.
(13) Standards (IFRS), the 4th report of IFRS which is also known as IFRS4 seems to be a reasonable reference for fair value reserve. IFRS4 specifically defines the main components that should be used for fair value liabilities and the concepts of each component. IFRS4 gives users a comprehensive view of fair value reserve, but it does not provide the method or any specification in estimation. Several regulations such as Solvency II and Swiss Solvency Test keep test the impact of fair value reserve and have several developments in estimating. The fifth Quantitative Impact Study (QIS5). 政 治 大 methods and parameters for立 fair value reserve estimation and provides detailed. is an exercise in the development of Solvency II regulation. QIS5 tests different. ‧ 國. 學. information for the estimation. We therefore follow QIS5's guide in order to make the simulation more close to practical situation.. ‧. In this section we review the regulation of IFRS4 and the technical specification. y. Nat. io. sit. of QIS5. In the first subsection we go through IFRS4 in order to realize the definition. n. al. er. of fair value reserve. The second subsection is the techniques for fair value reserve from QIS5.. Ch. engchi. i n U. v. 2.1 International Financial Reporting Standards 41 International Financial Reporting Standards (IFRS) are principle-based accounting standards, published by the International Accounting Standards Board (IASB). IFRS are used in many countries around the world, including European Union, India, Hong Kong, Canada, Australia, Russia, South Africa, Singapore, Malaysia, Turkey, etc.. 1. Some of the descriptions in this subsection are referred to IFRS4 Exposure Draft, July 2010. 4.
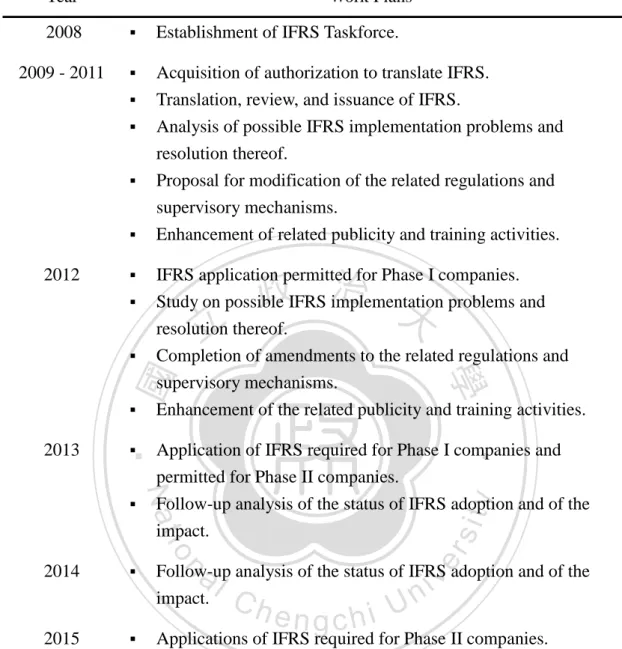
(14) It is expected that IFRS will be adopted worldwide and it is considered beneficial to investors and other users of financial statements. IFRS is believed to have several benefits such as increasing the quality of information, more efficient formulation of domestic accounting standards, improvement of international image, enhancement of the global rankings and international competitiveness of the local capital markets. Taiwan plans to adopt IFRS in two phases: Phase I only includes the listed companies and financial institutions supervised by the Financial Supervisory Commission. They will be required to prepare financial statements in accordance with. 政 治 大 unlisted public companies,立 credit cooperatives and credit card companies. They will. Taiwan's IFRS regulation starting from January 1, 2013. Phase II then includes other. ‧ 國. 學. be required to prepare financial statements in accordance with Taiwan's IFRS regulation starting from January 1, 2019. Still they will are permitted to apply. ‧. Taiwan's IFRS regulation starting from January 1, 2013. The timetable of Taiwan's. io. sit. y. Nat. work plan is listed in table 1.. n. al. er. The insurance industry will therefore faces the impact of IFRS after the adoption.. i n U. v. Until now IFRS has issued nine reporting standards for different financial instruments. Ch. engchi. and industries, and the forth standards IFRS4 is established for insurance contract. We summarize the IFRS4 exposure draft which was issued in August 2010 in the next part. (a) The Objective of IFRS4 The objective of IFRS4 is to establish the principles that an insurer should apply. The principles require the insurers to report useful information about the timing and uncertainty of cash flows from insurance contracts they issued. IFRS4 proposes an improved way to the accounting for insurance contract. It 5.
(15) Table 1. Taiwan's year work plans for IFRS Year. Work Plans. 2008. . Establishment of IFRS Taskforce.. 2009 - 2011. . Acquisition of authorization to translate IFRS. Translation, review, and issuance of IFRS. Analysis of possible IFRS implementation problems and resolution thereof. Proposal for modification of the related regulations and supervisory mechanisms.. . . Enhancement of related publicity and training activities.. . IFRS application permitted for Phase I companies. Study on possible IFRS implementation problems and. . 學. Application of IFRS required for Phase I companies and permitted for Phase II companies.. Follow-up analysis of the status of IFRS adoption and of the impact.. io. 2015. . . al. v. Follow-up analysis of the status of IFRS adoption and of the impact.. n. 2014. y. Nat. . ‧. . sit. . 2013. Completion of amendments to the related regulations and supervisory mechanisms. Enhancement of the related publicity and training activities.. ‧ 國. . 政 治 大 resolution 立 thereof.. er. 2012. . Ch. engchi. i n U. Applications of IFRS required for Phase II companies.. Data Resource: Taiwan stock exchange, http://www.twse.com.tw Last visited: 2011/10/17.. provides a comprehensive measurement approach for all type of insurance contracts, with a modified approach for some short-duration contracts. The approach is based on the principle that insurance contracts create a bundle of rights and obligations that a series of cash inflows (premiums) and outflows (benefits and claims). An insurer would estimate their liability by a cash flows measurement 6.
(16) approach that uses the following building blocks: (i). A current estimate of the future cash flows;. (ii) A discount rate that adjust those cash flows for the time value of money; (iii) An explicit risk adjustment; (iv) A residual margin. IFRS4 establishes a measurement model for the insurance contracts and uses a direct measurement that incorporates current, discounted estimates of future cash flows revised at each reporting date, adjusted for the effects of uncertainty about the. 政 治 大. amount and timing of those future cash flows (i.e. a risk adjustment) with a margin. 立. that reports probability of the contracts over their cover period (i.e. residual margin).. ‧ 國. 學. According to IFRS4, we can therefore conclude that there are three main. Expected cash flow during the cover period of the insurance contract,. sit. y. Nat. (i). ‧. components for liability measurement in IFRS4's concept:. al. n. money.. er. io. discounted with proper discount rate which consider the time value of. (ii) Risk adjustment.. Ch. engchi. i n U. v. (iii) Residual margin. The first component is also defined as Best Estimated Liability (BEL) in IFRS4. The definition and extent of each component are described as follow: (b) Best Estimated Liability Best estimated liability is measured as the sum of the expected present value of the future cash outflow minus future cash inflow that will incur as the insurer fulfils the insurance contract, adjusted for the effects of uncertainty about the amount and 7.
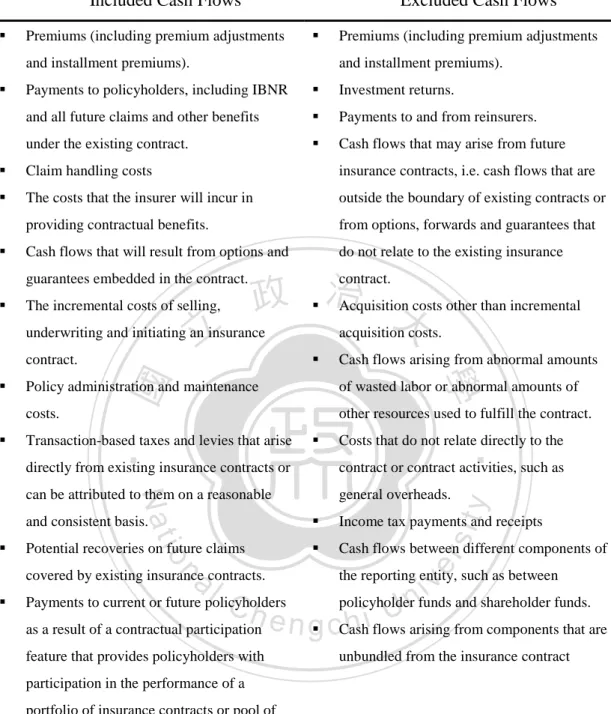
(17) timing of those future cash flows. The present value of the future cash flow is constituted of: (i) an explicit, unbiased and probability-weighted estimate (i.e. expected value) of the future cash outflows less the future cash inflows that will arise as the insurer fulfils the insurance contract and (ii) a discount rate that adjusts those cash flows for the time value of money. IFRS4 define these two components as follows. Fulfillment Cash Flow IFRS4 requires the insurer's to estimate their cash flows under portfolio size and. 政 治 大. the cash flows should include incremental cash inflows and cash outflow arising from. 立. that portfolio. The cash flows should:. ‧ 國. 學. (i) Be explicit (i.e. separate from estimates of discount rates that adjust those. ‧. cash flows for the time value of money and the risk adjustment that adjusts. sit. y. Nat. those cash flows for the effects of uncertainty about the amount and timing. io. er. of those future cash flows).. (ii) Reflect the perspective of the entity but, for market variables, be consistent. n. al. Ch. with observable market prices.. engchi. i n U. v. (iii) Incorporate, in an unbiased way, all available information about the amount, timing and uncertainty of all cash flows that will arise as the insurer fulfils the insurance contract. (iv) Be current (i.e. the estimates shall reflect all available information at the measurement date). (v) Include only those cash flows that arise from existing contracts IFRS4 also provides the information about which cash flow should be included 8.
(18) for the insurers. The cash flows that should be included or excluded are listed in table 2. IFRS4 requires insurer to include market variables such as interest rate into estimation. Therefore the insurer should distinguish between two types of variables: (i). Market variables: variables that can be observed in, or derived directly from, markets (such as publicly traded securities and interest rates).. (ii) Non- market variables: all other variables.. 政 治 大 prices or data. IFRS4 restricts insurer to substitute its own estimates for observed 立 Estimation of market variables should be consistent with observable market. market prices. For the estimation of non-market variables, the insurer should reflect. ‧ 國. 學. all the available data, both external and internal. Take mortality as an example,. ‧. because the mortality is a non-market variable, the insurer should consider its past. y. sit. io. n. al. er. estimation.. Nat. experience (i.e. internal data) and the market's experience (i.e. external data) for the. i n U. v. This is a tremendous change for reserve estimation. Nowadays the insurers. Ch. engchi. estimate their liabilities in fixed discount rate which is given from the issued date of the insurance contract. But after the adoption of IFRS4, the insurers can no longer set their discount rate fixed but should vary with the interest rate volatility since interest rate is the market variable which can be observed in the market.. 9.
(19) Table 2. Cash flows included or excluded. Included Cash Flows . Excluded Cash Flows. Premiums (including premium adjustments. . and installment premiums). . Premiums (including premium adjustments and installment premiums).. Payments to policyholders, including IBNR. . Investment returns.. and all future claims and other benefits. . Payments to and from reinsurers.. under the existing contract.. . Cash flows that may arise from future. . Claim handling costs. insurance contracts, i.e. cash flows that are. . The costs that the insurer will incur in. outside the boundary of existing contracts or. providing contractual benefits.. from options, forwards and guarantees that. Cash flows that will result from options and. do not relate to the existing insurance. guarantees embedded in the contract.. contract.. . The incremental costs of selling,. 立. underwriting and initiating an insurance. Policy administration and maintenance. of wasted labor or abnormal amounts of. costs.. other resources used to fulfill the contract.. Transaction-based taxes and levies that arise. Costs that do not relate directly to the. can be attributed to them on a reasonable. general overheads.. y. contract or contract activities, such as. . Income tax payments and receipts. Potential recoveries on future claims. . Cash flows between different components of. io. and consistent basis.. n. al. covered by existing insurance contracts. . . directly from existing insurance contracts or. Nat. . Cash flows arising from abnormal amounts. ‧. . . 學. . acquisition costs.. ‧ 國. contract.. Acquisition costs other than incremental. Ch. v. the reporting entity, such as between. Payments to current or future policyholders as a result of a contractual participation. sit. . 政 治 大. er. . i n U. policyholder funds and shareholder funds.. e n g cCash h iflows arising from components that are. feature that provides policyholders with. unbundled from the insurance contract. participation in the performance of a portfolio of insurance contracts or pool of assets. Data resource: IFRS4 Exposure Draft, July 2010.. Discount Rate IFRS4 suggests that the insurers should adjust future cash flows for the time value of the money by using discount that are consistent with observable current 10.
(20) market prices for instruments with cash flows which have characteristics reflect those of the insurance contract liability, such as timing, currency and liquidity. Also, the discount rate has to exclude any factors that are not related to the insurance liability but still have the influence on the observed rate. If the cash flow of an insurance contract does not depend on the performance of specific assets, the discount rate should reflect the yield curve in the appropriate currency. Moreover the yield curve should includes no credit risk, but with an adjustment for illiquidity. Such as if we take the yield to maturity of the one-year corporate bond as the one-year spot. 政 治 大. rate for the discount rate, we should exclude - even if it is hard to distinguish - the. 立. credit premium of the yield.. ‧ 國. 學. And for illiquidity, the insurer should not estimate the liability's illiquidity from instruments with different liquidity characteristics. For example, some government. ‧. bonds are traded in deep and liquid markets and the holder can sell them at any time. y. Nat. io. sit. without significant costs. In contrast, policyholders cannot transfer their contract. n. al. er. without any significant costs, and in some cases they have no contractual right to. i n U. v. transfer their holding at all. Thus, in estimating discount rates for an insurance. Ch. engchi. contract, an insurer should take account of any differences between the liquidity characteristics of the instruments underlying the rates observed in the market and the liquidity characteristics of the insurance contract. The problem here is that many insurance liabilities do not have the same liquidity characteristics as asset traded in financial markets, this makes the liquidity characteristics (or the liquidity premium) hard to estimate by current financial markets. Since the IFRS4 does not provide any specific calculation methods for liquidity premium, we will discuss this part in the QIS5 section. 11.
(21) And for the last, the estimations of cash flows and discount rates should be internally consistent to avoid double-counting or omissions. For example, nominal cash flows (i.e. those that include the effect of inflation) should be discounted at rates that include the effect of inflation. Real cash flows (i.e. those that exclude the effect of inflation) should be discounted at rates that exclude the effect of inflation. In next subsection we will discuss the measurement of uncertainty in IFRS4. (c) Risk Adjustment IFRS4 defines the Risk Adjustment (RA) as the maximum amount the insurer. 政 治 大. would rationally pay to be relieved of the risk that the ultimate fulfillment cash flows. 立. exceed those expected. The risk adjustment should convey information to users of. ‧ 國. 學. financial statements about the effects of uncertainty about the amount and timing of the cash flows arising from an insurance contract.. ‧. sit. y. Nat. The insurer should estimate the risk adjustment at the level of a portfolio of. io. er. insurance contracts in order to reflect the effects of diversification between portfolios of insurance contracts. Notice that the risk adjustment should not reflect risks that are. al. n. v i n not generated from the insuranceCcontract such as investment h e n g c h i U risk.. Risk adjustment should be included in the measurement in an explicit way, which means that the risk adjustment is separate from estimates of cash flows and discount rate. IFRS4 suggests the risk adjustment should have following characteristics to reflect the insurer's uncertainty: (i) Risks with low frequency and high severity will result in higher risk adjustments than risks with high frequency and low severity. 12.
(22) (ii) For similar risks, contracts with a longer duration will result in higher risk adjustments than those of a shorter duration. (iii) Risks with a wide probability distribution will result in higher risk adjustments than those risks with a narrower distribution. (iv) The less that is known about the current estimate and its trend, the higher the risk adjustment shall be. (v) To the extent that emerging experience reduces uncertainty, risk adjustments will decrease and vice versa. 政 治 大. For estimating the risk adjustment, IFRS4 restricts the insurer can only use the. 立. (i) Confidence level.. 學. ‧ 國. following techniques:. (ii) Conditional tail expectation.. Nat. sit. y. ‧. (iii) Cost of capital.. io. er. Several regulations have already used cost of capital as the measurement of estimating expected loss, such as Solvency II and Swiss Solvency Test. Also IFRS4. al. n. v i n C hand the conditionalUtail expectation are only considers that the confidence level engchi suitable when the probability distribution of the loss is consistent with the. assumptions. We therefore choose the cost of capital for estimating the risk adjustment. IFRS4 suggests that the insurer applies a cost of capital technique as follows: (i). First, the insurer derives an estimated probability distribution for the cash flows;. (ii) Secondly, the insurer sets a confidence level from that distribution. That 13.
(23) confidence level is intended to provide a high degree of certainty that the insurer will be able to fulfill its obligations under existing insurance contracts. The difference between the amount at that confidence level and the expected value (i.e. mean) of claims for the entire probability distribution indicates a capital amount that corresponds to the high degree of certainty that the insurer will be able to fulfill its obligations under the portfolio of existing insurance contracts, ignoring any risk factors not related to those contracts;. 政 治 大 the form of an appropriate annual rate, to that capital over the lifetime of 立. (iii) Lastly, the insurer estimates the risk adjustment by applying a factor, in. the contract, and making a further adjustment for the time value of. ‧ 國. 學. money because the capital will be held in future periods.. ‧. Capital rate is the key element in cost of capital techniques. IFRS4 suggests that. sit. y. Nat. the capital rate should reflect the risks that are relevant to the liability, but not reflect. n. al. er. io. risks that are not relevant to the liability. IFRS4 gives us an example that supposes. i n U. v. investors require an 18% return for investing in an insurer, including 4% of risk-free. Ch. engchi. rate, 2% of asset risk, 1% of asset-liability mismatching risk and 3% uncertainty about future business. The true capital rate should be the required investment rate less the unrelated parts, which is 18% - (4%+2%+1%+3%) = 8%. Although IFRS4 gives us a specific example for the determination of cost of capital, it is still hard to distinguish the positions between each risk rates (such as asset risk and asset liability mismatching risk). We therefore refer to Solvency II for more specific guides in cost of capital, which will be mentioned in QIS5 subsection.. 14.
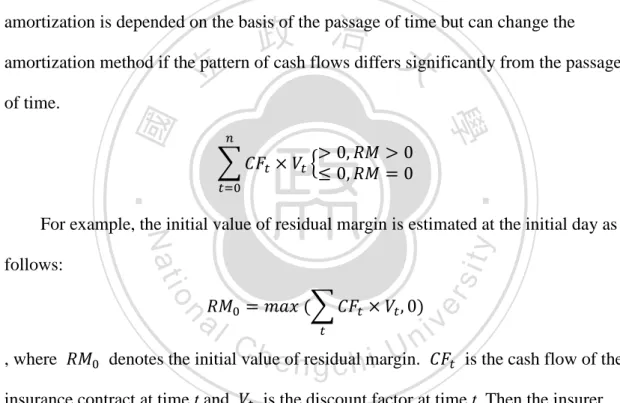
(24) (d) Residual Margin IFRS4 requires that the insurer should not recognize day-one gain. If the insurer's present value of expected cash inflows is less than the present value of expected cash outflows at the initial day (i.e. the net present value of the insurance contract is negative), the insurer should recognize day-one loss. Contrary if the insurer's present value of expected cash flows is greater than zero, instead of recognizing it as day-one gain, the insurer should recognize it as the Residual Margin (RM). The insurer should amortize the residual margin in a systematic way over the coverage period. The. 政 治 大 amortization method if the pattern of cash flows differs significantly from the passage 立. amortization is depended on the basis of the passage of time but can change the. of time.. ‧. ‧ 國. 學 sit. io. n. al. er. follows:. y. Nat. For example, the initial value of residual margin is estimated at the initial day as. , where. Ch. engchi. i n U. denotes the initial value of residual margin.. insurance contract at time t and should amortize. v. is the cash flow of the. is the discount factor at time t. Then the insurer. over the cover period, we assume that the insurer amortizes it. equally propositional through each year and the policy year is 20 years. The residual margin should be amortized as in figure. 1: t=0. 1. 2. …. 19. 20 0. Figure 1. The amortization example for residual margin 15.
(25) Notice that in the final year, the residual margin should be zero. 2.2 Quantitative Impact Study 52 Since we review IFRS4 in previous subsector, which provides comprehensive definitions for the measurement of liabilities, we still need more specific information for estimating liabilities, especially for the techniques and parameters. QIS5 is published by the Committee of European Insurance and Occupational Pensions Supervisors (CEIOPS). It is used to determine the Solvency Capital Requirement (SCR) for the Solvency II users. The concept of SCR and reserve are. 政 治 大. quite close. They are both regulated to ensure that insurer has sufficient capital to pay. 立. the future claims. We can therefore refer to the techniques that QIS5 uses to estimate. ‧ 國. 學. SCR.. ‧. Similarly QIS5 divides SCR into two components: the best estimation and the. io. al. n. (a) Best Estimation. er. explain the methods used to estimate these two components.. sit. y. Nat. risk margin. We summarize these two components in following subsections and. Ch. engchi. i n U. v. QIS5 defines best estimation as the probability weighted average of future cash-flows taking account of the time value of money. The best estimated is defined as the average of the outcomes of all possible scenarios, weighted according to their respective probabilities. Two key elements for calculating the best estimated are cash flows and discount rate. QIS5 suggests that the cash flows should be estimated gross. The gross cash inflows in QIS5 include future premiums and receivables for salvage. 2. Some of the descriptions in this subsection are referred to QIS5 Technical Specification/QIS5 Annex /QIS5 Technical Specification Errata, Sept. 27 2010 16.
(26) and subrogation, exclude the investment return. And the gross cash outflows include benefits and expenses. Since cash flows are already specifically defined in the IFRS4 section, we therefore focus on the discount rate definition of QIS5. QIS5 suggests that the discount rates for insurance liabilities should be the risk-free rate with liquidity premium to reflect the illiquidity characteristics of insurance liabilities. For the long-term characteristic of the insurance liabilities, QIS5 suggests that the insurer should establish a yield curve that can reflect the whole period of the. 政 治 大. insurer's pool. For the specification of the relevant risk-free interest rate term. 立. structures macroeconomic extrapolation techniques are used to derive the. ‧ 國. 學. extrapolation beyond the last available data point (which is 20 years interest rate in Taiwan). This requires specification of the following:. ‧. Determination of the ultimate forward rate.. sit. y. Nat. (i). io. the unconditional forward rate.. n. al. Ch. engchi. er. (ii) Interpolation method between the last observable liquid forward rate and. i n U. v. After determine the UFR and method, the insurer should follow the steps of: (i). Calculation of the non-extrapolated part of the curve, prior to adjustment;. (ii) Adjustment of the non-extrapolated part of the curve. (iii) Calculation of the illiquidity premium. (iv) Extrapolation of the interest rate term structure This gives insurer a 100 years yield curve which is suitable for its long-term characteristic of insurer's liability. But in our simulation we only assume the insurer's activities for 20 years. We therefore need not to extrapolate a yield curve for 100 17.
(27) years since there exists market data for interest rate in 20 years. Our primary concern here is therefore the method for calculation of the illiquidity premium. QIS5 provides four methods for estimating liquidity premium: (i). CDS method.. (ii) Structural model method. (iii) Covered bond spread method. (iv) Proxy method.. 政 治 大 with better liquidity in local financial market. The spread between these two assets 立. The concept of these methods is to find an asset with less liquidity and an asset. reflects the illiquidity of the market. For different countries, QIS5 also provides how. ‧ 國. 學. ‧. CDS method. sit. Nat. country's market status. Next we introduce these four methods.. y. much percentage of liquidity premium should takes into account to reflect the. n. al. er. io. The CDS method considers the negative CDS spread, which is the spread. i n U. v. between CDS price and corporate bond spread. Corporate bond spread is the yield of. Ch. engchi. the corporate bond minus the yield of the government bond. We can express as follows:. This method is based on the better liquidity of CDS in foreign markets. The yield of the corporate bond is compensated more because its illiquidity. The spread between these two assets can therefore be defined as the difference between liquidity and illiquidity asset.. 18.
(28) The advantage of this method is the convenience in calculation. Since CDS are frequently traded in foreign market, it is easy to find market price for CDS. But in Taiwan, CDS is neither traded nor issued in the market. Even if we take foreign market as the basis of estimation, the spread may include the risk of exchange rate. It is therefore impractical to use such method for estimating liquidity premium in Taiwan. Structural model method Structural model method uses the difference between the Merton model. 政 治 大 premium. The Merton model 立expresses the corporate bond price, which denotes in B, corporate bond price and the actual corporate bond price to estimate the liquidity. ‧. ‧ 國. follows:. 學. as the difference between the asset and the shareholder's equity of the company as. sit. al. er. io. company,. y. Nat. , where V denotes the asset value of the company, K is the liability value of the. n. v i n C h from Merton model The corporate bond price equation reflects the expected loss engchi U. and credit risk (probability of default), we therefore can use the spread between the model's theoretical price and the actual price of the corporate bond to estimate the liquidity premium. This method is limited by the estimation of parameter . Since price significantly, the calibration of. affects the. is not easy. Moreover, unpublished company. cannot be estimated by this method. There are only a few of life insurers in Taiwan that is published. It is therefore impractical to use such method for estimating liquidity 19.
(29) premium in Taiwan either. Covered bond spread method Covered bond spread method is to estimate the liquidity premium by the spread between the covered bond and financial instruments with more liquidity. This method is based that covered bonds is almost risk-free in credit risk since it has collaterals. QIS5 suggests that it is reasonable to estimate the liquidity premium by comparing the yield between covered bonds and IRS, since the IRS has lower credit risk and better liquidity.. 政 治 大. This method is not in the consideration because there is no covered bond market. 立. in Taiwan. It is therefore impractical to use such method for estimating liquidity. ‧ 國. 學. premium in Taiwan unless we can find an asset that has similar characteristics with the covered bond.. ‧ sit. y. Nat. Proxy method. io. er. Proxy Method is the primary method for QIS5 in estimation of the liquidity premium. The equation of liquidity premium is expressed as follows:. n. al. Ch. engchi. i n U. v. QIS5 considers that the components of the corporate spread includes cost of expected loss, credit risk and liquidity premium. We can therefore estimate the liquidity premium by dividing the corporate spread. The parameter. is represented. for the expected loss. QIS5 assumes that after corporate spread minus the cost of expected loss , the while. proportion in the remained spread is liquidity premium. proportion is credit premium. QIS5 assumes. .. 20.
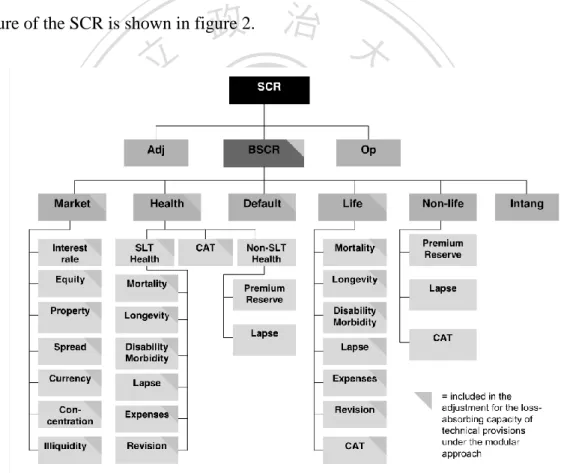
(30) (b) Risk Margin QIS5 suggests that the risk margin should be calculated by determining the cost of providing an amount of eligible own funds equal to the SCR necessary to support the insurance and reinsurance obligations over the lifetime thereof. The rate used in the determination of the cost of providing that amount of eligible own funds is called cost of capital rate. QIS5 calculated risk margin based on the SCR of the whole portfolio in the insurance company includes the insurance contract and reinsurance contract. The. 政 治 大. structure of the SCR is shown in figure 2.. 立. ‧. ‧ 國. 學. n. er. io. sit. y. Nat. al. Ch. engchi. i n U. v. Figure 2. Structure of SCR The SCR of each product lines is estimated as follows:. 21.
(31) Then the risk margin is estimated as:. 立. 政 治 大. ‧ 國. 學. For the estimation of the cost of capital rate, QIS5 Calibration paper follows. ‧. Estimate the equity risk premium.. y. Nat. (i). sit. three steps:. io. (iii) Calibrate it by the market price.. n. al. Ch. engchi. er. (ii) Adjust the equity risk premium.. i n U. v. QIS5 follows these three steps and suggests that the cost of capital rate should be set greater than 6%. 2.3 Fair Value Reserve Estimation Since IFRS4 provides a comprehensive definition of fair value liability along with its components and QIS5 gives techniques for the parameters estimation, we need more specific information for the parameters of fair value reserve estimation. We need the assumptions for liquidity premium and cost of capital.. 22.
(32) We adopt the research report of Hsieh, Tsai, and Kuo (2010)3, which provides a feasible method for Life insurers in Taiwan under the structure of IFRS4 and QIS5. Hsieh et al. (2010) propose that the fair value reserve should include three basic components according to IFRS4:. , where. is the best estimated liability of insurance contracts at time t.. the risk adjustment at time t and. is. denotes the residual margin at time t. Each. component is defined as follows:. 政 治 大 立should be based on the expected cash flows which are. (a) The estimation of. ‧ 國. 學. marked to market, calculated by the actuarial assumptions of the product and insurer's past experiences. Then the expected cash flows should be discounted at a proper yield. ‧. curve.. n. year t is expresses as:. er. io. sit. y. Nat. al. , where n is the policy year and. i n U. v. denotes the ith discount factor. The cash flow of. Ch. engchi. Hsieh et al. (2010) fit the yield curve by Smith and Wilson model4, provides a. 3. 謝明華、蔡政憲、郭維裕,壽險業準備金評估方法之國際發展趨勢研究,行政院金融監督管理. 委員會九十九年度委託研究計畫,2010 年。 4. Smith A. & Wilson, T., 2001, Fitting Yield Curves with Long Term Constraints, Research Notes, Bacon and Woodrow.. 23.
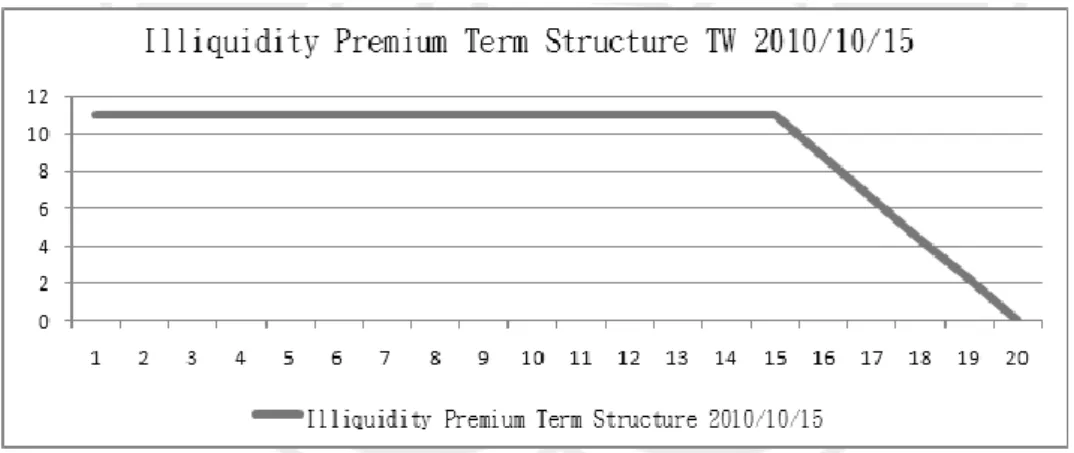
(33) yield curve of 100 years for Taiwan's life insurers. As we mention in previous sections, it is not necessary for us to use a yield curve with 100 years since we only simulate the insurer's financial statement for 20 years. We therefore only adopt the liquidity premium estimated of the report in our simulation. Hsieh et al. (2010) estimate the liquidity premium by CDS method, Covered bond spread method and Proxy method. The result is shown in figure 3. 政 治 大. 立. ‧. ‧ 國. 學. Figure. 3 The liquidity premium curve in different methods. Nat. io. sit. y. Resource: Hsieh et al. (2010). n. al. er. Hsieh et al.(2010) suggest that the CDS method and the Covered bond spread. i n U. v. method is not appropriate for the life insurers in Taiwan. Hsieh et al. (2010) use the. Ch. engchi. Proxy method to establish the liquidity premium which is shown in figure 4. And the numerical data is shown in table 3. (b) Hsieh et al. suggest that the risk adjustment could be calculated by SCR and the Insurer should estimate SCR by RBC regulation since current Taiwan supervisory regulation is established based on RBC. Hsieh et al. (2010) suggest that the insurer. 24.
(34) Figure 4. The liquidity premium term structure for Taiwan Resource: Hsieh et al. (2010). 政 治 大. Table 3. The adjusted liquidity premium (100%) for 20 Years. 0.110% 0.110% 0.110% 0.110% 0.110% 0.110%. 15 16 17 18 19 20. n. al. Ch. engchi. 0.110% 0.110% 0.110% 0.110%. y. 11 12 13 14. 0.110% 0.088% 0.066% 0.044% 0.022% 0.000%. sit. ‧ 國. io. 0.110% 0.110% 0.110% 0.110%. ‧. Nat. 5 6 7 8 9 10. Liquidity Premium. Adjusted Liquidity Premium. 學. 1 2 3 4. Maturity. er. 立 Adjusted. Maturity. i n U. v. Resource: Hsieh et al. (2010). should estimate the Solvency Capital Required for each year t based on C2 (Insurance risk) and C4 (Business risk):. And the risk adjustment at year t is expressed as the combination of SCR and cost of capital rate:. 25.
(35) Hsieh et al. (2010) test several kinds of policy then provide an approximate way for estimating C2 and C4 of each insurance product. For the endowment, Hsieh et al. (2010) suggest that C2 of the endowment should be estimated as 0.30% of the death benefit, and C4 of the endowment should be estimated as 1.0% of the premium received. Hsieh et al. (2010) also provides a cost of capital for life insurers in Taiwan, which is given as 6%. We therefore adopt these parameters to estimate the fair value of reserve.. 立. (c). 政 治 大. ‧ 國. 學. Hsieh et al. (2010) suggests the residual margin should be amortized by the expected claimed paid of each year t. The insurers should amortize the residual. ‧. margin by four steps:. y. Nat. io. (ii) Calculate the present value of the claim paid. n. al. .. sit. Calculate the initial residual margin. .. er. (i). i n U. v. (iii) Calculate the ratio of the residual margin should be amortized for each year t by. Ch. e. n g c h i. (iv) The residual margin of each year t is therefore: 3.. .. Simulation This section is divided into four parts: the first part is how we simulate the. market asset prices, including interest model and stock price model. The second part exhibits the policy specifications, including cash flow of the policy, policy assumptions. The third part is the policy reserve and the reserve duration. The fourth 26.
(36) part we describe the two investment strategies of the insurers while in the last part we introduce the insurer's activities at each year step by step. 3.1 The Investment Markets In this part we introduce the stochastic models used to simulate asset prices and insurance activities. For simplicity, we assume that the insurers can only invest in two kinds of assets: stock and bond, which are independent to each other. The years to maturity of bonds range from 1 to 20 years. The insurer is therefore able to invest in 21 kinds of. 政 治 大 denote the differentials 立 of two-dimension Wiener processes including. securities in the market. Let. ‧. ‧ 國. 學. the processes of the one-year spot rate(r) and the return of the stock index(S):. We assume that there is no correlation between these two processes.. sit. y. Nat. io. er. (a) Interest Rate Model and Bond Markets. We choose the CIR model to simulate short term interest rate. The CIR model is. al. n. v i n C hthe volatility of theUshort rate is partially related to a mean-reverting process in which engchi. the square root of the short rate. The discrete CIR model assumes the one-year interest rate (r) follows the stochastic process:. , where reversion,. is the short rate at time t (t≧0),. reflects the speed of the mean. represents the long-term level of the short rate and. denotes the. volatility of the short rate, which we assume constant. Notice that the discrete-time CIR model may generate some negative short rates, 27.
(37) which may not happen in real interest rate market. In this case we take. at. each time t to avoid generating negative interest rate. After we have the interest rate for each time t, next we generate the price of zero-coupon bonds with maturity ranged from 1 to 20 years. According to Cox et al. (1985), a $1 face value zero-coupon bond at time t with maturity T is priced as. , where. 立. and. , 治 政 大. ,. ;. ‧ 國. 學. (b) Stock markets. We assume that the dynamic of stock price follows geometric Brownian motion. ‧. io. sit. y. Nat , where dS denotes the change in stock price,. al. is the stock price expected rate of. v i n denotes the volatilityC of the stock index return, h e n g c h i U which is constant along the n. return.. er. as follow:. simulation period.. Notice that we do not add any interest-rate-adjusted effect in the stock price process. We intend to eliminate the interest rate sensitivity of stocks to avoid that the position of stocks may affect the portfolio duration. 3.2 Policy's Specifications In this part we introduce the policy's specifications in this simulation, including the cash flows of each year and the assumptions. For simplicity, we only use a 28.
(38) twenty-year endowment product as the analyzed policy. We assume that the insurer sells the policy only to a fixed number population and the entire insurer's cash flow is generated from this endowment pool during the simulation period. The simulation's length is 20 years, we therefore assume the covered period of the endowment to be 20 years. The insured age is set at 30 before the simulation begins. (a) Cash Flow of a Twenty-Year Endowment Policy We assume that the commission, expense and expected premium are assumed to be received or paid out at the beginning of the year while the death benefit and. 政 治 大 for the policy at the beginning 立of its policy year t after the nth premium has been. surrender value are incurred at the end of the year. The expected cash flow at time t. ‧ 國. 學. collected with the nth expenses and commission have been paid out, where and. , is defined as:. ‧ er. io. sit. y. Nat. is the probability that the policy for the insured with age. al. v i n remains valid at theCbeginning of year t (i.e. h e n g c h i U probability n. , where. surrender rate).. is adjusted by. is the probability of the insured with age. dying within 1 year, DB denotes the death benefits paid at the end of the year while Pre denotes the premium received at the beginning of each surviving year, which are constant during the policy years. year t,. is the surrender rate of the policy in. denotes the surrender value paid at the end of policy year. .. is the commission rate for the commission paid at the beginning of the year , and. represents the fixed expense paid at the beginning of the year stands the variable expense rate. 29.
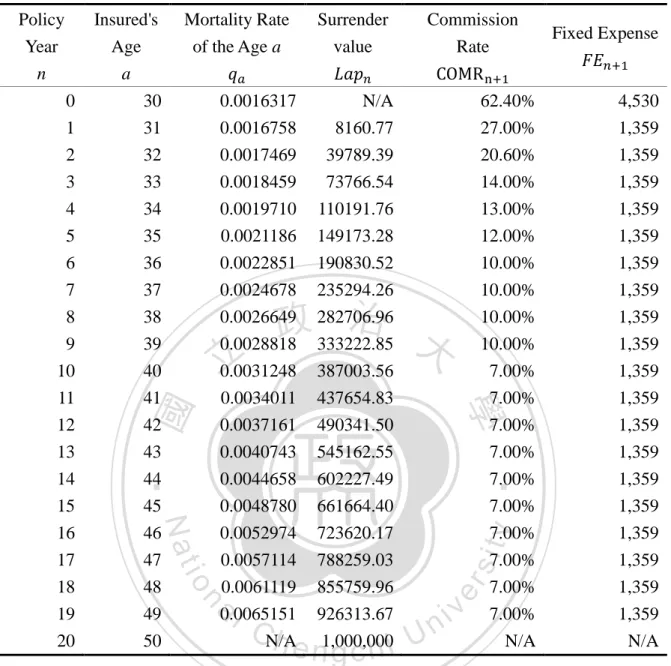
(39) The first bracket of the equation is the expected death benefit and surrender value paid at the end of each policy year n. The expected death benefit and surrender value paid out equals the death benefit DB, which is fixed during the policy years, times the conditional probability that the policy is valid for the insured dies in this year (. years (. ) and then. . So similarly the expected surrender value. is the surrender value paid at the end of policy year. (. probability that the policy is valid for. ) and then surrender at. years (. ) times the. this year ( ). The second bracket represents the net premium (i.e. expected premium. 政 治 大 year n, and the expected net premium is the net premium 立. deduct expected expense and commission) received at the beginning of each policy. the end of the year. 學. ‧ 國. times the probability that the insured will survive at. .. ‧. At the beginning of the last year of the policy years, no more premiums will be. sit. y. Nat. received because the insured has paid all of the twenty premiums. Neither the. n. al. er. io. commissions nor the variable expense are paid at this time, instead the insurer should. i n U. v. pay the survival benefit. The expected cash flow is therefore adjusted as follow:. Ch. engchi. (b) Policy assumptions The assumptions of the variables we use in the policy cash flow estimation are shown in Table 4. 3.3 Reserves (a) Policy reserves The policy reserve at policy year n is estimated as present value of the expected 30.
(40) Table 4. Assumptions about the endowment product Insured's Age a. Mortality Rate of the Age a. Surrender value. Commission Rate. Fixed Expense. 0 1 2 3 4 5. 30 31 32 33 34 35. 0.0016317 0.0016758 0.0017469 0.0018459 0.0019710 0.0021186. N/A 8160.77 39789.39 73766.54 110191.76 149173.28. 62.40% 27.00% 20.60% 14.00% 13.00% 12.00%. 4,530 1,359 1,359 1,359 1,359 1,359. 6 7 8 9 10 11 12 13 14 15. 36 37 38 39 40 41 42 43 44 45. 0.0022851 0.0024678 0.0026649 0.0028818 0.0031248 0.0034011 0.0037161 0.0040743 0.0044658 0.0048780. 190830.52 235294.26 282706.96 333222.85 387003.56 437654.83 490341.50 545162.55 602227.49 661664.40. 10.00% 10.00% 10.00% 10.00% 7.00% 7.00% 7.00% 7.00% 7.00% 7.00%. 1,359 1,359 1,359 1,359 1,359 1,359 1,359 1,359 1,359 1,359. 0.0052974 0.0057114 0.0061119 0.0065151 N/A. 723620.17 788259.03 855759.96 926313.67 1,000,000. y. Policy Year n. 1,359 1,359 1,359 1,359 N/A. Ch. engchi. 7.00% 7.00% 7.00% 7.00% N/A. sit er. ‧ 國. n. al. ‧. io. 46 47 48 49 50. 學. Nat. 16 17 18 19 20. 立. 政 治 大. i n U. v. net cash out flow, which is calculated after the nth premium, which can be expressed as:. , where. represents the present value of the expected liability along the policy. 31.
(41) years,. denotes the discount factor for the expected net cash flow at time t.. Negative. represents that the insurer's aggregate expected. cash flow is negative and the insurer should prepare the same amount of capital for future claimed, which means the policy reserve. . Contrarily, positive net present. value means the insurer should not prepare such amount of capital since current regulation do not allow negative reserve value. We take Book value reserve. as zero in this case.. 政 治 大. The main difference between book value reserve and fair value reserve is the. 立. discount rate used. For the discount factor. , the discount rate of each time t remains. ‧ 國. 學. fixed under book value reserving method. The book value policy reserve's discount factor of time t, denoted as. , is therefore expressed as:. al. sit er. io. Fair value reserve. y. ‧. Nat. , where r is the given discount rate of the policy.. n. v i n C hin fair value, the discount If we estimate policy reserves rate of each time t has to engchi U. be consistent with the interest rate market. In previous section we simulate the process of the one-year rate. Since the expected cash flow is measured annually, the discount factor of the fair value policy reserve. , where. is therefore expressed as. is the one year rate of year i, plus the liquidity premium mentioned in. previous section.. 32.
(42) (b) Reserve Duration According to Fabozzi (1998), we take the modified duration as the measurement of interest rate sensitivity. We assume that the insurers with ALM allocate their asset in order to match their asset duration with liability duration, which is also known as reserve duration. The reserve duration at the policy year n, which is denoted as. , is calculated. as follows:. Similar to reserve estimation, the discount factor ) or market one year rate (. io. sit. .. 3.4 Investment Strategy. . The duration calculated in variable. y. Nat. discount rate as. ). For consistent, we denote the. ‧. duration calculated in fixed discount rate as. can be calculated in fixed. al. er. discount rate (. 學. ‧ 國. 政 治 大 , where t is the time that the立 expected cash flow incurs.. n. v i n The insurers allocate their C assets by their investment h e n g c h i U strategy. We assume that the. there are two investment strategies for the insurers: The first one is buy-and-hold. strategy, which assume the insurers simply allocate their capital on the financial assets in a given weighted. They do not change weighted or manage the interest risk during the simulation period. The second strategy assumes the insurers manage their capital by duration matching. They estimate the liability duration in the beginning of every period, allocate their assets in proper position to match the duration of the asset and the 33.
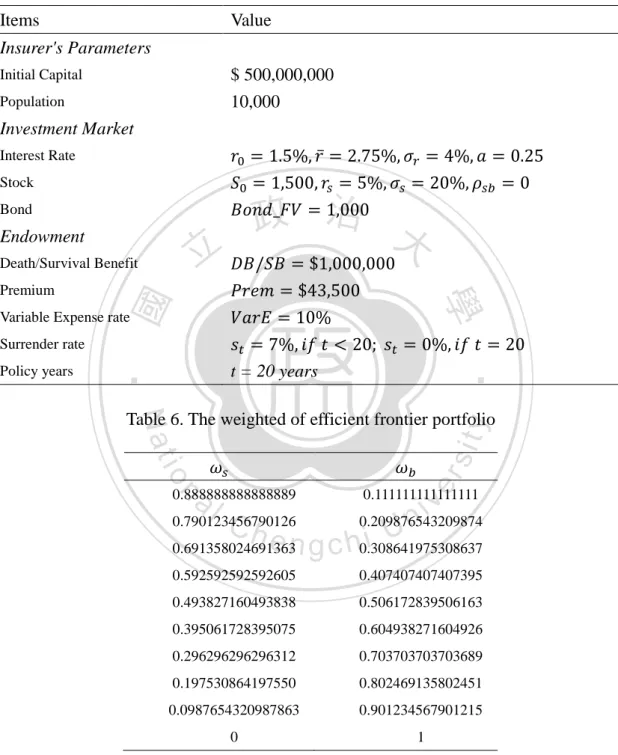
(43) liability. This strategy is strongly focused on eliminating the interest risk of insurer's liabilities. In this section we introduce these two strategies in detail, including the assumptions and the method used for duration matching simulation. (a) Buy-and-Hold Strategy This strategy represents the insurers who do not want to eliminate their interest rate risk. The insurer under this strategy purchases financial assets in fixed weighted every year regardless of any interest rate volatility.. 政 治 大. We assume that the insurers decide their weighted by Markowitz efficient. 立. frontier5. Since there are only two assets with no dependence to each other and there. ‧ 國. 學. is no risk-free asset in the financial market, the optimization formula is expressed as follows:. ‧. n. al. represents the weighted of stocks and. zero-coupon bonds.. Ch. engchi. er. io. sit. y. Nat. , where. i n U. v. represents the weighted of. denotes the volatility of the stock price and. volatility of the bond price.. denotes the return of the stock price and. denotes the denotes the. return of the bond price. We can therefore have several sets of. which provide the minimum. portfolio variance. For there are zero-coupon bonds with maturity ranged from 1 to 20 years in bond market, we assume the insurer allocates equally in each kind of. 5. Markowitz, H.M. (March 1952). Portfolio Selection. The Journal of Finance 7 (1): 77–91. 34.
(44) zero-coupon bonds. The weighted matrix of the financial assets is therefore expresses as:. , where. denotes the weighted of zero-coupon bonds with one-year maturity. (which equals to. denotes the weighted of weighted of zero-coupon. ).. bonds with two-year maturity and so on. We have to distinguish the items of the financial assets on the balance sheet in. 政 治 大 strategy recognizes its asset position only as available-for-sell or hold-to-maturity. We 立 order to calculate the shareholder's equity. We assume that the insurer under this. then assume that the insurer recognizes its stock position, short-term zero-coupon. ‧ 國. 學. bond position and half of the long-term bond position as available-for-sale. Thus, the. ‧. insurer holds half of its long-term zero-coupon bond position as hold-to-maturity. sit. y. Nat. items. We define the long-term zero-coupon bonds is the zero-coupon bonds with. io. , the insurer will allocate. al. n. period t is. Ch. er. maturity greater than 10 years. For example, if the initial capital of the insurer in in stocks and. n U engchi. iv. in. the zero-coupon bonds with maturity i. The available-for-sell position will be:. And the hold-to-maturity position will be:. (b) Duration Matching Strategy Duration matching strategy is assumed to be used by the insurers with ALM. In 35.
(45) this strategy the insurer varies its asset position every period in order to match the liability duration. For simplicity we assume that the insurers under this strategy have no hold-to-maturity items. All the assets purchased will be used as hedge tools during the policy years, the insurer therefore recognize them as available-for-sale on the balance sheet. Under this strategy, the insurer estimates its liability duration in the beginning of every year t. After that the insurer finds an optimization solution to minimize the gap between asset duration and liability duration. We use the linear least-squares approach. 政 治 大. here, solve least-squares curve fitting problems of the form:. 立. ‧. ‧ 國. 學. n. al. is the upper bound of the. er. io. is the lower bound of the weighted and. sit. y. Nat. , where. i n U. v. weighted. These two parameters will be given before the simulation. Insufficient. Ch. engchi. restriction in this equation may leads to infinite solutions. We only choose the solution which varies portfolio positions the less. Notice that in order to compare the pure effect of the allocation, the stock weighted. is assumed to be consistent with the. buy-and-hold strategy. Under this assumption, the insurer will only vary their bond position, which ensures the only difference between these two strategies is the management of bond portfolio (i.e. the management of the interest risk). And the available-for-sell position under this strategy will be:. 36.
(46) 3.5 Insurer's Activities In this part we introduce the activities of the insurer step by step, and how does the activity affect the insurer's balance sheet. We divided each year t into two periods: beginning period and end period. Assume that all activities happen only at the beginning or the end of each policy year. At the beginning of each year t, the insurer receives premiums from the. 政 治 大. policyholders, simultaneously pays the commissions and the expenses. The insurer. 立. increases the reserve listed on the balance sheet accordingly, then makes an asset. ‧ 國. 學. allocation based on their investment strategy.. ‧. At the end of year t, the insurer renews the asset prices marked to the market (i.e.. sit. y. Nat. marked to the price of t+1). Then the insurer pays claims through selling the asset. io. er. proportionally and deducts the reserve. In follow subsections we describe detailed descriptions of each activity.. n. al. We denotes. Ch. i n U. v. e nasgthec value h i of asset, liability and. shareholder's equity on the insurer's balance sheet at the beginning of year t. And. ,. and. as the value of asset, liability and shareholder's equity. on the insurer's balance sheet at the end of year t. (a) At the Beginning Period The activities of the beginning period includes: collecting premium, paying expenses and commissions, increasing reserve and allocating capitals. At the beginning period, the insurer receives the net premium: 37.
(47) Then the insurer increases the reserve based on the premium already collected. =. at the beginning period.. The variation in reserve increases the liability value on the balance sheet:. Then the insurer allocates their capital (i.e. premium received) to the financial assets, which are bonds and stock, based on market price at year t. The initial capital. 政 治 大. of the insurer equals to the net premium:. 立. ‧ 國. 學. Then the insurer decides its asset position according to the investment strategy:. ‧ y. Nat. io. sit. is the weighted matrix for year t.. er. , where. The market price the insurer observes at the beginning of the year t is denoted as. n. al. follow:. , where. Ch. engchi. denotes the stock price at year t,. coupon bond with one-year maturity at year t,. i n U. v. denotes the price of zero the price of zero coupon bond. with two-year maturity at year t, etc. The insurer then purchases the market assets by the weighted and the market price:. 38.
(48) :. , where. is the volume of stocks purchased at the beginning period of year. 政 治 大 purchased at the beginning period of year, denotes the volume of zero 立. t,. denotes the volume of zero coupon bonds with one-year maturity. coupon bonds with two-year maturity purchased at the beginning period of year, etc.. ‧ 國. 學. Thus, after the beginning period of year t the insurer has the portfolio. ‧. of. , the asset value and the shareholder's equity value as follows:. n. er. io. sit. y. Nat. al. (b) At the Ending period. Ch. engchi. i n U. v. At the end of each period the insurer needs to sell the assets to pay the claim. The insurer also needs to change the reserve value on the balance sheet, repurchase bonds, reports balance sheet and recognizes profit and loss of the financial assets held. In the ending period, the insurer first receives free capital of one-year zero-coupon bonds which purchased in the beginning period. Then the maturity of the zero-coupon bonds is reduced by one year. The temporary position of the ending period is expressed as: 39.
(49) , where. is the temporary position of the ending period.. Then the insurer starts to recognize the profit and loss of year t. The market price observed at the end of the year t is the market price of year t+1. The profit and loss of the assets is the changes of market prices between the beginning and the ending period times the insurer's asset position, which can be expressed as:. 立. 政 治 大. Then the insurer recognizes the loss of the liability:. ‧. ‧ 國. 學. The total profit and loss is therefore:. n. er. io. sit. y. Nat. al. i n U. v. After recognizing the profit and loss, the insurer uses free capital received by. Ch. engchi. matured bonds to repurchase the bonds of the longest maturity, which is 20 years. Notice that the matured bonds are treated as available-for-sell items on the balance sheet. We therefore assume the repurchased bonds are treated as available-for-sell items. The new position of the 20 years zero-coupon bonds is:. , where. is the face value of zero-coupon bonds.. Then the insurer should sell the assets to pay the claims. We denotes the expected 40.
(50) claims at year t as. , which is expressed as:. or. This change the liability value in the balance sheet: =. at the ending period.. 政 治 大 allocation would not be affected 立 by paying claims. The insurer therefore sells assets Then we assume that the insurer sells their asset in proportions so that asset. , is defined as follows:. n. al. er. io. sit. y. Nat. The short position for each asset, denoted as. ‧. ‧ 國. 學. by the weighted:. Ch. engchi. i n U. v. But notice that the current position of 20 years zero-coupon bond is zero (Since the insurer just purchases it), we transfer the short position of 20 years zero-coupon bond to the shortest maturity bonds, which is 1 years zero-coupon bond. The short position for each asset is therefore adjusted as:. 41.
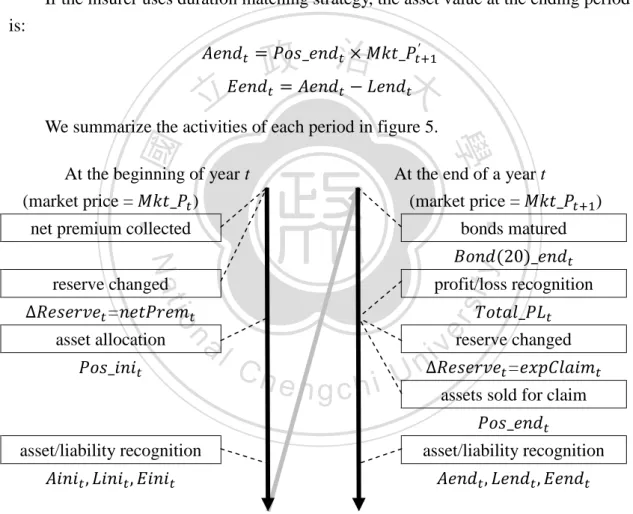
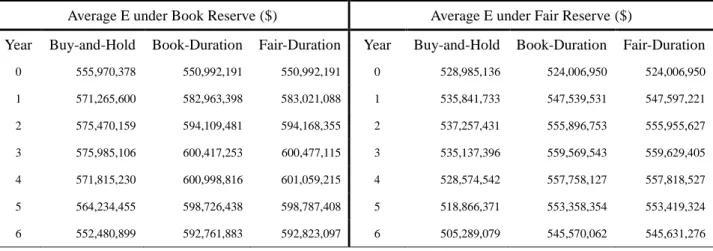
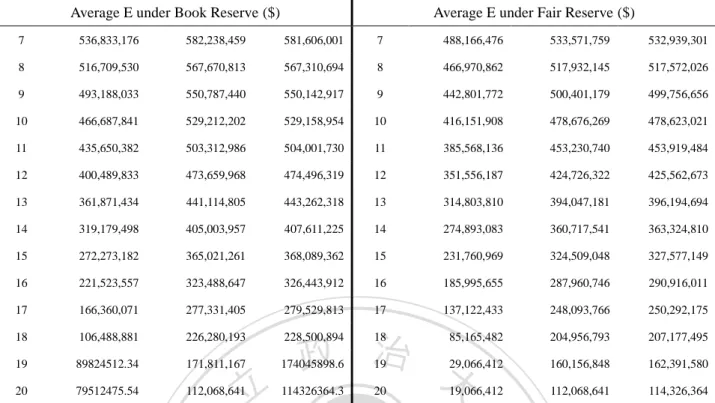
(51) This determines the final asset position of the insurer in the ending period:. Then if the insurer uses buy-and-hold strategy, the asset value is the position of available-for-sell items times the market price plus the amortized value of hold-to-maturity items. If the insurer uses duration matching strategy, the asset value at the ending period is:. 政 治 大. 立. At the beginning of year t ). At the end of a year t (market price =. ‧. (market price =. 學. ‧ 國. We summarize the activities of each period in figure 5.. net premium collected. bonds matured. y. Nat. n. al. er. io. asset allocation. profit/loss recognition. sit. reserve changed =. asset/liability recognition. ). Ch. engchi U. v reserve changed i n = assets sold for claim asset/liability recognition. Figure 5. Insurer's activities at each period 4.. Simulation Results In this section we present the results of our simulation. First we introduce the. parameters we use in the models which are mentioned in previous sections, and 42.
數據
+7
相關文件
Overseas applicants shall remit US$7 in cash for the first copy (applicants from Hong Kong and Macau shall remit US$6 in cash, including postage), and US$1 for
Overseas applicants shall remit US$7 in cash for the first copy (applicants from Hong Kong and Macau shall remit US$6 in cash, including postage), and US$1 for each additional
PS: The IPE Brent Crude futures contract is a deliverable contract based on EFP (Exchange of futures for physical ) delivery with an option to cash settle, i.e the IPE Brent
The TRG consists of two components: a basic component which is an annual recurrent cash grant provided to schools for the appointment of supply teachers to cover approved
Currency risk is the risk that the fair value or future cash flows of a financial instrument will fluctuate due to changes in currency exchange rates. The Fund’s
Currency risk is the risk that the fair value or future cash flows of a financial instrument will fluctuate due to changes in currency exchange rates. The Fund’s
Comparison of B2 auto with B2 150 x B1 100 constrains signal frequency dependence, independent of foreground projections If dust, expect little cross-correlation. If
In the first paragraph, how does the writer convince us that many people think the classroom of the future will be based on technology.. (A) She describes
