Application of Permutation Entropy and Statistical Complexity Measure in
Crude Oil Price Time Series
Wei-Shing Chen
*Sheng-Yu Chen
Department of Industrial Engineering & Technology Management
Da-Yeh University
168, University Rd., Dacuan, Changhua, 515, Taiwan
weishing@mail.dyu.edu.tw
Abstract
The extensive fluctuations in oil prices have vast impacts on economies. The economical instability may be observed for both oil-exporting and oil-importing countries due to high volatility of oil prices. Oil price data as a time series is a highly nonlinear system which exhibits complex patterns. Traditional oil time series analysis employs statistical methods to model and explain the oil data and predict future values of the oil price. The two objectives of this research include (1) discovering the deterministic and random pattern of oil price series by estimating the permutation entropy and forbidden patterns of Brent crude oil markets during the last decades (1990.08.02–2012.08.21), (2) monitoring crude oil market efficiency by computing SCM for finding an associated ranking of relative efficiency of oil spot series from 1990 to 2012. This ranking is quantifying the presence of hidden market efficiency behavior in the oil market. Permutation entropy, forbidden patterns and statistical complexity measure are calculated to quantify the degree of uncertainty and efficient behavior of Brent crude-oil markets for judging whether the oil price series is highly or lowly predictable. Research results show that volatility in the Brent oil price series have certain seasonal behavior and market efficient of Brent oil market is getting apparent after 2010. This phenomenon reveals the oil market is getting unpredictable from 2010.
Keywords: Permutation Entropy; Statistical Complexity Measure; Crude Oil Price Time Series
1. Introduction
The extensive fluctuations in oil prices have vast impacts on economies. The economical instability may be observed for both oil-exporting and oil-importing countries due to high volatility of oil prices. They have steadily risen from about 25 dollars a barrel in August 2003 to over 130 dollars a barrel in May 2008 and then dramatically dropped down during the crisis of 2008. Therefore, it is critical in crude oil market applications that the patterns relating to sudden oil price changes be identified. The problem of analyzing spot oil prices data is how to quantify the degree of uncertainty and efficient behavior of crude-oil markets in order to be able to determine whether the oil price series is highly or lowly predictable.
Oil price data as a time series is a highly nonlinear system which exhibits complex patterns (MOMENI and KOURAKIS 2010). The market depends and responds to the past in a non-trivial way. The volatility of oil futures price is a subject which has been studied extensively by researchers (Zhang, Lai et al. 2008; Liu and Liu 2010; Ortiz-Cruz, Rodriguez et al. 2012; Ruiz, Guillamón et al. 2012). Crude oil price is a commodity and changes in the real price of oil have historically tended to be permanent, difficult to predict, and governed by
very different regimes at different points in time (Hamilton 2008). Empirical studies have demonstrated that international oil price is a nonlinear dynamic system with chaotic and fractal feature, so that traditional statistical models are incompetent in accurate depiction of the underlying dynamics (Panas and Ninni 2000; Adrangi, Chatrath et al. 2001; Lin, Zhen et al. 2009; Gu, Chen et al. 2010; He and Chen 2010; MOMENI and KOURAKIS 2010). Fan and Xu (Fan and Xu 2011) separated the price fluctuations in the oil market after 2000 into three stages: “Relatively calm market” period (January 07, 2000, to March 12, 2004); the “Bubble accumulation” period (March 19, 2004, to June 06, 2008,); and the “Global economic crisis” period (June 13, 2008, to September 11, 2009). In (Zhang, Yu et al. 2009), an EMD-based event analysis approach is used to estimate the impact of extreme events on crude oil price. In (Charles and Darné 2009), Charles & Darné applied non-parametric variance ratio tests to test The weak-form efficient market hypothesis for two crude oil markets (UK Brent and US West Texas Intermediate) and found that the Brent crude oil market is weak-form efficiency while the WTI crude oil market seems to be inefficiency on the 1994–2008 sub-period, suggesting that the deregulation have not improved the efficiency on the WTI crude oil market in the sense of making returns less predictable.
Traditional oil time series analysis employs statistical methods to model and explain the oil data and predict future values of the oil price. It is not easy, however, to identify the volatility of the time series using these traditional methods. In this paper we examine the time series properties using an extended application of methodologies borrowed from physics disciplinary: permutation entropy and complexity measure to explore long and complex time series. Bandt and Pompe (Bandt and Pompe 2002) introduced the concept of permutation entropy for quantifying the uncertainty of a system behind a time series on the base of counting ordinal patterns, which describe the up-and-down in a time series, Ordinal symbolic dynamics is a promising new approach to the investigation of randomness of time series. A complexity measure, called generalized Statistical Complexity Measure (SCM), has been proposed to quantify not only randomness but also the presence of correlation structures (Rosso, Larrondo et al. 2008).
The two objectives of this research include (1) discovering the deterministic and random pattern of oil price series by estimating the permutation entropy and forbidden patterns of Brent crude oil markets during the last decades (1990.08.02–2012.08.21), (2) monitoring crude oil market efficiency by computing SCM for finding an associated ranking of relative efficiency of oil spot series from 1990 to 2012. This ranking is quantifying the presence of hidden market efficiency behavior in the oil market.
The paper is organized as follows. After presenting the problem statement, the concept of permutation entropy and SCM are introduced. In Sec 3, we apply the PE and forbidden pattern to detect volatility of Brent crude oil prices data and some of the conclusions from this research are given in Sec 4.
2. Permutation entropy and statistical complexity measures
The origin of ordinal time series analysis is from (Keller and Sinn 2005). The idea behind it is to transform a given time series into a series of ordinal patterns each describing the order relations between the present and a
fixed number of equidistant past values at a given time interval. Roughly speaking, a given time series is transformed into a series of order patterns (symbolic sequence) describing the ups and downs of the original series.
These time series were embedded to a m-dimensional space: Xt =[xt, xt+L ,...,x t+(m-1)L ], with m being the embedding dimension and L being the time lag. For all values of t the real values of Xt =[xt,xt+L,...,xt+(m-1)L ] were arranged in an increasing order: Xt =[xt+(j1-1)L ≤ xt+(j2-1)L≤ ... xt+(jm-1)L ], i.e. the amplitude values of sequences xi are reordered so that the amplitudes are arranged in an ascending order. For example, in the case of (x1 , x2 , x3 .x4 ), it is re-ordered as (x4 , x2 , x1 , x3 ), so that (x4 ≥ x 2 ≥ x 1 ≥ x 3 ) and the new temporal sequence would be (4, 2, 1, 3). Hence, each vector Xtis uniquely mapped onto π=[j1, j2, ... ,jm], where π is one of m! possible permutations of the vector [1,2,…,m]. For practical purposes, Bandt & Pompe recommended m = 3, .., 7. Increasing m may lead to memory restrictions due to the large number of m! possible permutations. Here, m=4 was chosen empirically. Larger values (m=5, 6, 7) didn’t reveal significant differences on visual investigation of the resulting PE profiles (Bandt and Pompe 2002).
If each of the m! Permutation is considered as a symbol, and then this procedure allows the mapping of the original continuous time series onto a symbolic sequence (Panas and Ninni 2000). The frequency of each possible permutation π, as obtained during the sorting process of all vectors Xt, was calculated as p (π). If the series has a random behavior, any permutation can appear, and no pattern is forbidden. If the series has a random behavior, any permutation can appear. Moreover, the probability distribution of the ordinal patterns should be uniform because any permutation has the same probability of appearance when the data set is long enough to exclude statistical fluctuations. Nevertheless, when the series corresponds to a chaotic underlying system, there are some patterns that cannot be found due to the underlying deterministic structure. They are the so-called forbidden patterns. The presence of forbidden patterns reveals an underlying deterministic behavior. It is worth mentioning that the occurrence of the forbidden patterns is inherent to its chaotic nature and even adding samples to the series will not reduce their number (Amigó and Kennel 2008; Zanin 2008; Zunino, Zanin et al. 2009).
Permutation entropy was calculated as H(m)=-Σp(π)lnp(π), where the sum runs over all m! permutations π of order m. As H(m) can maximally reach ln(m!), the permutation entropy was normalized as H(m)/ln(m!). Hence, possible values of PEnormare: 0 ≤ H(m)/ln(m!) ≤ 1. Permutation Entropy is a measure of regularity in the time series (Panas and Ninni 2000). The upper bound (i.e. H(m)=ln(m!)) is attained, when all m! possible permutations appear with the same probability. Instead, with increasing regularity (i.e. probabilities for different permutations π becoming more different from each other) H(m) decreases. Small values of m may not be able to reflect regularities of higher order.
Measurements of the deviation from randomness provide a tool to assess the degree of efficiency of a given market(Giglio, Matsushita et al. 2008). The concept of defining Statistical Complexity Measure (SCM), introduced by López-Ruiz, Mancini, and Calbet (LMC) also called as LMC complexity, is to combine disorder and disequilibrium into a single quantity which reflects on the interplay between the amount of information
stored in the system and its disequilibrium(Rosso, Larrondo et al. 2008). Disequilibrium expresses an idea of the probabilistic hierarchy of the system. Hence, Ref (Lopez-Ruiz, Mancin et al. 1995) defines the SCM to be the product of entropy and disequilibrium, shown as the follows:
(1)
In (2), the term Q[P] is disequilibrium representing some kind of distance D from the equilibrium distribution Pe of the accessible states of the system. Q[P] can be defined as
(2)
Where Q0is a normalization constant and 0 ≤ Q ≤ 1(Rosso, Larrondo et al. 2008). The disequilibrium Q would reflect on the systems “architecture”, being different from zero if there exist “privileged” or “more likely” states among the accessible ones, i.e. statistical complexity is around 0 when time series has regular pattern or it is totally random.
In this study, we use the permutation entropy for entropic functional form H[P] and the Jensen–Shannon divergences for induced distance D function in the Q definition. Jensen–Shannon divergence is a popular method of measuring the similarity between two probability distributions
3. Applications to oil markets
Our algorithm for analyzing volatility of a time series can be described as follows: Partition a long time series into (overlapping or non-overlapping) blocks of datasets of short length w, and compute Hp for each data subset. In the examples presented below, maximal overlapping (window shift by 1 time step) is used. We expect that the variation of Hp as a function of time or certain time-varying parameter can accurately indicate interesting dynamical changes in a time series. This is indeed so, as shall be shown by the examples in the following two sections.
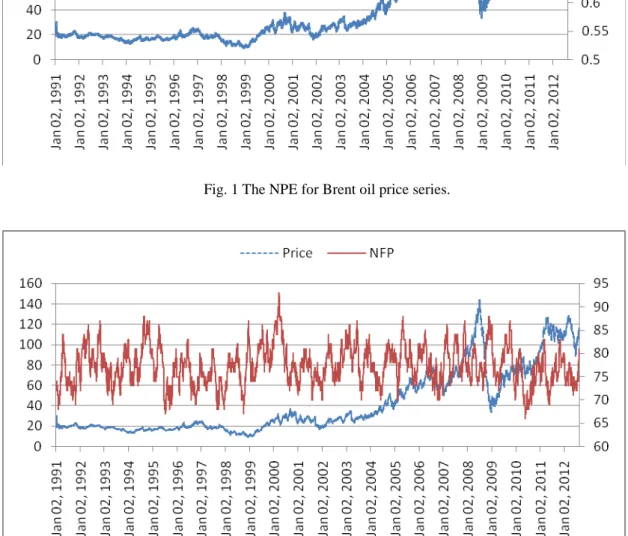
The daily Brent spot crude oil prices between Jan. 1991 and Aug. 2012 as the sample data. The data is from the Energy Information Agency (http://www.eia.gov/dnav/pet/pet_pri_spt_s1_d.htm). As shown in Figure 1, oil price (blue line) fluctuates in a pseudorandom process, which is a typical non-linear complex system. The embedding dimension m was chosen of order 5, and the time lag L=1 for a time windows of 75 that corresponds to one quarter approximately.
The variation of Hp vs. time is shown as dot red curve in Figure 1. The lowest minimum NPEs appear in Jan 2000, Jan 2003, Feb 2005, Mar 2005, May 2007 and Jan 2009. The NPE and NFP curves show to have certain seasonal behavior. We can observe that the number of forbidden patterns does not have a constant rate. On the contrary, it fluctuates in time. Its number is a good indicator of the randomness of the system at a precise moment. In this way, a decrease of the rate of forbidden patterns reflects that random forces are increasing which leads to an enhancement of the unpredictability of the system. On the contrary, when forbidden patterns increase, randomness is decreasing. It indicates that the evolution of the oil price would be more predictable. In this study, we do not obtain information about how the system is going to evolve, since we do not have a model describing the time series, but if we had it, the time periods where the number of forbidden patterns increases would be the
most suitable to apply it.
Fig. 1 The NPE for Brent oil price series.
Fig. 2 The number of NFP for Brent oil price series
We calculate the Pearson's Correlation Coefficient (r=-0.925) between NPE and NFP, and apparently find that they are negatively correlated. Figure 3 shows the scatter plot for NPE and NFP.
Fig 3. Scatter plot of NPE v.s. NFP
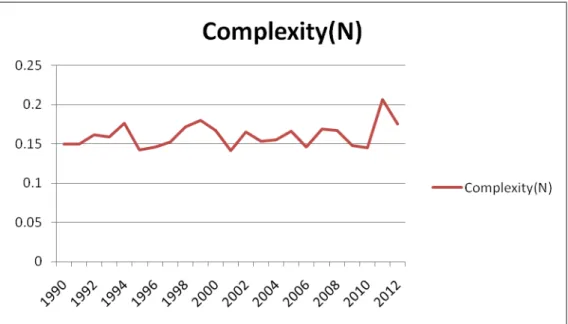
We apply the statistical measure of complexity to yearly oil price series from 1990 to
2012 as a measure of oil market efficiency. The measure specifies how much intricate
structure hidden in the oil dynamic market. Figure 4 shows the SMC using NPE as the
entropy term in equation (1). The oil market shows the increase of market efficient from
2010. This phenomenon reveals the oil market is getting unpredictable from 2010. The
possible reason for that may be the first round of quantitative easing policy from the
FED.
4. Empirical results
The distribution of ordinal patterns describing the oil price up and down in the dynamics of an oil market contains much information on the structure of the world oil trade. In this paper, the permutation entropy, forbidden pattern and statistical complexity measure are proposed as alternative volatility and market efficient measures. The permutation entropy and number of forbidden patterns are adopted as two indicators to monitor the dynamic change of oil price and regularity of oil price. The analysis shows up it is getting unpredictable from 2010 for crude oil market.
Reference
Adrangi, B., A. Chatrath, et al. (2001). "Chaos in oil prices? Evidence from futures markets." Energy Economics 23(4): 405-425.
Amigó, J. M. and M. B. Kennel (2008). "Forbidden ordinal patterns in higher dimensional dynamics." Physica D: Nonlinear Phenomena 237(22): 2893-2899.
Bandt, C. and B. Pompe (2002). "Permutation Entropy: A Natural Complexity Measure for Time Series." Physical Review Letters 88(17): 174102.
Charles, A. and O. Darné (2009). "The efficiency of the crude oil markets: Evidence from variance ratio tests." Energy Policy 37(11): 4267-4272.
Fan, Y. and J.-H. Xu (2011). "What has driven oil prices since 2000? A structural change perspective." Energy Economics 33(6): 1082-1094.
Giglio, R., R. Matsushita, et al. (2008). "Algorithmic complexity theory and the relative efficiency of financial markets." Europhysics Letters 84(4 (48005)).
Gu, R., H. Chen, et al. (2010). "Multifractal analysis on international crude oil markets based on the multifractal detrended fluctuation analysis." Physica A: Statistical Mechanics and its Applications 389(14): 2805-2815. Hamilton, J. D. (2008). "Understanding Crude Oil Prices." National Bureau of Economic Research Working Paper Series No. 14492.
He, L.-Y. and S.-P. Chen (2010). "Are crude oil markets multifractal? Evidence from MF-DFA and MF-SSA perspectives." Physica A: Statistical Mechanics and its Applications 389(16): 3218-3229.
Keller, K. and M. Sinn (2005). "Ordinal analysis of time series." Physica A: Statistical Mechanics and its Applications 356(1): 114-120.
Lin, Z., W. Zhen, et al. (2009). Is International Oil Price Chaotic? - Empirical Evidence from Spot Market. Business Intelligence and Financial Engineering, 2009. BIFE '09. International Conference on.
Liu, H. and X. Liu (2010). Empirical Study of the Price Volatility of Domestic and International Oil Futures. Information Management, Innovation Management and Industrial Engineering (ICIII), 2010 International Conference on.
Lopez-Ruiz, R., H. L. Mancin, et al. (1995). "A statistical measure of complexity." Phys. Lett. A 209: 321-326. Momeni, M. and I. Kourakis (2010). "NON-GAUSSIAN STATISTICS OF OIL PRICING TIME-SERIES: A CASE STUDY." Fractals 18(01): 101-110.
Ortiz-Cruz, A., E. Rodriguez, et al. (2012). "Efficiency of crude oil markets: Evidences from informational entropy analysis." Energy Policy 41(0): 365-373.
Panas, E. and V. Ninni (2000). "Are oil markets chaotic? A non-linear dynamic analysis." Energy Economics 22(5): 549-568.
Rosso, O. A., H. A. Larrondo, et al. (2008). Generalized Statistical Complexity Measure: A New Tool for Dynamical Systems. Proceedings of the Workshop Net-Works 2008 Pamplona, 9–11, June, 2008.
Ruiz, M. d. C., A. Guillamón, et al. (2012). "A New Approach to Measure Volatility in Energy Markets." Entropy 14(1): 74-91.
Zanin, M. (2008). "Forbidden patterns in financial time series." Chaos: An Interdisciplinary Journal of Nonlinear Science 18(1): 013119-013114.
Zhang, X., K. K. Lai, et al. (2008). "A new approach for crude oil price analysis based on Empirical Mode Decomposition." Energy Economics 30(3): 905-918.
Zhang, X., L. Yu, et al. (2009). "Estimating the impact of extreme events on crude oil price: An EMD-based event analysis method." Energy Economics 31(5): 768-778.
Zunino, L., M. Zanin, et al. (2009). "Forbidden patterns, permutation entropy and stock market inefficiency." Physica A: Statistical Mechanics and its Applications 388(14): 2854-2864.