1001, Ta-Hsueh Road, Hsin-Chu, Taiwan, R.O.C.
ABSTRACT
An improved method for measuring the refractive index of a medium is presented. First, the light coming from a circular heterodyne source is incident on the test medium. And, the reflected light passes through an analyzer with the transmission axis at a moderate azimuth angle. Then, the phase variation ofthe reflected light is measured by the heterodyne interferometric technique. Finally, substituting this phase variation into the equations derived from Fresnel's equations and Jones calculus, we can obtain the refractive index ofthe test medium.
Keywords: index measurements, heterodyne interferometry, Fresnel's equation.
1. INTRODUCTION
Almost all of the common techniques for measuring refractive index are related to the measurement of light intensity variation'5, their accuracy of measurements is limited. To overcome this drawback, Chiu et al.6 proposed a method to evaluate the refractive index by measuring the phase difference variation instead of light intensity variation. It has many merits, such as simple optical setup, easy operation, high stability, high measurement accuracy, and rapid measurement. However, its measurable range is limited by the refractive index of the prism in which the total internal reflection is occurred.
In this paper, we modified Chiu's method and present a more feasible method to measure the refractive index of a medium. Instead of using the effect ofthe total internal reflection, the effect of a simple reflection from the surface ofthe test medium is used. And, similar processes are performed to measure the phase variation. Then, by substituting this phase
variation into the equations derived from Fresnel's equations7 and Jones calculus8, we can obtain the refractive index of the test medium. This improved method has all merits as those of Chiu's method. Moreover, it is more feasible and its measurable range is not limited. We demonstrate its feasibility.
2. PRINCIPLE
The schematic diagram of this new method is shown in Fig. 1. A linearly polarized light passing through an electro-optic modulator EO being modulated by the electric signal generated by a function generator FG and a quarter-wave plate Q, is incident on the test medium S. The light reflected by this medium passes through an analyzer AN, and enters the photodetector D. Ifthe amplitude ofthe light detected by D is Et,thenthe intensity measured by D is iH Et2.Here it is the test signal. On the other hand, the electrical signal generated by the function generator is filtered and becomes the reference signal. Finally, these two signals are sent to a phase meter PM to evaluate the phase difference between them.
2.1. The intensity of the test signal
For convenience, the +z axis is chosen along the propagation direction and the y -axis is along the vertical direction. Let the light coming from a laser be linearly polarized at 45
° with
respective to the x- axis, then its Jones vector8 can be writtenFurther author information
-D.C. S. (correspondence): Email: [email protected]; Telephone: 886-3-5731951; Fax: 886-3-5716631
Fig. 1: Schematic diagram for this improved method for measuring refractive index of the test medium: EO, electro-optic modulator; FG, function generator; Q, quarter-wave plate; 5, test medium; AN, analyzer; D, photodetector; PM, phase meter.
1 (i'
(1)I (Dt
-
i
e'
0
1 (f\
-I 1)
0
e)1
i1 L1!L i(1 O)t
—1 —+/—=—I le 2
Ie 2 2
(2)2i)
2—i)
From Eq. (2), it is obvious that this is a circular heterodyne light source with angular frequence wand phase difference -z/2 between left- and right- circular polarizations. If the transmission axis of AN is at 45 withrespective to x-axis, we have
l\(r
Or1
(i
1( i
Ii
H —I le 2 +
Ie
2 2lAO
r,)[2'U)
2k—i)
S
AN
D
If the fast axis of EO is along the x-axis, and an external sawtooth voltage signal with angular frequence co and amplitude V2, the half-voltage of EO, is applied to EO, then the phase retardation produced by EO can be expressed as wt9. And if the fast axis of Q is 45 withrespective to the x-axis, then we have
E'1
Q(45 ° ) EO(wt)E=AN(45
1(1
I
22\
=Et2=kP4s)[1+COS(wt_)],
(4) wherer2 —r2
Ø=tan—1 S (5)2rr
On the other hand, the reference signal has the form of
'0
'r
Er 2(1 + cos
cot)
. (6)Thus from Eq.(4) and Eq.(6), it is seen that both the test signal and reference signal are sinusoidal signal. When they are sent to a phase meter PM, the phase variation q$ can be measured.
2.2. Measurement of the refractive index of the medium
Rearranging Eq.(5), we have
rL
= tan
0 J2 +
1. (7)Tounderstand the meaning of signs "±", we write rp .fld r according to Fresnel's equations7:
n2 cos& —
fl2
sin2 0
r=
,
(8)n2 cos0 + Jfl2
sin2 0
and cos0 —J2 sin2
0
r
=—
cos0+
/2
sin2 0
where8 is the incident angle. For easy understanding, n1 .5ischosen as an example to clarify the relations among rp r, q$, and 0.Theyare depicted in Fig. 2 by using Eqs.(5)-(9). The relation curves of rp and r versus 0inFig. 2(a) show that both rp and r are negative as 0islarger than the Brewster angle Oj.Sowhen 0>Ot, theplus sign is taken in Eq.(7), and when 0 <0B' the minus sign is taken in Eq.(7). If the range of 0 defmed in Eq.(5) is chosen within -90 and 90 as in common mathematical calculation, the relation curve of 0 versus 0behaves as shown in Fig. 2(b). It is obvious that there is a
discontinuity near 0=0B' hence it becomes difficult to evaluate q$ accurately. On the other hand, if the measurable range 0 is
0.2 -0.2
ci
E -0.
(a )
90 60 30 hi -30 -60 -90 0 -30 -hi-
-120 -150 -18070
10 20 30 40 50(b
)l:IIiIIIJ•iiJJ::
10 20 30 40 50 60 70 80 900
(degree)
(c )
Fig.2: The relation curves of (a) rp and r versus 6 (b) 0versus& as 0is
chosen within -90 and 90
and (c) 0versus9,-1 2sin2
OcosJn2
tan
—180
cos2
2
_
sin20
0=
_______
(10)-1 2 sin2
0cos0Jn2
tan
cos2
0
•n2—
sin2o
andn
, (11)respectively. It is obvious from Eq(1 1) that n can be calculated with the measurement of 0underthe experimental condition
& is specified.
3. EXPERIMENTS AND RESULTS
To show the feasibility ofthis new method, the refractive indices ofthree kinds of glass, BK7, BaSF2 and SF1 1, were measured. A He-Ne laser with a 632.8-nm wavelength and an electro-optic modulator(model PC/2, manufactured by England Electro-Optics Developments Ltd.) with a half-wave voltage of 170 V were used in this test. The frequency of the sawtooth signal applied to the electro-optic modulator was 2 kHz. A high-precision rotation stage(PS-O-90) with the angular resolution of 0005 manufactured by Japan Chuo Precision Industrial Company Ltd. was used to mount the test medium. At 9=60 , the phase differences of BK7, BaSF2 and SF11 were measured to be -79.30 ° , -8670° , and-91.99 °
respectively.After introducing these data into Eq.(1 1), we obtained the refractive indices ofthese samples as 1 .5154, 1.6603
and 1 .7788, and their reference refractive indices10 are 1 .5 1 509, 1 .66068, and 1 .77862, respectively.
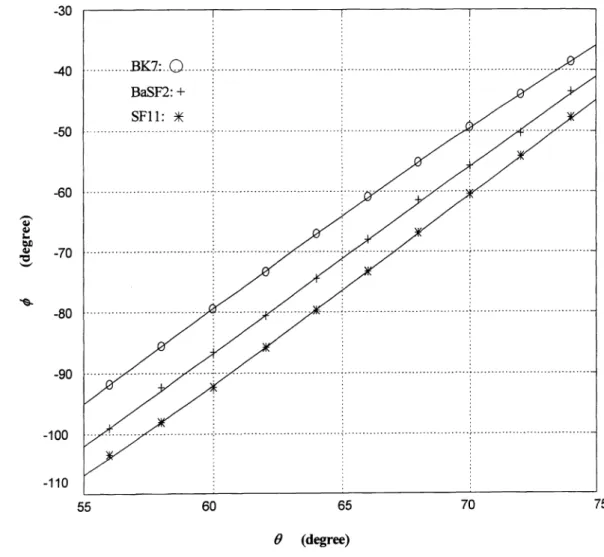
Moreover, the theoretical and the experimental curves of 0versus 9 for these medium are shown in Fig. 3 .
In
this figure, the solid curves represent the theoretical curves that we obtained by introducing the above reference refractive indices into Eq.(10), and the symbols 0, +, and represent the measured values for BK7, BaSF2 and SF1 1, respectively. It is clear that the three curves show good correspondence.4.
DISCUSSIONS
Since the effect of the total internal reflection is not used in this method, the measurable range is not limited. From Eq.(1l), we can get
(n2 —
ri2
+
cos2o)
_________ An sinOcos0
xAçb,
(12)sin Ocos0
+
xAO
n
where zIG and zlq$ are the errors in the incident angle and the phase variation, respectively. It is obvious that the refractive index measurement is dependent on the incident angle (i.e., the rotation angle of the rotation stage) and the angular resolution of the phase meter. In our experiment, the angular resolutions of the rotation stage and the phase meter are
0.005 ° and0.01 ° , respectively.Consequently, the curve ofzln versus Ocan be obtained by substituting z19=O.005 and z1q =0.01 ° intoEq.(12) for several different refractive indices n, as shown in Fig. 4. Obviously, the refractive index error becomes smaller as n decreases. The best resolution can be obtained as the incident angle is in the neighborhood near 60 ° and
it is better than 8 X i0.
-80
-90
-100
0 (degree)
Fig. 3: Theoretical and experimental curves for 0versus0forBK7, BaSF2 and SF11.
-30 -40 -50 -60 -70 -110 55 60 65 70 75
0 (degree)
Fig.4: Relation curves of zln versus & for several different n.
5. CONCLUSIONS
An improved method for measuring the refractive index of a medium is proposed. First, the light coming from a circular heterodyne source is incident on the test medium. And the reflected light passes through an analyzer with the transmission axis at a moderate azimuth angle. Then, the phase variation ofthe reflected light is measured by the heterodyne interferometric technique. Finally, substituting this phase variation into the equations derived from Fresnel's equations and Jones calculus, we can obtain the refractive index of the test medium. This method has many merits, such as simple optical setup, easy operation, high stability, high measurement accuracy, and rapid measurement. Moreover, its measurable range is not limited. Its feasibility has been demonstrated.
6. ACKNOWLEDGEMENTS
This study was supported in part by the National Science Council, Taiwan, China, under contract NSC85-2215-E-009-005.
7. REFERENCES
1 . S.T. Kirsch, "Determining the refractive index and thickness of thin films from prism coupler measurements" ,Appl.
Opt. 20, pp. 2085-2089, 1981.
2. M. Akimoto, and Y. Gekka, "Brewster and pseudo-Brewster angle technique for determination of optical constants", Jpn.J. Appi. Phys. 31, pp. 120-122, 1992.
3. S. F. Noe, and H. E. Bennett, "Accurate null polarimetry for measuring the refractive index oftransparent materials" ,J.
Opt. Soc. Am. A 10, pp. 2076-2083, 1993.
4. L. Le.vesque, B. E. Paton, and S. H. Payne, "Precise thickness and refractive index determination of polymide films using attenuated total reflection", Appl. Opt. 33, pp. 8036-8040, 1994.
5. S. M. Mian, A. Y. Hamad ,andJ. P. Wicksted, "Refractive index measurements using a CCD" ,Appl. Opt. 35, pp. 6825-6826, 1996.
6. M. H. Chiu, J. Y. Lee, and D. C. Su, "Refractive-index measurement based on the effects of total internal reflection and the uses of heterodyne interferometry" ,Appl.Opt. 36, pp. 2936-2939, 1997.
7. M. Born and E. Wolf, Principles of Optics, 6th ed, pp. 48-50, Pergamon, Oxford, Uk, 1980.
8. A. Yariv and P. Yeh, Optical Waves in Crystal, pp.12 1-154, Wiley, New York, 1984.
9. L. H. Shyu, C. L. Chen, and D. C. Su, "Method for measuring the retardation of a wave plate" ,Appl. Opt. 32, pp. 4228-4230, 1993.