Robust Logo Recognition for Mobile Phone Applications
SHU-KUO SUN AND ZEN CHEN Department of Computer Science
National Chiao Tung University Hsinchu, 300 Taiwan
In the paper, a new recognition method for logos imaged by mobile phone cameras is presented which can be incorporated with mobile phone services for use in enterprise identification, corporate website access, traffic sign reading, security check, content awareness, and the related applications. The main challenge in applying the logo recogni-tion for mobile phone applicarecogni-tions is the inevitable photometric and geometric transfor-mations encountered when a handheld mobile phone camera operates at a varying view-point under different lighting environments. A new distinctive logo feature vector and an associated similarity measure are proposed for logo recognition using the Zernike mo-ment (ZM) phase information. The discriminative power of the new logo recognition method is compared with three major existing methods. The experimental results indicate that the proposed ZM phase method has the best performance in terms of the precision and recall criterion under the above inevitable imaging variations. An analysis on the performances of the four recognition methods is given to account for the performance discrepancy.
Keywords: logo recognition and retrieval, mobile phone camera, geometric and
photo-metric transformations, Zernike moments, phase and magnitude information, precision and recall
1. INTRODUCTION
With the rise of affordable digital cameras mounted on mobile devices, mobile ap-plications of visual image information have received a great deal of attention. Visual pattern recognition could play a key role in mobile applications for security check, con-text recognition, location detection, and museum guidance [1-4]. Fig. 1 depicts a scenario of the mobile applications of the logo images. A mobile user directs his or her mobile phone camera to a logo of interest and captures an image in the camera field of view. A software client built in the mobile device initiates submission of the image to the server via 3G or other wireless links. The web-service reads the message and evokes the logo recognition system to identify the logo in the sever logo database. Then the server sends the corresponding corporate identity back to the client, enabling the user to access to the more detailed and specific information.
Logo recognition has been specifically used in application areas including website summarization by image content, enterprise identification, entertainment advertising, ve- hicle recognition, road sign reading, and content-based image retrieval [5-11]. For a logo recognition system, features related to visual contents are first extracted to describe the logo images. Then, a similarity measure is defined to compare the query image with the target images saved in a logo database using the extracted features. Next, target logos most similar to the query image are retrieved. Since the query logo image may be taken
Fig. 1. A scenario of the mobile applications for logo recognition.
by a handheld mobile phone camera operating at a varying viewpoint under different ligh- ting environments, the query image may differ substantially from the database target im-age due to geometric transformations (viewpoint change, rotation, and scaling change) and photometric transformations (lighting change, noise, and image blur). Therefore, a challenge to the logo recognition system is to extract the features robust to the above inevitable imaging variations.
A logo is a graphic entity containing colors, shapes, textures, and perhaps text as well, organized in some spatial layout format. Color features are often easily obtained from the logo image. The color histogram [12] is probably one of the most popular gross representations of the foreground object in which the precise spatial information is lost, so an exact matching is generally impossible. Since a logo may be designed with a few setting of color combinations, color will be ignored as far as the unique identity of a logo (represented as an intrinsic graphic pattern) is concerned. On the other hand, the text in the logo is often modified to add to its aesthetic appealing, its segmentation for the OCR processing may not be easy and also unnecessary for logo identification. The whole text can be viewed as part of the logo and handled with others by a general shape analyzer. Similarly, if a logo contains texture patterns, the texture patterns can be treated as a graphic pattern and, again, handled with other parts together. In the end, a logo repre-sentation is boiled down to an integrated shape pattern or a set of sub-logo shape patterns. Hence, shape analysis of the logo is the main concern here.
Different methods using different shape features for logo classification have been proposed in the literature. Edge histogram descriptor (EHD) [13] is an MPEG-7 texture descriptor that captures the spatial distribution of edges. EHD is represented by a histo-gram of the gradient orientations which is quantized in 5 bins and the region is partitioned into a 4 × 4 location grid, resulting in a feature vector of dimension 80. Although the gra-dient histogram provides stability against mild deformations of the image pattern, the grid partition of the support region will lead to the non-smooth boundary feature values, i.e., the so-called boundary effect problem. Recently, some researchers using Gabor transform and wavelet transform for pattern recognition [14, 15]. However, the set of Gabor filters is not orthogonal, and thus reduce its discriminative power. On the other hand, the wave- let transform has the advantages of multiple resolutions and reconstructability, but it is not rotational invariant (so is the Gabor transform). Therefore, both transforms need to solve the rotation problem first based on some orientation information. To achieve rota-
Query image
Shape deformation correction Affine lighting normalization Compute ZM phase descriptor
Logo similarity measure Logo segmentation
Logo ZM phase descriptor database Recognition /retrieval results
Fig. 2. The scheme of logo recognition process.
tion invariant, an alternative method using a ring projection structure is suggested in which the absolute sums of the sub-band coefficients (LH, HL and HH) of wavelet trans-form are accumulated within a specific number of rings [16]. However, the ring projec-tion will lose the spatial informaprojec-tion in the radial direcprojec-tion. As a consequence, a logo and its mirror version have the same ring projection profiles, and, therefore, become indis-tinguishable. More impotently, most of the above methods cannot work properly under photometric and geometric image transformations, as shall be seen.
In this paper, we propose a logo recognition method based on a ZM phase-based fea-ture vector. Fig. 2 depicts the scheme of logo recognition process. To start with, we ap-ply a shape deformation correction process to solve the shape distortion problem caused by a geometric transformation. The normalized logo planar patch can be shown to be affine invariant up to a rotational ambiguity [17]. After the region normalization, a ZM phase-based feature vector will be defined, which is robust to geometric and photometric image transformations. Meanwhile, due to the use of a set of orthogonal filters, the ZM feature vector is more compact and has a greater discriminative power. Experimental re-sults show that the proposed ZM phase based recognition method has better retrieval performance in terms of the precision-recall criterion than the other existing methods.
The paper is organized as follows. Section 2 introduces the logo shape deformation correction. Section 3 proposes the similarity measure using a ZM phase-based feature vector. In section 4 the discriminative power of the new ZM phase recognition method is compared with three existing methods based on the precision-recall criterion. In section 5 an analysis on the performance discrepancy between different logo recognition meth-ods is given. The conclusion is given in the last section.
2. LOGO SHAPE DEFORMATION CORRECTION
homogra-phy transformation when the viewpoint is changed. The homograhomogra-phy can be shown lo-cally affine, so an affine approximation is commonly made. We shall fit an ellipse to a logo region. The normalized region was shown to be affine invariant up to a rotation change [17].
Let the covariance matrix of the logo image I(x, y) be
. xx xy xy yy M μ μ μ μ ⎛ ⎞ = ⎜⎜ ⎟⎟ ⎝ ⎠ (1)
Define the affine normalized image of I(x, y) to be
I′(x, y) = M−1/2I(x, y). (2)
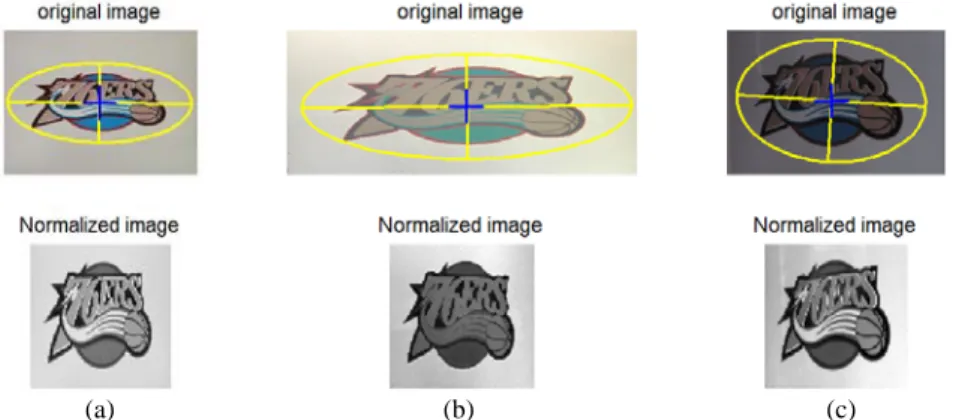
Fig. 3 shows examples of the respective original and normalized images of a logo and its two deformed versions. We can see, after the affine normalization process, the normalized images are more similar.
(a) (b) (c)
Fig. 3. Three logo images taken from different viewpoints and their normalized images; (a) The reference logo image; (b) and (c) The two deformed versions of the reference image; The yellow ellipses show the detected ellipses.
3. LOGO SIMILARITY MEASURE BASED ON THE ZM PHASE INFORMATION
3.1 A ZM Phase-Based Logo Feature Vector
Zernike moments (ZMs) have been used in object recognition regardless of varia-tions in position, size and orientation [18-20]. Essentially Zernike moments are the ex-tension of the geometric moments by replacing the conventional transform kernel xmyn
with orthogonal Zernike polynomials [21].
The Zernike basis function Vnm(ρ, θ) is defined over a unit circle with order n and
Vnm(ρ, θ) = Rnm(ρ, θ)e jmθ, for ρ ≤ 1, (3)
where {Rnm(ρ)} is a radial polynomial in the form of
( | |)/ 2 2 0 ( )! ( ) ( 1) . | | | | !( )!( )! 2 2 n m s n s nm s n s R n m n m s s s ρ − ρ − = − = − + − − −
∑
(4)The set of basis functions {Vnm(ρ, θ)} is orthogonal, i.e.,
2 1 * 0 0 1, ( , ) ( , ) , with . 0, otherwise 1 nm pq np mq ab a b V V d d n π π ρ θ ρ θ ρ ρ θ= δ δ δ = ⎨⎧ = + ⎩
∫ ∫
(5)The two-dimensional ZMs for a continuous image function f(ρ, θ) are represented by
2 1 * 0 0 2 1 0 0 1 ( , ) ( , ) 1 e ( , ) ( ) . nm nm jm nm n Z f V d d n f R d d π π θ ρ θ ρ θ ρ ρ θ π ρ θ ρ ρ ρ θ π − + = + =
∫ ∫
∫
∫
(6)For a digital image function the two-dimensional ZMs are given as
* ( , ) unit disk 1 ( , ) ( , ). nm nm n Z f V ρ θ ρ θ ρ θ π ∈ + =
∑ ∑
(7)Define a logo descriptor P based on the sorted Zernike moments as follows,
31 11 11 31 [ i , i , , iNM ] ,T NM P= Z eφ Z eφ … Z eφ (8)
where Znm is the ZM magnitude, and ϕnm is the ZM phase. Here the Zernike moments
nm
i nm
Z eϕ with m = 0 are not included, and the maximum order N and maximum repetition
M both equal to 12, resulting the length of logo descriptor P to be 42 for the following
experiments.
3.2 A Similarity Measure
A logo can be viewed as a single integrated graphic entity or a composite of several sub-logos when it contains multiple sub-components. There are two types of logo proc-essing tasks: one is to classify the query logo as one from the database and the other is to retrieve all similar logos in the database. The similarity measures for these two types are defined below.
3.2.1 The similarity measure for the logo classification
their respective ZM feature vectors be = { q inmq }
q nm
P Z eφ and = { d i nmd }.
d nm
P Z eφ Here
both logos are each treated as an integrated graphic entity. Here the query logo can be either a rotated version of the database logo or a totally different one. A similarity measure using the weighted ZM phase differences, derived from a concept in [20], is expressed by
ˆ ˆ
min{ ( ) mod(2 ) , 2 ( ) mod(2 ) }
( q, d) 1 nm nm nm m n m m S P P w α π π α π π Φ − − Φ − = −
∑∑
(9) where , = , q d nm nm nm q d nm nm n m Z Z w Z Z + +∑
and Φnm = (φ qnm − φ qnm) mod 2π is the actual phase difference.The rotation angleα is determined by an iterative computation of ˆ α = (Φˆm n,m − αˆm−1) mod 2π, with the initial value αˆ0=0, using the entire information of Zernike moments sor- ted by m. The value range of (S P Pq, d) is the interval [0, 1].
3.2.2 The similarity measure for the similar logo retrieval
For the similar logo retrieval, the connected components of the logo are detected first, and then each component is treated as a sub-logo. We compute the ZM feature vec-tor for each sub-logo. Therefore, a logo is represented by a set of ZM feature vecvec-tors.
Given a query logo Lq with N sub-logos, we compare the query logo Lq with all the
logos in the database. Assume a database logo Ld has M sub-logos. The similarity
meas-ure for the logo pair (Ld, Lq) is computed as the sum of the similarity scores of all matched
sub-logo pairs. That is, for each sub-logo Ciq of the query logo Lq, i = 1, 2, …, N. We find
the sub-logo Cjd of a database logo Ld with the maximum similarity score Si = S(Ciq, Cdj*) =
max{ ( iq, dj) | 1, 2, , }.
j
S C C j= … M If the similarity score is greater than a pre-defined thre- shold (e.g. 0.8), then (Ciq, Cdj*) is considered as a matched sub-logo pair. All of the
matched sub-logo pairs are further checked to ensure the 1-1 correspondence relation. Assume there are i1, i2, …, iP matched sub-logo pairs, the similarity score is computed as
1 ( , ) ( ), p p P q d i i p Score L L w S = =
∑
× (10) where . min( , ) q i p p C i q d A w A A = Aq, Ad and q i p CA are the areas of the query logo, database logo and the ith matched sub-logo , p q i C respectively. 4. EXPERIMENTAL RESULTS
three experiments are to be conducted. We compare with our proposed method with three other state-of-the-art methods for logo recognition: IZMD [18], EHD [13], and Ring pro-jection [16]. The first experiment is to evaluate the classification power of the four me- thods by treating the logo as an integrated entity. The second experiment evaluates the precision and recall rates of the four methods in which the logo is considered as a whole. The final experiment demonstrates our proposed method for retrieving the similar traffic signs by treating the logo as a composite of multiple components.
4.1 The Performance Comparison for the Logo Classification
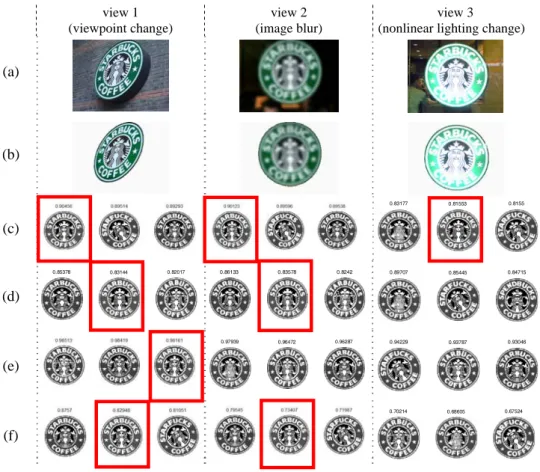
Fig. 4 shows a set of 8 similar logos at a 400 × 400 pixel resolution which are down- loaded from various web sites. In Fig. 5 we also download three different views of the first logo in the data set taken under a viewpoint change, an image blur, and a non-linear lighting change, respectively.
Fig. 4. The set of similar logos.
There are some properties of the mobile phone imagery for the logo segmentation. First, the logo is usually placed at the image center. Second, the logo and its background are highly contrasted. Third, the logo generally contains subparts in different colors. There-fore, the segmentation task of the logo image is simpler than a general image segmenta-tion problem. Our segmentasegmenta-tion process works in the HSI (Hue-Saturasegmenta-tion-Intensity) color space. The major colors of the image are found as the local peaks in the histogram plot of the hue band. Then we apply the k-means clustering to cluster the image pixels of similar color as a group. We select the color clusters located near the center of the logo image. The homogeneous logo regions are then extracted using the selected color clusters. The final segmentation result of the logo positioning at each image center is shown in Fig. 5 (b).
The segmented logo images are then submitted for a logo query. The color images are transformed to gray-level images before computing the feature vectors by the four methods. After the classification process, the logos in the top three ranks are listed in Figs. 5 (c)-(f) for the four methods. The correct one is marked with a red box. The results show that ZM phase has the best classification power for the three query logos.
4.2 The Performance Comparison for Logo Retrieval
For evaluating the discriminative performances of the four methods, we use a data-base composed of M logo patterns (M = 300) in the experiment; some representatives of the logo patterns are shown in Fig. 6. For each logo in the database, we generate N syn-thetic images (N = 10 in this case) under three kinds of imaging variations whose trans-formation parameters are listed below:
(1) Image blur: via a Gaussian smoothing with mean 0 and standard deviation value σ = 1.2, 1.4, 1.6, …, 3, respectively (with an increment of 0.2).
(viewpoint change) view 1 (image blur) view 2 (nonlinear lighting change) view 3 (a) (b) (c) 0.83177 0.81553 0.8155 (d) 0.85378 0.83144 0.82017 0.86133 0.83578 0.8242 0.89707 0.85445 0.84715 (e) 0.97939 0.96472 0.96287 0.94229 0.93787 0.93046 (f) 0.70214 0.68605 0.67524
Fig. 5. The classification results for three logo queries; (a) Query logos; (b) Segmentation results of the query logos. The logos in the top three ranks determined by (c) ZM phase, (d) IZMD, (e) EHD and (f) Ring projection, respectively.
(a) (b) (c) (d) (e)
(f) (g) (h) (i) (j) (k)
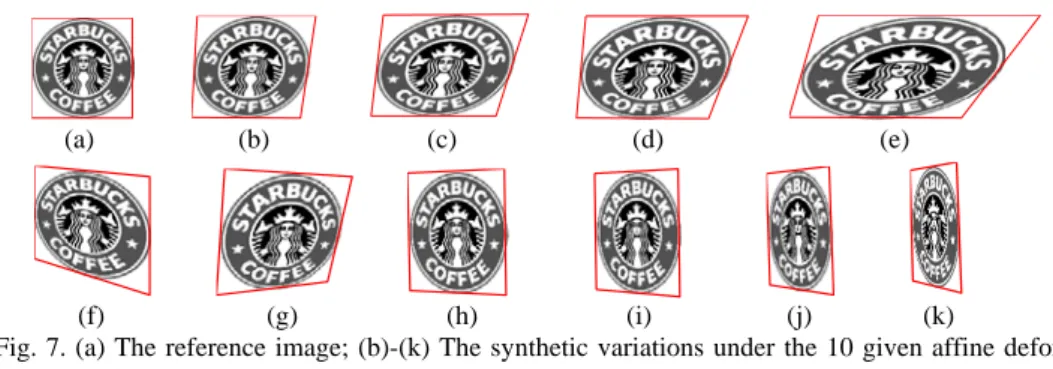
Fig. 7. (a) The reference image; (b)-(k) The synthetic variations under the 10 given affine defor-mations.
(2) Gamma lighting change: Iq =Iγ, where Iq is the reference image I raised to a power of γ
with γ being 1/3, 2/3, 1, …, 3, respectively (with an increment of 1/3).
(3) Affine deformation: using 10 known planar homographies, as illustrated in Fig. 7. The M × N (3000 = 300 × 10) query logos under each of the above imaging varia-tions are generated. The retrieval performances of the four recognition methods are eva- luated based on the precision and recall rates defined by
# correct matches
Recall = ,
# correspondence (11)
# correct matches
Precision = .
# correct matches+# false matches (12) Here, #correspondences = M × N, #correct matches ≤ M × N and #false matches ≤ (M − 1) × (M × N).
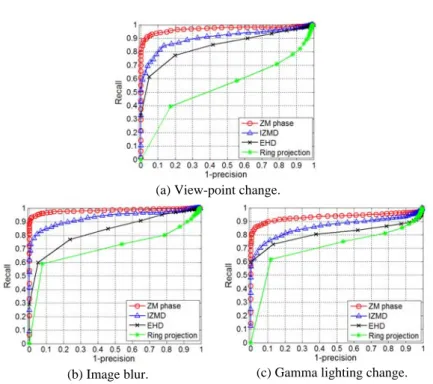
Fig. 8 shows the results by the PR (Precision vs. Recall) curve. The ZM phase curve is located above other curves in each case, indicating the ZM phase method has the best performance among the four methods under the three given imaging variations which are rather typical.
4.3 Traffic Sign Retrieval by Multiple Component Matching
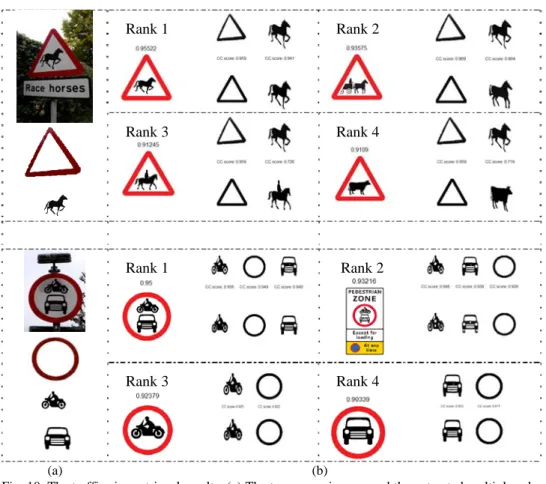
To show the proposed method for logo retrieval based on the multiple components of the logos, the following experiment is conducted on a downloaded dataset consisting of 100 traffic signs; some representatives of the dataset are shown in Fig. 9. Given a query image, components of the sign are extracted by the hue segmentation and the con-nected components are each viewed as a sub-logo. We apply the similarity measure de-scribed in section 3.2.2 to compute the similarity scores, and fetch traffic signs in the top 4 ranks from the dataset. Fig. 10 shows the retrieval results for two different query im-ages. As expected, the correct target traffic sign is ranked as top result by using the ZM phase method.
(a) View-point change.
(b) Image blur. (c) Gamma lighting change.
Fig. 8. The PR curves for retrieval performance evaluations under different kinds of specified trans- formations.
Fig. 9. Some of 100 traffic signs used in the experiment.
5. AN ANALYSIS ON LOGO RETRIEVAL RESULTS
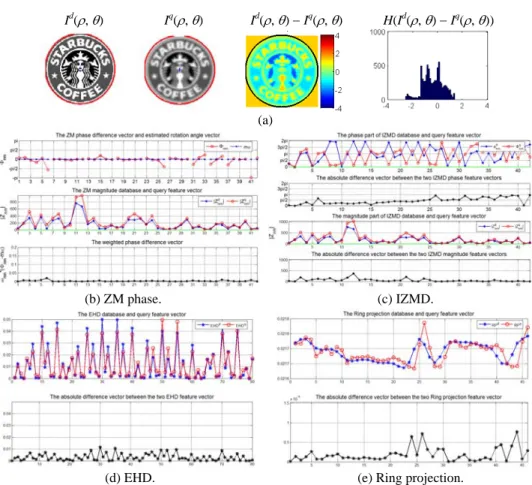
From above, we can observe that the ZM phase method has the best performance among the four recognition methods (ZM phase, IZMD, EHD and Ring projection). The photometric and geometric transformations generally lead to an image intensity transfor-mation at the pixel level (image blur is used as an example). To illustrate the performance differences between them, Fig. 11 shows the intermediate results for the performance
Rank 1 Rank 2
Rank 3 Rank 4
Rank 1 Rank 2
Rank 3 Rank 4
(a) (b)
Fig. 10. The traffic sign retrieval results; (a) The two query images and the extracted multiple sub- logos; (b) The 4 highest-ranked database logos and their matching scores against the da-tabase sub-logos.
comparisons under image blur variation. Fig. 11 (a) shows a database logo image Id(ρ, θ) and its transformed version (i.e., query image Iq(ρ, θ)) under the image blur variation, along with their difference image and the histogram of intensity differences. We can ob-serve that the difference image contain some non-uniform intensity fluctuation.
The non-uniform intensity fluctuation causes the non-uniformly change in the ZM magnitude. On the other hand, the ZM phase difference is computed as
1 Im( ) 1 Im( ) tan tan , Re( ) Re( ) q d q d nm nm nm nm nm q d nm nm Z Z Z Z ϕ ϕ ϕ − ⎛ ⎞ − ⎛ ⎞ Δ = − = ⎜⎜ ⎟⎟− ⎜⎜ ⎟⎟ ⎝ ⎠ ⎝ ⎠ (13)
where Im( ) Im( ) Im( )
Re( ) Re( ) Re( )
q d nm nm nm q d nm nm nm Z Z Z Z Z Z + Δ =
+ Δ and ΔRe(Zmn) and ΔIm(Zmn) are the real and ima-
ginary ZM components of the difference image between the query and database images. Since the image structures of the query and database images are similar, so it is likely that
Id(ρ, θ) Iq(ρ, θ) Id(ρ, θ) − Iq(ρ, θ) H(Id(ρ, θ) − Iq(ρ, θ))
(a)
(b) ZM phase. (c) IZMD.
(d) EHD. (e) Ring projection.
Fig. 11. A performance analysis on the ZM phase, IZMD, EHD and ring projection methods under image blur.
the phase angles of the two images are in phase (i.e., no phase difference after the image rotation alignment). On the other hand, the probability that the two images are out of phase is small. Since our ZM phase similarity score is measured by the phase difference weighted with the ZM magnitude for each order (n, m), the weighted sum of the absolute phase differences is nearly zero, as indicated in Fig. 11 (b). Consequently, the single majority of phase differences (zero degree) lead to the robustness of the rotation angle estimation and of the ensuing similarity measurement.
On the other hand, the similarity score of IZMD is computed as the weighted sum of the two distances: magnitude distance and phase distance. The non-uniform intensity fluctuation leads to a significant change in the ZM magnitudes, resulting in a change in the similarity score. Furthermore, the IZMD method performs a phase alignment using a fixed order moment (e.g., φ3,1) to achieve the rotation invariance. However, since
differ-ent logos have differdiffer-ent ZM magnitudes, the specific |Z3,1 | magnitude may be small. In
this case, the φ3,1 phase becomes unstable so that the other phase differences are not close
to zero, as shown in the second row of Fig. 11 (c). As a consequence, the rotation align-ment is unstable, so is the similarity measure.
The 4 × 4 grid partition of the EHD measurement region will face the boundary ef-fect problem, as described previously. Although the local gradient angles in the trans-formed image remain considerably unchanged (except under a severe image blur which causes the gradient angles destroyed), their gradient magnitudes will change in a non- uniform manner, as indicated in Fig. 11 (d). It results in a greater dissimilarity between the original and transformed images.
Finally, the ring projection method is based on the sums of the corresponding fea-ture values accumulated in the individual rings, and, thus, are potentially invariant to image rotation. The partition of the ring segments faces the boundary effect, too, and is sensitive to the non-uniform image fluctuation, as indicated in Fig. 11 (e). Moreover, the ring projection structure loses the spatial information in the individual rings, thus reduc-ing its discriminative power. Consequently, the rreduc-ing projection has the poor performance, as shown in Fig. 8.
6. CONCLUSION
In the paper, robust recognition of logos imaged by mobile phone camera is pre-sented which can be integrated with mobile phone utilities to provide services for enter-prise identification, corporate website access, traffic sign reading, security check, content awareness, and the related applications. The proposed method is compared with three major existing methods, IZMD, EHD, and Ring projection. Experimental results of logo classification and retrieval show that the proposed ZM phase method has the best per-formance under typical photometric and geometric transformations encountered when a handheld mobile phone camera is used to operate during different time of the day. Fur-thermore, an analysis on the performance evaluation results is given to account for the performance discrepancy between the four different methods.
REFERENCES
1. A. A. Salah, E. Alpaydin, and L. Akarun, “A selective attention-based method for visual pattern recognition with application to handwritten digit recognition and face recognition,” IEEE Transactions on Pattern Analysis and Machine Intelligence, Vol. 24, 2002, pp. 420-425.
2. J. Himberg, K. Korpiaho, H. Mannila, J. Tikanmaki, and H. T. T. Toivonen, “Time series segmentation for context recognition in mobile devices,” in Proceedings of
International Conference on Data Mining, 2001, pp. 203-210.
3. G. Fritz, C. Seifert, and L. Paletta, “A mobile vision system for urban detection with informative local descriptors,” in Proceedings of International Conference on
Com-puter Vision Systems, 2006, pp. 30-38.
4. E. Bruns, B. Brombach, T. Zeidler, and O. Bimber, “Enabling mobile phones to sup-port large-scale museum guidance,” IEEE Multimedia, 2007, pp. 16-25.
5. E. Baratis, E. G. M. Petrakis, and E. Milios, “Automatic website summarization by image content: a case study with logo and trademark images,” IEEE Transactions on
Knowledge and Data Engineering, Vol. 20, 2008, pp. 1195-1204.
International Conference on Document Analysis and Recognition, Vol. 2, 2007, pp.
864-868.
7. G. Cui, L. Chen, and J. Li, “Billboard advertising detection in sport TV,” in
Pro-ceedings of the 7th International Symposium on Signal Processing and Its Applica-tions, 2003, pp. 537-540.
8. P. Nieto, J. R. Cózar, J. M. González-Linares, and N. Guil, “A TV-logo classifica-tion and learning system,” in Proceedings of Internaclassifica-tional Conference on Image
Processing, 2008, pp. 2548-2551.
9. J. Wang, Q. Liu, L. Duan, H. Lu, and C. Xu, “Automatic TV logo detection, track-ing and removal in broadcast video,” Multimedia Modeltrack-ing, Vol. 2, 2007, pp. 63-72. 10. Y. Wang, Z. Liu, and F. Xiao, “A fast coarse-to-fine vehicle logo detection and rec-ognition method,” in Proceedings of IEEE International Conference on Robotics
and Biometrics, 2007, pp. 691-696.
11. L. Xia, F. Qi, and Q. Zhou, “A learning-based logo recognition algorithm using SIFT and efficient correspondence matching,” in Proceedings of International
Con-ference on Information and Automation, 2008, pp. 1767-1772.
12. M. J. Swain and D. H. Ballard, “Color indexing,” International Journal of Computer
Vision, Vol. 7, 1991, pp. 11-32.
13. C. S. Won, D. K. Park, and S. J. Park, “Efficient use of MPEG-7 edge histogram descriptor,” ETRI Journal, Vol. 24, 2002, pp. 23-30.
14. B. S. Manjunath and W. Y. Ma, “Texture features for browsing and retrieval of im-age data,” IEEE Transactions on Pattern Analysis and Machine Intelligence, Vol. 18, 1996, pp. 837-841.
15. A. Hesson and D. Androutsos, “Logo classification using Haar wavelet co-occur-rence histograms,” in Proceedings of Canadian Confeco-occur-rence on Electrical and
Com-puter Engineering, 2008, pp. 927-930.
16. D. M. Tsai and C. H. Chiang, “Rotation-invariant pattern matching using wavelet decomposition,” Pattern Recognition Letters, Vol. 23, 2002 pp. 191-201.
17. T. Lindeberg and J. Garding, “Shape-adapted smoothing in estimation of 3-D shape cues from affine deformations of local 2-D brightness structure,” Image and Vision
Computing, Vol. 15, 1997, pp. 415-434.
18. S. Li, M. C. Lee, and C. M. Pun, “Complex Zernike moments features for shape- based image retrieval,” IEEE Transactions on Systems, Man, and Cybernetics − Part
A: Systems and Humans, Vol. 39, 2009, pp. 227-237.
19. A. Khotanzad and Y. H. Hong, “Invariant image recognition by Zernike moments,”
IEEE Transactions on Pattern Analysis and Machine Intelligence, Vol. 12, 1990, pp.
489-497.
20. W. Y. Kim and Y. S. Kim, “Robust rotation angle estimator,” IEEE Transactions on
Pattern Analysis and Machine Intelligence, Vol. 21, 1999, pp. 768-773.
21. M. R. Teague, “Image analysis via the general theory of moments,” Journal of
Shu-Kuo Sun (孫樹國) received the M.S. degree in Elec-trical Engineering from Cheng Chung Institute of Technology, Taoyuan, Taiwan, in 1993, and the Ph.D. degree in Computer Science from National Chiao Tung University, Hsinchu, Taiwan, in 2009. He is currently a Postdoctoral Fellow at the Department of Computer Science, National Chiao Tung University. His re-search interests include feature detection, region descriptor, im-age registration, remote sensing, and pattern recognition.
Zen Chen (陳稔) is Professor of Computer Science at Na-tional Chiao Tung University, Hsinchu, Taiwan. He holds a Ph.D. degree in Electrical Engineering from Purdue University. After graduating from Purdue University, he worked for Burroughs Corporation, Detroit, Michigan, and joined National Chiao Tung University, Taiwan, afterwards. He spent a year (1981-1982) at Lawrence Berkeley Laboratory, University of California, Berke-ley, California, as a visiting scientist and half a year as a visiting professor (August 1989 to January 1990) at the Center for Auto-mation Research, University of Maryland, College Park, Mary-land. His research interests include computer vision, pattern recognition, virtual reality, as well as parallel algorithms and architectures. Dr. Chen is a Fellow of International Association for Pattern Recognition (IAPR). He was the founding President of the Chi-nese Society of Image Processing and Pattern Recognition in Taiwan, a member society of IAPR. He received the Outstanding Engineering Professor Award from the Chinese Institute of Engineers and the Outstanding Research Awards from the National Science Council of Taiwan.