Ž .
Materials Letters 46 2000 175–180
www.elsevier.comrlocatermatlet
Wire drawing conducted in the R-phase of
TiNi shape memory alloys
S.K. Wu
a,), H.C. Lin
b, Y.C. Yen
a, J.C. Chen
a aInstitute of Materials Science and Engineering, National Taiwan UniÕersity, Taipei 106, Taiwan b
Department of Materials Science, Feng Chia UniÕersity, Taichung 407, Taiwan
Received 7 January 2000; received in revised form 17 May 2000; accepted 18 May 2000
Abstract
The wire drawing conducted in the R-phase of TiNi shape memory alloys shows that the drawing stress in the R-phase is lower than that in the parent B2 phase and B19X martensite. This feature is ascribed to the R-phase having lower shear modulus. The martensite can be stress-induced by cold drawing in the R-phase. The cold drawing and subsequent annealing conducted in the R-phase can significantly affect the transformation temperatures and transformation heats of the drawn wires. q 2000 Elsevier Science B.V. All rights reserved.
Keywords: TiNi shape memory alloys; R-phase; Wire drawing; Stress-induced martensite in R-phase; Transformation temperature and heat;
Drawing stress
1. Introduction
TiNi alloys are an important class of shape
mem-Ž .
ory alloys SMAs . They exhibit not only the shape
Ž . w x
memory effect SME 1 , but also unusual
superelas-Ž . w x w x
ticity SE 2,3 and high damping capacities 4,5 .
These properties, along with their superior ductility, strength, fatigue and corrosion resistance, have re-sulted in many applications of TiNi SMAs, in which the use of TiNi wire is dominant. In wire applica-tions, TiNi SMAs are usually produced as wire springs, hollow wires or various nonregular shapes
w6–9 . Recently, ultra-fine or hollow TiNi wires havex
been developed and have shown improved SME,
)
Corresponding author. Tel.: 363-0231; fax: q886-2-2363-4562.
Ž .
E-mail address: [email protected] S.K. Wu .
which is enhanced by their high cooling rates during the cooling process. There are many promising appli-cations for these wires in products like microactua-tors and microsprings. Therefore, the understanding of drawn wire properties is important for TiNi SMA’s applications.
As mentioned above, TiNi wire products have many potential applications. The roadblocks to their development, however, are caused by difficulties in the manufacturing process. It is well known that TiNi alloys can be tensile-deformed in a ductile
w x
manner to more than 50% strain prior to fracture 1 . But severe strain hardening, accompanied by cold-working and wire-drawing, hinders their workability. To overcome this difficulty, some special wire draw-ing processes have been developed, such as dieless
w x w x
drawing 10 and clad-chip extrusion 11 . However, these new processes still have some technical limits
00167-577Xr00r$ - see front matter q 2000 Elsevier Science B.V. All rights reserved.
Ž .
As well as the parent B2 phase and B19X marten-site, TiNi SMAs can exhibit the R-phase at room temperature under the following conditions:
1. The introduction of rearranged dislocations which
w x
are produced by thermal cycling 13,14 or cold-working and then annealing at low temperatures
w15,16 .x
2. The introduction of precipitates by heat treatment at temperatures between 3008C and 5008C for the
w x
Ni-rich alloys 17–19 .
3. The addition of certain third elements that
sup-w x
press martensitic transformation temperatures 20 .
The B2lR-phase of TiNi alloys exhibits the
thermoelastic behaviors as the B2lB19X martensite
w17 . It is expected that the R-phase has similarx
drawing properties as the B19X martensite. Hence, it
is important and valuable to understand the wire-drawing properties of the R-phase. The aim of this study is to investigate the wire-drawing properties of TiNi SMAs conducted in their R-phase. At the same time, the transformation behavior of TiNi wires with various degrees of cold drawing conducted in the R-phase is also discussed.
2. Experimental procedure
The conventional tungsten arc-melting technique
was employed to prepare the Ti Ni , Ti50 50 49.7Ni50.3
Ž . Ž
and Ti Ni49 51 all in at.% SMAs. Titanium purity:
The drawing machine and the wire head machine
w x
have been illustrated in our previous paper 12 . A drawing die of tungsten carbide was used in this study. The drawing process can be conducted under the controlled speed of 5–20 mrmin and the draw-ing force can be recorded in situ by an S-type Load Cell. The transformation behavior was studied by
Ž .
using differential scanning calorimetry DSC mea-surement. A Du Pont 9900 thermal analyzer equipped with a quantitative scanning system 910 DSC cell was used to control the heatingrcooling rate on samples encapsulated in an aluminum pan. Tempera-tures were ranged from y208C to q1408C with a heatingrcooling rate of 108Crmin. The heat of transformation, D H, from the area under the DSC peak was automatically calculated using the equip-ment software packages. The XRD analysis was carried out at room temperature with the Philips PW1710 X-ray diffractometer under the conditions of Cu K a radiation, 30 kV tube voltage, and 20 mA current.
3. Results and discussion
Ž .
Fig. 1 a–c shows the experimental results of
DSC measurements for three R-phase-treated TiNi
alloys: A — Ti Ni , B — Ti50 50 49.7Ni50.3 and C —
Ti Ni . The two separated peaks in the cooling49 51
cycle indicate that the R-phase transformation can appear prior to the martensitic transformation for these alloys. Obviously, these R-phase-treated TiNi
Ž .
Fig. 1. DSC curves for the R-phase-treated TiNi alloys: a
Ž . Ž . Ž . Ž . Ž .
Ti50Ni50A alloy; b Ti49.7Ni50.3B alloy; c Ti49Ni51C al-loy.
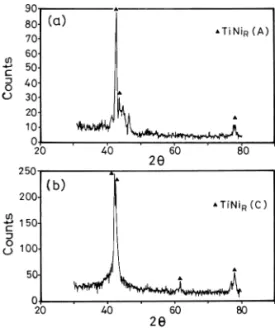
alloys exhibit the stable R-phase at around room temperature during cooling. The existence of R-phase for these alloys can also be observed from the XRD
Ž .
measurements. Fig. 2 a,b shows the XRD patterns measured at room temperature for the R-phase-treated
Ž . Ž .
alloys Ti Ni50 50 A and Ti Ni49 51C , respectively.
The typical XRD spectra of the R-phase of TiNi
SMAs, but not the parent B2 phase or B19X
marten-Ž .
site, are observed in Fig. 2 a,b .
In Fig. 3, curves A, B and C show the drawing stress vs. drawing temperature for these
R-phase-Fig. 2. XRD patterns measured at room temperature for the
Ž . Ž . Ž .
R-phase-treated TiNi alloys: a Ti50Ni50A alloy; b
Ž .
Ti49.7Ni50.3B alloy.
Ž . Ž .
treated alloys — Ti Ni50 50A , Ti49.7Ni50.3B and
Ž .
Ti Ni49 51C , respectively. Here, the drawing stress is
defined as the drawing force divided by the wire cross-section area. As can be seen in Fig. 3, for all these TiNi alloys, the drawing stress in the R-phase is mostly lower than that in the parent B2 phase and
the B19X martensite. The lower shear modulus of
R-phase than those of B2 phase and B19X martensite,
w x
as found in the internal friction measurement 19 , is responsible for its lower drawing stress. The lower the shear modulus, the easier the plastic deformation and hence the lower the drawing stress. With careful
Fig. 3. The drawing stress vs. drawing temperature for the
R-Ž . Ž . Ž .
phase-treated TiNi alloys: a Ti50Ni50A alloy; b
Ž . Ž . Ž .
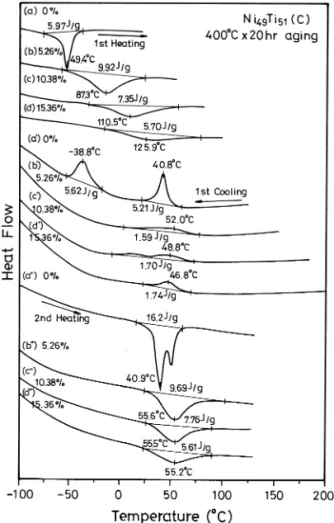
Fig. 4. DSC curves of the first heating cycle, the subsequent cooling and the second heating cycle, respectively, for the 4008C
Ž .
=20 h aged Ti Ni49 51C alloy specimens with various degrees of cold drawing conducted in the R-phase.
examination of A, B and C curves in Fig. 3, we find that the drawing stress minima occur at around the
range of R™M transformation temperatures, as
in-dicated by the arrows. Besides, the drawing stress
around the B2™R transformation temperature is
lower than that of B2 phase. These features implicate
that the B2™R and R™M transformations are
related to the phenomenon of Alattice softeningB, a
behavior that is similar to the B2™M
transforma-tion, which occurs as a AsoftB mode in a particular
w x
crystallographic orientation 21,22 .
Ž . Ž X X. ŽY Y.
Fig. 4 a–d , a –d , a –d shows the DSC curves
of the first heating cycle, the subsequent cooling cycle and then the second heating cycle,
respec-Ž .
tively, for the 4008C = 20 h aged Ti Ni49 51C
speci-mens with various degrees of cold drawing
con-DSC peak in the measured temperature range, though
partial R™M transformation may occur.
Ž .3 The reverse transformation temperature in the
Ž ŽY Y..
second heating cycle Fig. 4 a –d appears at a
lower temperature than that in the first heating cycle, and the associated D H value decreases as the degree of cold drawing is increased.
These phenomena can be explained as follows: Fig. 5 shows the XRD pattern measured at room
Ž .
temperature for the aged Ti Ni49 51C specimen
sub-jected to a 10.38% cold drawing at room tempera-ture. As well as the R-phase, some martensite spectra
appear in Fig. 5. This indicates that the R™M
transformation can be stress-induced by cold draw-ing in the R-phase, a behavior that is similar to the
stress-induced B2™M martensite in the B2 phase.
The R-phase-treated Ti Ni49 51 alloy has been
re-ported to have the stress induced R™B2
transfor-Fig. 5. The XRD pattern measured at room temperature for the
Ž .
aged Ti49Ni51C alloy specimen subjected to 10.38% cold draw-ing in the R-phase.
w x
mation under an applied stress 23 . Therefore, the result of Fig. 5 may also come from the stress
induced R™B2 and then stress induced B2™M
serial transformations. This causes that the M™B2
and R™B2 transformational D H values of Fig.
Ž .
4 b,c during the first heating cycle are higher than
Ž .
that of as-aged specimen of Fig. 4 a in which the
D H value only associates with the R™B2
transfor-mation. However, during the cold-drawing process, lots of deformed structures and defects are intro-duced. These deformed structures and defects can
w x
stabilize the R-phase and the martensite 24 , hence, the reverse transformation temperature of the first
Ž Ž ..
heat cycle Fig. 4 b–d shifts to a higher one. The
more the degree of cold drawing, the higher the reverse transformation temperature. In the same way, the decrement of transformational D H value for the specimens with the degree of cold drawing P 5.26%
ŽFig. 4 b–dŽ .. is also closely related to these
de-w x
formed structures and defects 25 .
After the first reverse transformation, the stabi-lization of R-phase and stress-induced martensite dies out and the subsequent martensitic transforma-tion temperature is depressed by the retained
disloca-Ž X X. w x
tions, as shown in Fig. 4 b –d 24 . The amount of
retained dislocations should be proportional to the degree of cold drawing. The higher the dislocations retained in the cold-drawn specimens, the lower the martensitic transformation temperature they have.
Ž
Therefore, in the measuring temperature range down
.
to y1008C , less R-phase is transformed to the martensite for the specimen with higher degree of cold drawing because its martensitic transformation is more depressed. This phenomenon can also be responsible for the smaller transformational D H
Ž Ž Y Y..
value in the second heating cycle Fig. 4 b –d for
those specimens with severe cold drawing. Mean-while, because of the die-out of the R-phase
stabi-lization, the R™B2 transtemperature in the second
heating cycle recovers to a lower temperature than that occurred in the first heating cycle.
It is also well known that the R-phase transforma-tion can be assisted by the coherent stress around the coherent boundaries between the matrix and the
w x
Ti Ni11 14 precipitates 26 . However, these coherent
boundaries can be partially destroyed by cold
draw-ing. Hence, the transformable volume of B2™R
during the cooling process should be decreased and
the associated D H value is also decreased for the
Ž X X.
cold-drawn specimen, as shown in Fig. 4 b –d .
4. Conclusions
1. The drawing stress of TiNi wire drawing in the R-phase is lower than that in the parent B2 phase
and B19X martensite. This feature is ascribed to the
lower shear modulus of the R-phase. The drawing stress minima appear around the transformation
tem-peratures of B2™R and R™M transformations.
2. The stress-induced R™M transformation can
occur at TiNi SMAs cold-drawn in the R-phase. This
behavior is similar to the stress-induced B2™M
transformation observed in the B2 phase. The martensite observed in the cold-drawn R-phase wire
may also come from the stress-induced R™B2 and
then stress-induced B2™M serial transformations.
3. The cold drawing and the subsequent annealing conducted in the R-phase introduce and then annihi-late the deformed structures and defects and can significantly affect the transformation temperatures and transformation heats of the drawn wires.
Acknowledgements
The authors are pleased to acknowledge the finan-cial support of this research by the Tjing Ling Re-search Institute, National Taiwan University, under Grants No. 82-G-10 and 83-G-10, and by National
Ž .
Science Council NSC , Republic of China, under Grant NSC83-0405-E002-011.
References
w x1 S. Miyazaki, K. Otsuka, Y. Suzuki, Scr. Metall. 15 1981Ž .
287–292.
w x2 S. Miyazaki, Y. Ohmi, K. Otsuka, Y. Suzuki, ICOMAT-82,
Ž .
J. Phys. 43 1982 C4255–C4260.
w x3 S. Miyazaki, T. Imai, Y. Igo, K. Otsuka, Metall. Trans. A 17 Ž1986 115–120..
w x4 H.C. Lin, S.K. Wu, M.T. Yeh, Metall. Trans. A 24 1993Ž .
2189–2194.
w x5 H.C. Lin, S.K. Wu, Y.C. Chang, Metall. Trans. A 26 1995Ž .
851–858.
w x6 C.M. Jackson, H.J. Wagner, R.J. Wasilewski, NASA Spec.w
x Ž .