Tao, Y.-H., Cheng, C.-J. and Sun, S.- Y, What influences college students to continue using business simulation games? The Taiwan experience, Computers & Education,
Vol. 53, No. 3, 2009, 929-939
What influences college students to continue using Business
simulation games? The Taiwan experience
Abstract
Previous studies have pointed outthatcomputergamescould improvestudents’ motivation to learn, but these studies have mostly targeted teachers or students in elementary and secondary education and are without user adoption models. Because business and management institutions in higher education have been increasingly using business simulation games in recent years, factors influencing the continuing use of business simulation games by higher-education students are worth probing into. This research adopted the technology acceptance model, expectation confirmation theory, and agency theory as its theoretical base. Moreover, learning motivation and classroom climate from the perspective of learning, as well as perceived attractiveness and perceived playfulness from the perspective of emotion were also added to the final research model. A total of 185 valid student respondents in Taiwan’s higher education who have used business simulation games in their classes participated in the survey. The results show that perceived playfulness and learning performance positively influencestudents’satisfaction,which further influence the intention to use computer simulation games. Furthermore, perceived ease of use and perceived attraction play a critical role in determining perceived playfulness. Perceived ease of use was also positively influenced by perceived attraction. The research results on the students’perspective provide a strong support for the teachers to adopt or continue using computer simulation games in classrooms. However, the agency theory failed to be sustained as a useful tool in motivating students’ learning activities, which is worthy of further research.
Keywords: country-specific developments, evaluation of CAL systems, improving classroom teaching, interactive learning environments, media in education
1. Introduction
Ever since technology was used on games, from the early electronic toys, TV video games, and computer software games up to the latest online game, players have been attracted to these electronic games (Mumtaz, 2001). In the existing literature, there is a close relation between educational simulation games and learning. Randel, Morris, Wetzel and Whitehill (1992) discovered that educational simulation games
can increase the motivation to learn. Terrell and Rendulic (1996) specifically indicated that games increase the students’internal motivation as well as their learning performances. Interestingly, Prensky (2003) pointed out that from the perspective of successful learning, motivation is an indispensable condition and that games just happen to provide such a condition. In their experiment, Schwabe and Göth (2005) applied games in their learning activities, which not only increase the motivation of the students but also increase the opportunity for them to interact with each other.
At present, most computer games emphasize the commercial benefits or leisure aspects, while only a few focus on the curriculum teachings of higher education and business management (Ebner and Holzinger, 2007; Virvou and Katsionis, 2008), the effect of learning on gaming environments, and the factors that influence the teaching designs (Garris, Ahlers and Driskell, 2002; Leemkuil, de Jong, de Hoog and Christoph, 2003).
Although the decision to use business simulation games is made by the teacher, the students’perception is equally important in promoting the inclusion of business simulation games in classrooms for three reasons. First, like other technology adoption in education, the teachers would normally like to know the students’ response to the new technology. Most teachers interviewed in this study expressed such eagerness and even helped to administer the survey. Second, based on Prensky’s (2003) claim that games provide an indispensable motivational condition for students’ learning, students may be more interested in choosing courses that incorporate business simulation games in the instructional activities. However, word-of-mouth from other experienced students may be more critical to their final decisions. Third, for the millennium generation born after 1981, using technology in their learning is but natural (Murphy and Smark, 2006) and games have become popular tools for informal learning (Kapp, 2006). It is therefore important to know how the millennium college students think the business simulation games are being promoted for their formal learning (Lim, 2008; Prensky, 2008). Based on these three reasons, students’ responses to classes using simulation games is a critical indicator of the widespread use of simulation games in higher education, which is also why this study targets the students.
How do Taiwan’s college students fare? Due to the rapid increase in number of higher educational institutes to over 160 during the last 15 years, Taiwan’s college entrance rate has reached nearly 100 percent as of 2008. The elite- to popular-oriented education reform has bred the issue of decreasing student quality, such that 87 percent of the college students and 80 percent of the parents have agreed that the quality of college students is low, and 78 percent of college professors have agreed that the
quality of college students is worse than that 10 year ago (Hsu, 2006). According to the national surveys, for the 2005 junior college students, 20.3 percent of them never or hardly participated in class activities; 29.9 percent often and sometimes avoided attending classes; and 49.7 percent often or sometimes did irrelevant things in class (Liu, 2006). These findings are supported by a 2003 national survey where 36 percent of college professors evaluated the students’learning attitude in class to be negative (Ru, 2007). Chiu (2007), whose findings were part of the same national survey database, attributed the cause to the fact that over 30 percent of students were busy with part-time jobs and other activities like online chatting instead of studying. Corollary to this, over 50 percent of the 2003 freshmen spent less than an hour per day on schoolwork, and this did not improve when they became juniors in 2005. This poses a big challenge for Taiwan’s higher education institutes.
On the other hand, up to 40 percent of the 2005 college junior students were not satisfied with their college learning achievements (Liu, 2006). In addition, they admitted that teacher-student interactive learning, implementation of experiment or research, student group discussion and presentation, research report of self-selected topic, and problem-solving are the most desirable instruction methods for increasing their learning achievement (Fu, 2007). Therefore, some technology-enabled instructional tools such as business simulation games and Student Response Systems (Tao and Yeh, 2009) have become emergent trends in Taiwan over the last few years. These instructional tools assist the teachers in meeting the methods of instruction that students prefer for better student learning achievements. However, the perceived effects of these technology-enabled instructional tools have not been empirically tested especially on a national or regional scope.
To understand the intention of the challenged Taiwanese college students to continue using business simulation games, the main objective of this study is to construct an appropriate research model to empirically test experienced students’ perceptions of Taiwan’s status-quo business simulation games and their future intention to use these games. In general, many theories and models from different domains may contribute to the intention to continue using business simulation games. Thus, a secondary objective is to propose a research model that is sophisticated enough to represent the complexity of the research issues yet with a high feasibility for an adequate empirical testing according to the observations in literature and Taiwan’s physical environment, as well as opinions from in-depth interviews with experienced teachers and students. In the remaining sections of this article, the background information for establishing a common ground of understanding before introducing the research methods is provided first; these are followed by the data analyses, discussions and conclusions.
2.
Background Theories and Information
Before describing the proposed research model, related background theories and information based on literature analysis and interview results are briefly summarized in this section to serve as a common ground. These are the Technology Acceptance Model (TAM), Expectation Confirmation Theory (ECT), Agency Theory (AT), educational theories of Constructivism and Motivation, and Taiwan’s business simulation games.
2.1 Technology Acceptance Model
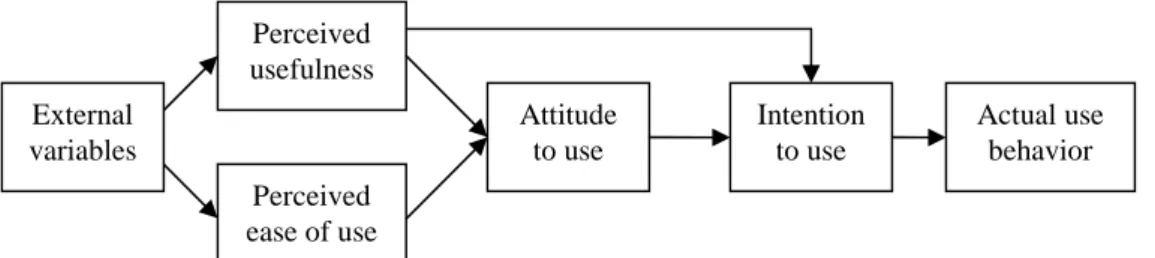
Davis, Bagozzi and Warshaw (1989), citing the Theory of Reasoned Action (TRA) by Fishbein and Ajzen (1975), points out that TAM is mainly used to explain the degree of acceptance of information technology by a person, while perceived usefulness (PU) and perceived ease of use (PEU) explain the two most important factors affecting the behavior of using technology. TAM can explain the willingness of a user to accept a new technology, and at the same time it can also analyze the relevant factors that influence the degree of acceptance of a user. As shown in Figure 1, when a person uses a certain technology, TAM can be used to discuss which externalfactorsinfluencetheuser’sinternalbeliefs,attitude, and intention, and thus, further influence the condition of the usage of technology.
Since its appearance, TAM has been revised or extended by many scholars to such forms as TAM 2 (Venkatesh and Davis, 2000) and the Unified Theory of Acceptance and Use of Technology (Venkatesh et al., 2003). In addition, it has been cited more than 700 times (Davis, 2007). Recently, there has been some critiques and future suggestions for TAM studies in an issue of the Journal of Association for Information Systems (Bagozzi, 2007; Benbasat and Barki 2007; Goodhue, 2007; Schwarz and Chin, 2007; Straub and Burton-Jones, 2007; Venkatesh et al., 2007). Nevertheless, PEU and PU remain to be the two most robust components in several recent TAM meta-analyses (Ma and Liu, 2004; King and He, 2006; Schepers and Wetzels, 2007; Yousafzai et al., 2007).
2.2 Expectation Confirmation Theory
Oliver (1980) proposed the ECT in the area of marketing as depicted in Figure 2. ECT implies that the initial tendency to purchase the commodity will affect the consumer’sbehaviorto purchaseitthenexttime.Ifthelevelofsatisfaction fora commodity oraserviceishigh,itwillincreasethebuyer’s willingness to purchase again and vice versa (Churchill and Surprenant, 1982). Bhattacherjee (2001a) proposed an information system continuance model that relates satisfaction and perceived usefulness to the degree to which users’expectationsaboutan information
system are confirmed. Thus ECT is used to discuss and understand the continued use of information technology.
ECT has been studied more intensively recently in information-related domains. A significant portion of recent empirical studies has shown its integration with TAM for a more comprehensive research framework in such applications as online brokerage (Bhattacherjee, 2001b), e-learning (Chiu et al., 2005; Roca et al., 2006), and mobile Internet services (Hong et al., 2006). The importance of ECT is growing. It is even suggested by Davis (2007) as a prominent candidate theory to be considered together with TAM in future research directions.
2.3 Agency Theory
The AT came into being during the period 1960–1970. An economist used the idea of risk sharing to discuss the relation among human beings and the relation between an individual and an organization. Afterwards, this idea was applied by Jensen and Meckling (1976) in the agency relation among human beings and thus AT was developed. They define agency relationship as the situation where a principal assigns a work to an agent, thereby granting the agent certain authorities; their agency relations normally exist based on a contract. Eisenhardt (1985) defines AT as the way to best organize relationships in which the principal determines the work, while the agent undertakes to complete it. AT in the past studies was used to discuss the use of incentives and control mechanisms to drive the staff (Bhattacherjee, 1998; Eisenhardt, 1989).
2.4 Constructivism and Motivation Theories
The constructivism theory and motivation theory are two educational theories most related to students’perception of business simulation games. Merrill (1991) claimed that teaching activities should not merely be designed for teaching but for learning as well. From the view of constructive learning, the roles of teachers and students have changed from the scenario of teachers playing the role of instructors in the past to a situation where assistants, directors, and coaches are now tasked with establishing a suitable learning environment for the learning content. However, the students who played passive roles just accepting information have now become active learners, who voluntarily build complete knowledge in a learning environment.
Shen (2008) pointed out that the education simulation games are designed for use in an environment that allows students to apply the knowledge they have acquired. The principle of constructivism is suitable for the environment of business simulation games because the users put the existing business management knowledge to use, in order to make use of the software to establish a new concept and emphasize on the
importance of interaction between teachers and students.
“Motivation”, on the other hand, meansthecauseofthelearner’sactivityand the maintenanceofthelearner’sactivity through which thepositivegoalofthelearner’s internal motivation is addressed. It is one of the key factors of the influence of learning performances. However, the motivation of learners, their thoughts, and ideas might not completely be the same; thus these motivations can be further classified into the theory of behavior, humanism, and cognition.
First, the motivation theory of behavior implies that motivation comes from learning, and stresses the application of reinforcement to establish a link between stimulation and reaction to make the most of the reinforcement theory in promoting learning as well as the cause and maintenance of motivation (Chang, 2001). Next, humanism is regarded as a need in motivation and it proposes the need-hierarchy theory, which may be classified into five levels represented by Maslow (Li and Shan, 1997). This implies that the responsibility of a teacher is not only to impart knowledge but also to provide a suitable learning environment (Chang, 2001). Finally, the principle of cognition implies that human motivation includes a plan, a goal, an expectation, a reference and a not-so-simple decision as to whether or not an individual must be rewarded or punished (Stipek, 1993). In other words, our behavior is not only controlled by the instincts and the incentives we receive (Li and Dan, 1997), but is also influenced by what we think, what we believe, and what we expect.
2.5 Business Simulation Games in Taiwan
In Taiwan, the Top-Boss Corporation (http://www.top-boss.com.tw) is the major provider of business simulation games, offering products such as the Business Operations Simulation System (BOSS), Marketing Winners, Distribution Master, and Beer Games. Another business simulation game provider is Pitotech Corporation (http://www.pitotech.com.tw) which offers Virtual Business Management, Virtual Business Retail, and Virtual Business Sport games but has a much smaller market share in Taiwan. The meaningful differences of these business simulation games and their educational values are as intuitive as their names. BOSS is a general business operation game, while Marketing Winners is a marketing game. Distribution Master is a logistic game, while Virtual Business Retail is a retail game. Other related vendors such as APEX International Corporation (http://www.apex.com.tw) which offers the Virtual Stock Exchange game are not appropriate candidates for this study aiming at business management.
In recent years, Top-Boss Corporation has successfully promoted their products to higher education institutes through such means as free trials, workshops, training camps, and sponsorships of national business simulation game competitions. As a
result, the earliest product of BOSS game has become the most popular business simulation game adopted in higher education institutes and in national competition games. Logically, Top-Boss Corporation is named after its flagship product the BOSS simulation game. Most of their games are cross-functional decision-making games. Take BOSS for example. It is a general operational game which includes functional areas of production, sales, procurement, research and development, and finance. Consequently, with multiple expertise and four difficulty levels, the collaborative decision-making BOSS game is a good training tool not just for business majors but also for corporate managers. As TOP-Boss has been able to set up the Chinese Web-based interface on all their business simulation games, it has been expanding their market to China’s universities and business corporations in recent years.
As these business simulation games are team based and competition oriented, most of the teachers we interviewed or spoke to in the workshops incorporated BOSS or other games in their curriculum as group competition activities. The activity is usually repeated several times in a row several days apart due to its round of game play nature. In addition, for those teachers who use these games throughout most of the semester, the rationale of the different expertise of business decision making in the games was used to illustrate the knowledge and applications of the targeted course subjects in class.
Due to the play-by-round mechanism of these business simulation games, each group of students competes with others in each round by entering the required parameters in many Web-based forms. To complement the form-by-form game playing process, graphical reports or visual performance data are also available for the users to increase their usability and learning interest during the games.
3.
Research Methods
The primary objective of this study is to understand how students perceive business simulation games and consequently their intention to continue their use. Briefly speaking, the integrated research model considers the variables of adoption, incentive, emotion, and selected educational theories of constructivism and motivation based on the literature analysis and teacher interviews. As the focus is on the experienced students’intention to continue using business simulation games in future classes, ECT is the targeted base model. However, Premkumar and Bhattacherjee (2008) imply that the idea of TAM and ECT in the intention to use information technology is complementary in nature. In other words, TAM can explain the acceptance behavior before the adoption, while ECT can explain the behavior of continuance of use. Although several studies have integrated TAM and ECT in their
research models (Bhattacherjee, 2001b; Chiu et al., 2005; Roca et al., 2006; Hong et al., 2006), the process with which they were synthesized varied significantly. Therefore, model construction is introduced from a high-level perspective first, followed by the summary of the hypotheses supported by references.
3.1 Research Model Derivation
King and He (2006) proposed a TAM component structure that dissects TAM into the core TAM and four other categories, namely, prior factors to the TAM component, factors suggested from other theories, contextual factors to the TAM component, and consequent factors such as attitude, perceptual usage, and actual usage. According to King and He (2006) and other TAM meta analyses (Ma and Liu, 2004; Schepers and Wetzels, 2007; Yousafzai et al., 2007), it is not possible to comprehend the factors affecting TAM in this ECT-focused research. Nevertheless, it is important to learn from the TAM literature how it can be integrated with ECT to perfect the research object.
Two of the five suggestions concluded from Benbasat and Barki’s (2007) TAM meta-analysis can be taken as guidelines in integrating the base research model. First, a number of studies emphasize the importance of perceived usefulness (PU), but only a few are devoted to the discussion of the factors that cause usefulness. Therefore, Benbasat and Barki (2007) suggested finding out the factors that influence the PU and perceived ease of use (PEU). Second, while TAM forecasts the degree of actual usage of software by a user, it only stresses on the frequency and the number of times of its usage. Thus, this simple way of explaining the degree of usage of a software is deficient (Delone and McLean, 2003; Doll and Torkzadeh, 1998), leading the TAM researchers to neglect other important behaviors of users (Nambisan, Agarwal and Tanniru, 1999). Schwarz and Chin (2007) also had similar suggestions for the above point.
Based on the above suggestions, the integrated research model, as seen in Figure 3, can be derived accordingly, which is explained step by step below.
First, how can TAM and ECT be logically integrated for the adoption and continuance of use of business simulation games? According to Benbasat and Barki’s (2007) second point, this research substitutes the learning performance in place of the usage intentions and actual usage of TAM. Since the actual usage of business simulation games will produce performance, using learning performance to measure the actual usage will result in a much significant meaning in practice. Furthermore, the cognitive performance of ECT is compatible with the learning performance modified for TAM, thereby providing TAM and ECT a fine linking point between them. The rationalization is as follows: Traditional ECT must collect the three variables, namely, expectations, cognitive performance, and confirmation. In fact,
each paired measurement items of expectation and cognitive performance only differ in how the same question is presented before and after the technology adoption. Meanwhile, each measurement item of confirmation repeats the same question of the paired measurement items of expectation and cognitive performance except for their difference (Premkumar and Bhattacherjee, 2008). Therefore, the level of expectation can be inferred through the difference between the counterpart of cognitive performance and confirmation. This is evidently supported by existing studies such as those by Bhattacherjee (2001b), Roca, Chiu and Martínez (2006) and Thong, Hong and Tam (2006), which only concentrate on the confirmation.
Second, how can incentives be added into the base model of TAM and ECT in order to encourage students to engage themselves more in class activities? In the learning environment of business simulation games, the teachers and students share a similar relation to that between managers and employees in business organizations like the AT that explores the use of incentives and control mechanisms to motivate staff in order to reduce the negative effects developed when a goal faces a conflict. In addition, the e-learning studies on user typology reveal that teachers (Tao, 2008) and students (Tao and Yeh, 2008) have very different cognitive types clustered from the same measurement items. Therefore, AT should be appropriately applied to this research to explore the insightfulness of teacher–student relationships. According to the AT, the teacher is regarded as the principal and the student is regarded as the agent. Incentives can encourage a student to learn using an business simulation game. Among the two incentive types (Bergen, Dutta and Walker, 1992), only the impact of the result-oriented incentives in learning is considered inasmuch as this research is based on the performance of the actual incentive. Therefore, the two moderating variables, risk aversion and goal conflicts, in result-oriented incentives (Bhattacharjee, 1998) should also be included in the research model.
Third, because games bring fun and pleasure into formal learning settings, emotional factors are necessary to be brought into the research model to observe their impacts on the base model of TAM and ECT. According to Ha et al. (2007), emotion-related factors include cognitive playfulness (Moon and Kim, 2001; Lin et al., 2005), perceived enjoyment (Davis, et al., 1992; Hsu and Lu, 2004), cognitive attraction (Tractinsky, Katz and Ikar, 2000; Heijden, 2003), flow experience (Hsu and Lu. 2004), and perceived sacrifices. Moon and Kim (2001) agreed that in the view of TAM, it cannot be completely explained how playfulness affects the attitudes and actual behavior of a human being. However, Bagozzi (2007) particularly pointed out that emotions may affect human behavior. Emotional related factors are expected to be provided through the use of business simulation games, which is quite different from the objective of performance improvement from general information systems.
However, the proposed integrated model cannot accommodate all the emotional factors. As such, the pleasure and fun provided by business simulation games, unlike commercial online games, may not be that great in breadth and scope. Therefore, based on the literature analysis and teacher interviews, this research includes two emotion-related factors, cognitive playfulness and cognitive attractions, in the research model. More importantly, these two emotional factors can be regarded as the cause for PU and PEU, which matches the first point of Benbasat and Barki (2007) as mentioned above. Note that these two emotional factors are the only prior factors affecting PU and PEU in this study. Other factors are redirected to address ECT starting from the performance factor downwards.
Finally, the primary reason for using business simulation games is to motivate students to participate in class learning activities, as well as to construct their knowledge by playing the games with rationalized thinking. This is supported by the national survey of Taiwan’s college students (Fu, 2007) which confirms that teacher-student interaction, collaborative learning, experiment or implementation, and problem-solving are helpful in their learning. Furthermore, the desire for learning achievement of Taiwan’s college students matched the concept of the learning pyramid originally proposed by Dale Cone. This was later ranked by different scholars with proximate learner retention rates of 90 percent (teaching others), 75 percent (practicing what was learned), 50 percent (group discussion), 30 percent (seeing a demonstration), 20 percent (audio-visual), 10 percent (reading), and 5 percent (lecture) (Lalley and Miller, 2007).Hence, the theory of motivation and the theory of constructivism are appropriately added in this research. These two theories point out the factors of the importance of learning through appropriate motivation and teacher-student interactions. Moreover, classroom climate is a naturally formed atmosphere that occurs during the teaching and learning activities, where the teachers and the students interact with each other and includes how the students interact with their classroom environments (Walberg, 1979; Tsai, 1995). Thus, we can see that teacher-student interactions and classroom climates are closely related and that it is important to include classroom climates in the research model.
There are more theories and models that may potentially relate to the continuous usage of business simulation games. However, considering all of them can make the proposed research model in Figure 3 more complicated and not feasible for empirical testing. Consequently, if only to serve as an initial investigation of college students’ perception of the continuous usage of business simulation games, the proposed research model is practically feasible while theoretically complicated enough to explore the research objectives, as well as serves as a base model for related future research.
3.2 Hypotheses and Measurement
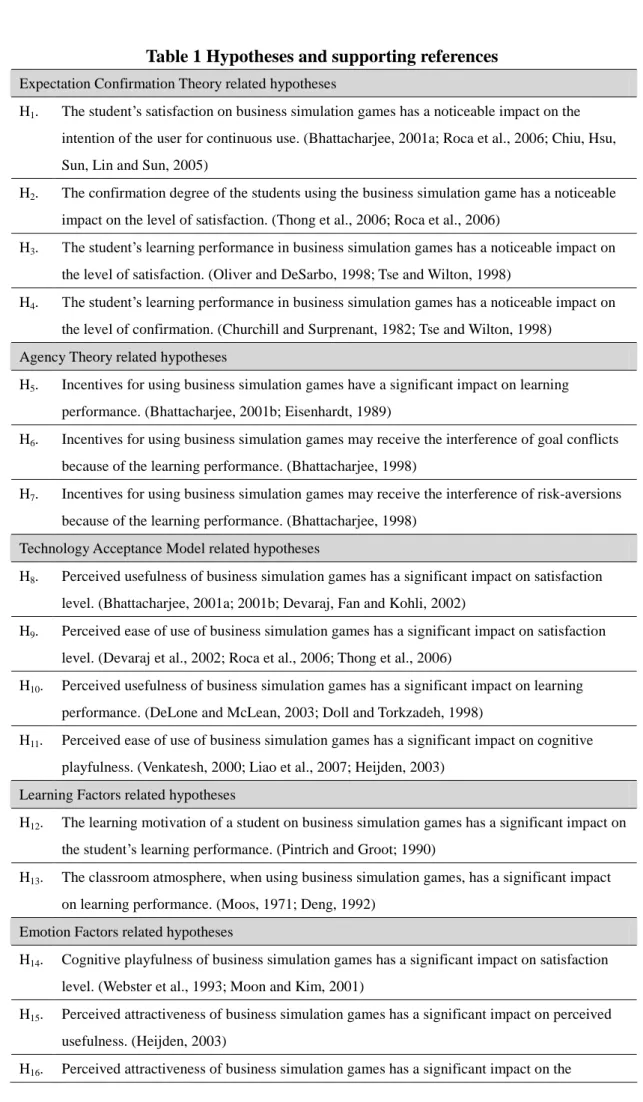
In Figure 3, hypotheses H1–H17 can also been seen, which are summarized in
Table 1 by their originating theories with corresponding supporting references to avoid lengthy description of their derivation process. Accordingly, the measurement items for the factors in the hypotheses can be adopted and modified from the supported references as indicated in Table 2 for displaying the reliability analysis of the factors.
As this study targets college students who have taken courses using business simulation games in class activities, all universities in Taiwan are considered. Due to the limitations of the national base of student population, it is not easy or feasible to collect the objective educational gains of students from 160 potential Taiwanese universities. Therefore, the students’perceptions of the proposed research model are incorporated in this study. This has a precedent in the TAM meta analysis of Yousafzai et al. (2007) where over half of the independent variables listed in the selected studies are categorized under the self-reported use or perception instead of the actual use of perception.
4. Data Analysis
Descriptive analysis and Partial Least Square (PLS) were used in this study in conducting the data analyses as shown below.
4.1 Sample Profile
This research put up the online survey for three weeks from 10 June 2008 to 2 July 2008. A total of 223 questionnaires were retrieved, but only 185 of them were considered valid responses.
A brief summary of the statistics analyzed is illustrated below: 34.1% of the students were male and 47.6% of the students had the habit of playing computer games. Majority of the students belonged to universities in southern Taiwan (58.4%), and majored in management (97.3%). Among the surveyed students, 76.2% have attended only one class that uses business simulation games and they mostly used BOSS (88.1%) and Distribution Master (34.1%), in their classes. The statistics indicates that 56.2% of students use the business simulation games for an hour or less after their classes. The three major factors that influence the students’use of business simulation games in their classes are: (i) the content of the game is interesting (63.2%), (ii) the games correspond with the basic requirements of the class (56.2%), and (iii) the games increase the level of participation within the class (56.2%).
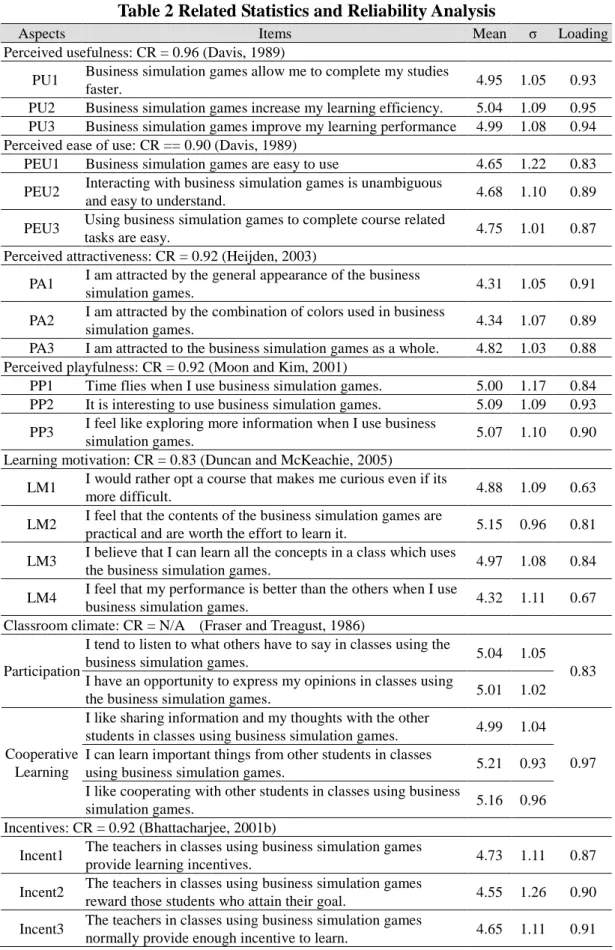
The results of the items in the reliability analysis is shown in Table 2, where the factor loading in each aspect of the items is greater than 0.5, and the internal consistency composite reliability (CR) values all exceeded 0.7, as suggested by Hair, Anderson, Tatham and Black (1998).
4.3 Validity Analysis
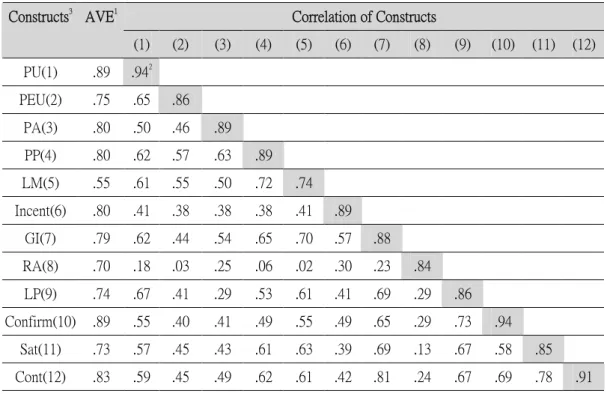
In Table 3, the value of the diagonal is shown as AVE, and the value of the non-diagonal is its coefficient. All AVE values lie between 0.55 and 0.89, satisfying the suggested > 0.5 by Forrell and Larker (1981), which indicates that the convergent validity of this research is acceptable. The discriminant validity in Table 3 indicates that every aspect of the square root of AVE exceeds the construct and other related coefficients of construct, therefore tallying with the suggestions of Chin (1998) that there is a discrimination between the constructs.
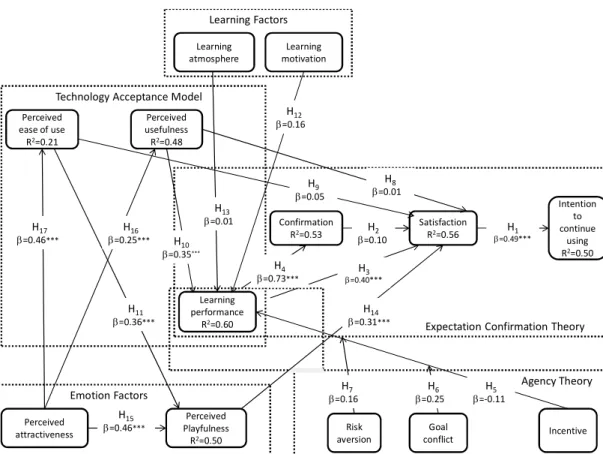
4.4 Model Verification
These 17 hypotheses were developed from five theories; thus, it is easier and more understandable to present the results of the model verification from the perspective of the five higher levels of theories in relation to the corresponding hypotheses. The results of the model verification are shown in Figure 4. Briefly speaking, most of ECT’s hypotheses are established, none of the AT’s hypotheses are established, all but the hypotheses of TAM regarding satisfaction are established, all hypotheses of learning factors are not established, and all hypotheses regarding the emotional factors are established.
5. Discussions and Findings
5.1 DiscussionsFollowing the same approach used in the Model Verification, the hypothesis testing results are discussed in more detail using the five theories.
Among H1 to H4in the ECT, the confirmation level has an obvious impact on the
satisfaction level in all hypotheses except H2, where confirmation has no significant
impact on students’satisfaction. Because Chui et al. (2005) also had similar results, the explanation maybe that business simulation games are edutainment (education and entertainment) oriented. The learning performance only needs to achieve an acceptable level rather than an outstanding level higher than one’s expectation.
None of the H5, H6, and H7 in the AT is established. The inter-organization IT
study of Bhattacharjee (1998) had similar results regarding the interference of goal conflicts and risk aversion. Therefore, there may be two reasons to explain the failure of AT in this study. First, from the descriptive analysis of student profile, we know
that after class, 81.6% of the students on average use the business simulation games for less than two hours. Therefore, the reason perhaps is that the time taken by the users to learn business simulation games is simply not enough, thus causing incentives to have an unnoticeable impact on students’learning performance. Second, our conjecture is that the wordings of the questions in the survey were not suitable because there was a big difference in the risk aversions that occurred in a working environment and a learning environment.
Among H8to H11in the TAM model, only the PU and PEU do not have obvious
impact on the satisfaction level. This result is different from the past studies of Bhattacherjee (2001a), Devaraj et al. (2002), and Hong et al. (2006) on Internet services, as well as Hayashi et al. (2004) and Roca et al. (2006) on the e-learning systems, but it matched with two studies on online (Hsu and Lu, 2004) and mobile games (Ha, Yoon and Choi, 2007). In particular, in Hsu and Lu’s (2004) online games acceptance model, the PU did not encourage the user’s willingness to use online games, but it affected the user’s attitude.This could perhaps be explained by the fact that education in the form of simulation games is clearly intended to impart education through entertainment. Therefore, the interesting features of the simulation games are what the student actually pays much attention to. Furthermore, it had been verified earlier that PEU had a noticeable impact on the users, but such impact gradually became less obvious in the later studies (Karahanna, Straub and Chervany, 1999). Therefore, this research conjectures that in the initial period of usage, the users realize that the simulation games are easy to use and will influence them in a positive manner. After using them for a while, however, the positive effects of the PEU of these games gradually become less noticeable; therefore it is concluded that PEU does not have an obvious impact on satisfaction.
Both hypotheses H12 and H13 in learning factors are not sustained. It is surprising
to conclude that both the motivation and atmosphere do not have significant impact on the students’learning performance through business simulation games. According to the additional comments provided by the student respondents, the possible reason could be that in a highly motivated learning group, there could still be students holding lower results, while in a low motivated learning group, there could still be students attaining high results. Therefore, we conjecture that learning motivation is just one of the factors that influence the learning performance. In other words, even if the learners have a high learning motivation, they still need to first possess enough knowledge so that while proceeding with the learning and operation of the simulation games, they could attain sufficient knowledge in the most efficient manner.
Hypotheses H14 to H17 on emotional-related factors are all established. Therefore,
business simulation games have significant influences on the PU and PEU, which could be taken advantage of by the instructors.
5.2 Findings
Based on the results of the hypothesis testing and the corresponding discussions, two extended findings are discussed below.
The first finding is the positive and negative messages about the emotional factors where the two leads in emotional factors are confirmed: the playfulness provided by the business simulation games has an important influence on the student’s continuing use of these games, while PU has an important influence on perceived playfulness, which was also supported in the case study of Heijden (2003) and Liao, Tsou and Huang (2007). Meanwhile, the attractiveness effect of the screen designs of business simulation games on the students influence the PU, PEU, and playfulness. On the other hand, two clues lead us to a different view. First, the average perceived attractiveness is 4.49 out of the seven-point Likert scale, which lies just between the average and the satisfied. Second, 81.6% of the students use business simulation games for less than two hours after their class. Accordingly, it may imply that current business simulation games do not attract the students as we had expected or at least do not sustain the students’interest long enough.
The second finding is that there are still valuable lessons to be learned from the failure of the AT hypotheses: First, incentives for students to use business simulation games do not guarantee a better learning performance, especially when the students do not spend enough time on these games after their class. Therefore, the teachers must acquire a balance between their teachings and students’hands-on practicing time to use the simulation games. Secondly, given a suitable learning guide, the teachers may better promote students’learning motivation and at the same time avoid unnecessary operations and learning (Azevedo and Cromley, 2004; Brusilovsky and Pesin, 1995). Therefore, the teachers do not only play the role of knowledge providers under a simulation games environment—their role may be changed to that of guiding learning, encouraging the learners through observation and discussion in interactive learning, and guiding the students to apply what they have learned in the simulation games (Robertson and Howells, 2008).
6. Conclusions and Future Work
Deviating from previous experimental-base studies mostly targeting teachers and students of the primary and secondary education, the primary research contribution of this study is establishing a research model and corresponding hypotheses for theorizing higher-education students’perception on business simulation games. In
general, the empirical students’perceptions provide adequate evidence for Taiwan’s teachers to adopt or continually use the business simulation games and to effectively integrate business simulation games into their teaching activities and strategies. The findings have two research implications. First, the results are representative of the whole Taiwan context, which has a broader scope not seen in business or educational simulation game studies. Second, the proposed research model can serve as a base model like TAM or ECT for future educational or business game studies in Taiwan or other regions.
On the other hand, many well-established hypotheses tested in this study for business simulation games did not show sustainability. Based on our observations, this gap needs to be narrowed through the accurate designing of business simulation games, as well as in the proper implementation of business simulation games in the course activities. This is implied by the findings in Section 5.2. To incorporate business simulation into the class activity, a teacher needs to play both roles of instructor and coach to complement the concept of the learning pyramid (Lalley and Miller, 2007) as described in Section 3.1. On the one hand, business simulation games require the players to equip themselves with adequate multidisciplinary knowledge of different functional areas to make competitive, synthesized decisions to win in the game. Thus, as instructor, the teacher needs to effectively organize systematic lecturing, multimedia demonstration, and group discussions. On the other hand, to improve students’learning retention and persuade them to practice what they have learned, as a coach, the teacher needs to encourage the students to rationalize their decision making by sharing and discussing with their classmates and teacher in and after class. Obviously, this is time-consuming and not regularly implemented in Taiwan. In addressing the failure of games in schools, Lim (2008) provided an excellent summary on how schools can transform their culture and practices by “re-designing the curriculum around driving questions that are meaningful to students, creating opportunities for different students with different needs, re-organizing the highly segmented school day by leveraging upon the outside-classroom experiences and expertise of students, and shifting assessments away from evaluative structures that function to support social reproduction and towards opportunities to support learning.”
For the game design, narrowing the gulf in attractiveness and playfulness between business simulation and commercial online games is the key. In addition to fun as one requirement for engagement, Prensky (2008) included goals, decision and discussion, emotional connection, cooperation and competition, personalization, and review and iteration to extract from the best commercial games those factors that make the games engaging for players. For example, different lines of businesses such
as casinos can be designed in the context of the monopoly game, which is a popular property-transaction competition game, to bring up the business gains while experiencing the familiar fun of the monopoly game as discussed by Yeh et al. (2007). In addition, some past studies with positive research outcomes may provide directions in the design of more attractive screens and sustainable content of the games to increase students’satisfaction and intention to continue use. These directions include narrations (Schank, Fano, Bell and Jona, 1994), state of flow (Webster, Trevino and Ryan, 1993), interaction of simulation games, power in the hands of the users, and suitable rewards provided to guide the users (Garris et al., 2002), closing the gap between the simulation games and the actual situation to clearly define the link between the adopted policy and the results obtained (Adobor and Daneshfar, 2006).
Finally, to our disappointment, this research failed to establish that AT can be applied to the teacher–student relation similar to the agency relation, which was expected to be an innovative idea in the educational setting borrowed from the business settings. After going through the analysis mentioned in the Model Verification section, this research proposes to go further and be more thorough in future studies on either business simulation games or other educational settings.
Reference
1. Adobor, H. and Daneshfar, A. (2006). Management simulations: Determining their effectiveness, Journal of Management Development, 25(2), 151-168.
2. Atchariyachanvanich, K., Okada, H. and Sonehara, N. (2006). What keeps online customers repurchasing through the Internet? ACM SIGecom Exchanges, 6(2), 47-57.
3. Azevedo, R. and Cromley, J. (2004). Does training of self-regulated learning facilitate student’s learning with hypermedia? Journal of Educational Psychology, 96, 523–535.
4. Bagozzi, P. R. (2007). The legacy of the Technology Acceptance Model and a proposal for a paradigm shift. Journal of the Association for Information Systems, 8(4), 244-254.
5. Benbasat, I. and Barki, H. (2007). Quo Vadis, TAM? Journal of the Association
for Information System, 8(4), 211-218.
6. Bergen, M., Dutta, S. and Walker, O.C. (1992). Agency relationships in marketing: A review of the implications and applications of agency and related theories, Journal of Marketing, 56, 1-24.
7. Bhattacherjee, A. (1998). Managerial influences on intraorganizational information technology use: A principal-agent model, Decision Sciences, 29, 1, 139-162.
8. Bhattacherjee, A. (2001a). Understanding information systems continuance: An expectation-confirmation model, MIS Quarterly, 25(3), 351-370.
9. Bhattacherjee, A. (2001b). An empirical analysis of the antecedents of electronic commerce service continuance, Decision Support Systems, 32(2), 201-214. 10. Brusilovsky, P. and Pesin, L. (1995). Visual annotation of links in adaptive
hypermedia. Conference on Human factors in computing systems Denver, Colorado, U.S.A., 222-223.
11. Chang, C.-H. (2001). Educational Psychology, Taipei: Tung-Hwa Publishing. 12. Chin, W.W. (1998). Issues and opinion on structural equation modeling. MIS
Quarterly, 22(1), 7-16.
13. Chiu, C.M., Hsu, M.H., Sun, S.Y., Lin, T.C. and Sun, P.C. (2005). Usability, quality, value and e-learning continuance decisions, Computers and Education, 45(4), 399-416.
14. Chiu, T. (2007). Low quality originating from bad learning attitude. China Times newspaper, September 6.
15. Cheong, J.H. and Park, M.C. (2005). Mobile Internet acceptance in Korea.
Internet Research, 15(2), 125-140.
16. Churchill, G. and Surprenant, C. (1982). An investigation into the determinants of consumer satisfaction. Journal of Marketing Research, 19(4), 491-504.
17. Davis, F.D. (1989). Perceived usefulness, perceived ease of use, and user acceptance of information technology. MIS Quarterly, 13(3), 319-340.
18. Davis, F.D., Bagozzi, R.P., and Warshaw, P.R. (1989). User acceptance of computer technology: A comparison of two theoretical models. Management
Science, 35(8), 982-1003.
19. Davis, F. D., Bagozzi, R. P. and Warshaw, P. R. (1992). Extrinsic and intrinsic motivation to use computers in the workplace, Journal of Applied Social
Psychoiogy, 22(14): 1111-1132.
20. Davis, F. D. (2007). User acceptance of information technology: research progress, current controversies, and emerging paradigms, Keynote Speech at the
7th International Conference of Electronic Commerce, December 2-6, The Grand
Hotel, Taipei, Taiwan, R.O.C.
21. DeLone, W.H. and McLean, E. (2003). The Delone and Mclean model of information systems success: A ten year update. Journal of Management
Information Systems, 19(4), 9-30.
22. Deng, B. (1992). A Multilevel Analysis of Classroom Climate Effects on Mathematics Achievement of Fourth-Grade Students. (ERIC Document NO. ED 348222).
satisfaction and preference: Validating e-commerce metrics. Information Systems
Research, 13(3), 316–333.
24. Doll, W.J. and Torkzadeh, G. (1998). Developing a multidimensional measure of system-use in an organizational context, Information & Management, 33, 171-185.
25. Duncan, T.G. and McKeachie, W.J. (2005). The making of the motivated strategies for learning questionnaire, Educational Psychologist, 40(2), 117-128. 26. Ebner, M. and Holzinger, A. (2007). Successful implementation of user-centered
game based learning in higher education: An example from civil engineering”
Computers and Education, 49(3), 873-890.
27. Eisenhardt, K.M. (1989). Agency theory: An assessment and review. Academy of
Management Review, 14(1), 57-74.
28. Fishbein, M. and Ajzen, I. (1975). Belief, Attitude, Intention and Behavior: An
Introduction to Theory and Research, Addison-Wesley, Reading, MA.
29. Fraser, B.J. and Treagust, D.F. (1986). Validity and use of an instrument for assessing classroom psychosocial environment in higher education. Higher
Education, 15(1/2), 37-57.
30. Fu, B.-C. (2007). Study of college teaching and evaluation. ePaper of Integrated Higher Education Database Systems in Taiwan, 10.
31. Garris, R., Ahlers, R. and Driskell, J. (2002). Games, motivation and learning: A research and practice model. Simulation and Gaming, 33(4), 441-467.
32. Goodhue, D. (2007). Comment on Benbasat and Barki’s “Quo Vadis TAM” article. Journal of the Association for Information Systems, 8(4), 219-222.
33. Ha, I., Yoon, Y. and Choi, M. (2007). Determinants of adoption of mobile games under mobile broadband wireless access environment. Information and
Management, 44(3), 276-286.
34. Hair, J.F., Anderson, R.E., Tatham, R.L. and Black, W.C. (1998). Multivariate
Data Analysis. Prentice-Hall.
35. Hayashi, A., Chen, C., Ryan, T. and Wu, J. (2004). The role of social presence and moderating role of computer self efficacy in predicting the continuance usage of e-learning systems. Journal of Information Systems Education, 15(2): 139–154.
36. Heijden, H.V.D. (2003). Factors influencing the usage of Websites: The case of a generic portal in the Netherlands. Information and Management, 40, 541-549. 37. Hong, S.-J., Thong, J.Y.L. and Tam, K. Y. (2006). The effects of post-adoption
beliefs on the expectation-confirmation model for information technology continuance, International Journal of Human - Computer Studies, 64(9): 799-810.
38. Hsu, Q. (2006). Survey of college education –nothing proud of being in colleges. CommonWealth Magazine, 360, 48 –55.
39. Hsu, C.L. and Lu, H.P. (2004). Why do people play on-line games? An extended TAM with social influences and flow experience. Information and Management. 41(7), 853-868.
40. Jensen, M.C. and Meckling, W.H. (1976). The theory of the firm: Managerial behavior, agency costs and ownership structure. Journal of Financial Economics, 3(1), 305-360.
41. Kapp, K. (2006). Gadgest, games and gizmos: Informal learning at Nick.com. http://karlkap.blogspot.com.
42. Karahanna, E., Straub, D.W. and Chervany, N.L. (1999). Information technology adoption across time: A cross-sectional comparison of pre-adoption and post-adoption beliefs. MIS Quarterly, 23(2), 183-213.
43. King, R. R. and He, J. (2006). A meta-analysis of the technology acceptance model, Information & Management, 43, 740-755.
44. Lalley, J. P. and Miller, R. H. (2007). The learning pyramid: Does it point teachers in the right direction? Education, 128(1), 64-79.
45. Leemkuil, H., de Jong, T., de Hoog, R. and Christoph, N. (2003). KM quest: A collaborative Internet-based simulation game, Simulation and Gaming, 34, 89–111.
46. Li, Y.-I. and Shan, W.-C. (1997). Educational Principle, Taipei: Koobe Publishing.
47. Liao, C.H., Tsou, C.W. and Huang, M.F. (2007). Factors influencing the usage of 3G mobile services in Taiwan, Online Information Review, 31(6), 759-774. 48. Lim, C. P. (2008). Spirit of the game: Empowering students as designers in
schools. British Journal of Educational Technology, 39(6), 996-1003.
49. Liu, R.-L. (2006b). How do students successfully learn? Discuss the lifting of education quality from college students’ learning outcomes and school satisfaction. ePaper of Integrated Higher Education Database Systems in Taiwan, 4.
50. Ma, Q. and Liu, L. (2004), The technology acceptance model: A Meta-analysis of empirical findings, Journal of Organizational and End User Computing, 16(1), 59-72.
51. Merrill, M. D. (1991). Constructivism and instructional design. Educational
Technology, 31(5), 45-53.
52. Moon, J.W. and Kim, Y.G. (2001). Extending the TAM for a World-Wide-Web context. Information and Management, 38(4), 217-230.
Jossey-Bass.
54. Mumtaz, S. (2001). Children’senjoyment and perception of computer use in the home and the school. Computers and Education, 36, 347–362.
55. Murphy, B. and Smark, C. (2006). Convergence of learning experiences for first year tertiary commerce students –Are personal response systems the meeting point? Journal of American Academy of Business, 10(1), 186-191.
56. Nambisan, S., Agarwal, R. and Tanniru, M. (1999). Organizational mechanisms for enhancing user innovation in information technology. MIS Quarterly, 23(3), 365-395.
57. Norton, W. and Moore, W. (2006). The influence of entrepreneurial risk assessment on venture launch or growth decisions. Small Business Economics, 26, 215-226.
58. Oliver, R.L. (1980). A cognitive model for the antecedents and consequences of satisfaction decisions. Journal of Marketing Research, 17, 460-469.
59. Oliver, R. and DeSarbo, W. (1988). Response determinants in satisfaction judgments. Journal of Consumer Research, 14, 495-507.
60. Pintrich, P.R. and De Groot, E.V. (1990). Motivational and self-regulated learning components of classroom academic performance. Journal of Educational Psychology, 82, 33-40.
61. Premkumar, G and Bhattacherjee, A. (2008). Explaining information technology usage: A test of competing models. Omega, 36, 64-75.
62. Prensky, M. (2003). Digital game-based learning. Computer in Entertainment, 1(1), 21-21.
63. Prensky, M. (2008). Students as designers and creators of educational computer games: Who else? British Journal of Educational Technology, 39(6), 1004-1019. 64. Randel, J.M., Morris, B.A., Wetzel, C.D. and Whitehill, B.V. (1992). The
effectiveness of games for educational purposes: A review of recent research.
Simulation and Gaming, 23(3), 261–276.
65. Robertson, J. and Howells, C. (2008). Computer game design: opportunities for successful learning. Computers and Education, 50, 559-578.
66. Roca, J.C., Chiu, C.M. and Martínez, F.J. (2006). Understanding e-learning continuance intention: An extension of the technology acceptance model.
International Journal of Human - Computer Studies, 64(8), 683-696.
67. Ru, I.-T. (2007). Confronting college students’quality issue –The view of college professors. ePaper of Integrated Higher Education Database Systems in Taiwan, 6.
68. Schank, R.C., Fano, A., Bell, B. and Jona, M. (1994). The design of goal-based scenarios. Journal of the Learning Sciences, 3(4), 305-346.
69. Schepers, J. and Wetzels, M. (2007), A meta-analysis of the technology acceptance model: Investigating subjective norm and moderation effects,
Information & Management, 44, 90-103.
70. Schwabe, G.. and Göth, C. (2005). Mobile learning with a mobile game: Design and motivational effects. Journal of Computer Assisted Learning, 21(3), 204-216.
71. Schwarz, A. and Chin, W. (2007). Looking forward: Toward an understanding of the nature and definition of IT acceptance. Journal of the Association for
Information Systems, 8(4), 230-243.
72. Shen, C.-W. (2008). Technology and Learning: Theory and Practice. Taipei, Taipei: Psychology Publishing.
73. Stipek, D. (1993). Motivation to Learn: From Theory to Practice. Boston, MA: Allyn & Bacon.
74. Straub, D. W. and Burton-Jones, A. (2007). Veni, Vidi, Vici: Breaking the TAM logjam. Journal of the Association for Information Systems, 8(4), 223-229. 75. Tao, Y.-H. (2008). Typology of college student perception on institutional
e-learning issues - An extension study of teacher's typology in Taiwan.
Computers and Education, 50(4), 1495-1508.
76. Tao, Y.-H. and Yeh, R. C. (2008). Typology of teacher perception toward
distance education issues - A study of college information department teachers in Taiwan. Computers and Education, 50(1), 23-36.
77. Tao, Y.-H. and Yeh, R. C. (2009). Personal response system: A model-based case
study in Taiwan, 14th Annual Meeting of Asia Pacific Region of Decision
Sciences Institute, Shanghai, July 4-8, 2009.
78. Terrell, S. and Rendulic, P. (1996). Using computer-managed instructional sSoftware to increase motivation and achievement in elementary school children. Journal of Research on Computing in Education, 26(3), 403-414.
79. Thong, Y.L., Hong, S.J. and Tam, Y.K. (2006). The effects of post-adoption beliefs on the expectation-confirmation model for information technology continuance. International Journal of Human-Computer Studies, 64, 799-810. 80. Tractinsky, N., Katz, A.S. and Ikar, D. (2000). What is beautiful is usable.
Interacting with Computers, 13, 25-37.
81. Tsai, J.-H. (1995). Effective classroom management: teacher’s leadership style, class climate and academic achievement, Education Information Digest, 36(5), 147-159.
82. Tse, D.K. and Wilton, P.C. (1988). Models of consumer satisfaction formation: An extension. Journal of Marketing Research, 25, 202-212.
intrinsic motivation, and emotion into the technology acceptance model.
Information Systems Research, 11(4), 342–365.
84. Venkatesh, V. and Davis, F.D. (2000). A theoretical extension of the technology acceptance model: Four longitudinal field studies. Management Science, 46(2), 184-204.
85. Venkatesh, V., M.G., Morris, G. B. Davis and F. D. Davis (2003). User acceptance of information technology: Toward a unified view, MIS Quarterly, 27(3): 425-478.
86. Venkatesh, V., F. D. Davis and Morris, M. G. (2007). Dead or alive? The development, trajectory and future of technology adoption research, Journal of
the Association for Information Systems, 8(4): 267-286.
87. Virvou, M. and Katsionis, G. (2008). On the usability and likeability of virtual reality games for education: The case of VR-ENGAGE. Computers and
Education, 50, 154-178.
88. Walberg, H.J. (1979). Educational Environments and Effects:Evaluation, Policy,
and Productivity, Berkeley, CA: McCutchan.
89. Webster, J., Trevino, L.K. and Ryan, L. (1993). The dimensionality and correlates of flow in human-computer interactions. Computer in Human
Behavior, 9(4), 411–426.
90. Yousafzai, S. Y., Foxall, G. R. and Pallister, J. G. (2007), Technology acceptance: A meta-analysis of the TAM: Part 2, Journal of Modelling in Management, 2(3), 281-304.
91. Yeh, R. C., Tao, Y.-H., Hong, T.-P., Lin, W.-Y., Chen, P.-C., Wu, C.-H., and Lin, J., Adapting Monopoly as an Intelligent Learning Game for Teaching Dynamic Competitive Strategy, The 2007 International joint Conference of e-CASE,
e-Commerce, e-Administration and e-Education, Hong Kong, August 15-17.
92. Yu, F.Y., Chang, L.J., Liu, Y.H. and Chan, T.W. (2002). Learning preferences towards computerised competitive modes. Journal of Computer Assisted
Figure 1 Technology Acceptance Model (Source: David et al., 1989) Figure 2 Expectation Confirmation Theory (Source: Oliver, 1980) Figure 3: Continuance use of educational simulation games model Table 1 Results acquired from formative indicators
Table 2 Related Statistics and Reliability Analysis Table 3 Discriminant Validity Analysis
Figure 1 Technology acceptance model (David et al., 1989)
Figure 2 Expectation confirmation theory (Oliver, 1980)
Learning
atmosphere motivationLearning
Perceived
ease of use usefulnessPerceived
Perceived
attractiveness playfulnessPerceived Learning performance Confirmation Satisfaction Intention to continue using Risk
aversion conflictGoal Incentive
H17 H11 H16 H15 H7 H6 H5 H2 H1 H8 H3 H4 H13 H12 H9 Learning Factors
Technology Acceptance Model
Emotion Factors
Expectation Confirmation Theory
Agency Theory H14
H10
Figure 3: Continuance use of educational simulation games model
+ + Expectation Perceived performance Confirmation Satisfaction + -Repurchase Perceived usefulness Perceived ease of use Attitude to use Intention to use External variables Actual use behavior +
Table 1 Hypotheses and supporting references
Expectation Confirmation Theory related hypotheses
H1. The student’s satisfaction on business simulation games has a noticeable impact on the
intention of the user for continuous use. (Bhattacharjee, 2001a; Roca et al., 2006; Chiu, Hsu, Sun, Lin and Sun, 2005)
H2. The confirmation degree of the students using the business simulation game has a noticeable
impact on the level of satisfaction. (Thong et al., 2006; Roca et al., 2006)
H3. Thestudent’slearning performancein business simulation games has a noticeable impact on
the level of satisfaction. (Oliver and DeSarbo, 1998; Tse and Wilton, 1998)
H4. Thestudent’slearning performancein business simulation games has a noticeable impact on
the level of confirmation. (Churchill and Surprenant, 1982; Tse and Wilton, 1998) Agency Theory related hypotheses
H5. Incentives for using business simulation games have a significant impact on learning
performance. (Bhattacharjee, 2001b; Eisenhardt, 1989)
H6. Incentives for using business simulation games may receive the interference of goal conflicts
because of the learning performance. (Bhattacharjee, 1998)
H7. Incentives for using business simulation games may receive the interference of risk-aversions
because of the learning performance. (Bhattacharjee, 1998) Technology Acceptance Model related hypotheses
H8. Perceived usefulness of business simulation games has a significant impact on satisfaction
level. (Bhattacharjee, 2001a; 2001b; Devaraj, Fan and Kohli, 2002)
H9. Perceived ease of use of business simulation games has a significant impact on satisfaction
level. (Devaraj et al., 2002; Roca et al., 2006; Thong et al., 2006)
H10. Perceived usefulness of business simulation games has a significant impact on learning
performance. (DeLone and McLean, 2003; Doll and Torkzadeh, 1998)
H11. Perceived ease of use of business simulation games has a significant impact on cognitive
playfulness. (Venkatesh, 2000; Liao et al., 2007; Heijden, 2003) Learning Factors related hypotheses
H12. The learning motivation of a student on business simulation games has a significant impact on
the student’s learning performance. (Pintrich and Groot; 1990)
H13. The classroom atmosphere, when using business simulation games, has a significant impact
on learning performance. (Moos, 1971; Deng, 1992) Emotion Factors related hypotheses
H14. Cognitive playfulness of business simulation games has a significant impact on satisfaction
level. (Webster et al., 1993; Moon and Kim, 2001)
H15. Perceived attractiveness of business simulation games has a significant impact on perceived
usefulness. (Heijden, 2003)
perceived ease of use. (Heijden, 2003; Tractinsky et al., 2000)
H17. Perceived attractiveness of business simulation games has a significant impact on cognitive
playfulness. (Heijden, 2003)
Table 2 Related Statistics and Reliability Analysis
Aspects Items Mean σ Loading
Perceived usefulness: CR = 0.96 (Davis, 1989)
PU1 Business simulation games allow me to complete my studies
faster. 4.95 1.05 0.93
PU2 Business simulation games increase my learning efficiency. 5.04 1.09 0.95 PU3 Business simulation games improve my learning performance 4.99 1.08 0.94 Perceived ease of use: CR == 0.90 (Davis, 1989)
PEU1 Business simulation games are easy to use 4.65 1.22 0.83 PEU2 Interacting with business simulation games is unambiguous
and easy to understand. 4.68 1.10 0.89
PEU3 Using business simulation games to complete course related
tasks are easy. 4.75 1.01 0.87
Perceived attractiveness: CR = 0.92 (Heijden, 2003)
PA1 I am attracted by the general appearance of the business
simulation games. 4.31 1.05 0.91
PA2 I am attracted by the combination of colors used in business
simulation games. 4.34 1.07 0.89
PA3 I am attracted to the business simulation games as a whole. 4.82 1.03 0.88 Perceived playfulness: CR = 0.92 (Moon and Kim, 2001)
PP1 Time flies when I use business simulation games. 5.00 1.17 0.84 PP2 It is interesting to use business simulation games. 5.09 1.09 0.93 PP3 I feel like exploring more information when I use business
simulation games. 5.07 1.10 0.90
Learning motivation: CR = 0.83 (Duncan and McKeachie, 2005)
LM1 I would rather opt a course that makes me curious even if its
more difficult. 4.88 1.09 0.63
LM2 I feel that the contents of the business simulation games are
practical and are worth the effort to learn it. 5.15 0.96 0.81 LM3 I believe that I can learn all the concepts in a class which uses
the business simulation games. 4.97 1.08 0.84 LM4 I feel that my performance is better than the others when I use
business simulation games. 4.32 1.11 0.67
Classroom climate: CR = N/A (Fraser and Treagust, 1986)
I tend to listen to what others have to say in classes using the
business simulation games. 5.04 1.05
Participation
I have an opportunity to express my opinions in classes using
the business simulation games. 5.01 1.02 0.83
I like sharing information and my thoughts with the other
students in classes using business simulation games. 4.99 1.04 I can learn important things from other students in classes
using business simulation games. 5.21 0.93 Cooperative
Learning
I like cooperating with other students in classes using business
simulation games. 5.16 0.96
0.97
Incentives: CR = 0.92 (Bhattacharjee, 2001b)
Incent1 The teachers in classes using business simulation games
provide learning incentives. 4.73 1.11 0.87 Incent2 The teachers in classes using business simulation games
reward those students who attain their goal. 4.55 1.26 0.90 Incent3 The teachers in classes using business simulation games
Goal Conflicts:CR = 0.91 (Cheong and Park. 2005; Venkatesh and Davis, 2000)
GI1 I plan to use business simulation games to learn new skills. 4.58 0.96 0.87 GI2 I will try my best to use a business simulation game more
often. 4.75 1.04 0.90
GI3 If I have a chance to use a business simulation game, then I
will think of using it. 4.94 0.97 0.89
Risk Aversion: CR = 0.90 (Norton and Moore, 2006)
RA1 When I choose a work atmosphere, I am not willing to take
risks. 4.00 1.36 0.78
RA2 I would prefer a low risk and a highly secured working
atmosphere with an anticipated salary. 4.74 1.37 0.83 RA3
I would prefer staying in a familiar atmosphere than a new atmosphere which has a high risk of unknown problems, even though it may provide more rewards.
4.47 1.37 0.87 RA4 I would not hesitate at all costs to avoid any risks in my work. 4.17 1.27 0.87 Learning Performance: CR = 0.89 (Premkumar and Bhattacharjee, 2008)
LP1 I can learn new skills if I use business simulation games. 4.95 0.91 0.86 LP2 Business simulation game helps me improve my results. 4.60 1.06 0.86 LP3 The learning periods are more flexible if I use business
simulation games. 4.93 1.10 0.85
Confirmation level: CR = 0.94 (Premkumar and Bhattacharjee, 2008) Confrim1 Business simulation games being able to help me learn new
skills have exceeded my previous expectations. 4.72 1.08 0.95 Confirm2 Business simulation games being able to improve my results
have exceeded my previous expectations. 4.57 1.09 0.93 Satisfaction level: CR = 0.89 (Yu, Chang, Liu and Chan, 2002)
Sat1 It would be interesting to be able to attend a class using
business simulation games. 5.11 1.01 0.90
Sat2 I like to learn new skills by using business simulation games. 5.04 1.05 0.89 Sat3 I wish that all the courses would apply the use of business
simulation games in their class. 5.01 1.12 0.76 Continuance Intention: CR = 0.93 (Atchariyachanvanich, Okadaand Sonehara, 2006; Thong et al., 2006; Premkumar and Bhattacharjee, 2008).
Cont1 I intend to continuously use the business simulation games to
learn new skills. 4.86 1.03 0.91
Cont2 I intend to increase my chances to use business simulation
games. 4.77 1.04 0.93
Cont3 Business simulation games would be my prior choice when I
learn a new skill. 4.79 1.05 0.89
Table 3 Discriminant Validity Analysis Correlation of Constructs Constructs3 AVE1 (1) (2) (3) (4) (5) (6) (7) (8) (9) (10) (11) (12) PU(1) .89 .942 PEU(2) .75 .65 .86 PA(3) .80 .50 .46 .89 PP(4) .80 .62 .57 .63 .89 LM(5) .55 .61 .55 .50 .72 .74 Incent(6) .80 .41 .38 .38 .38 .41 .89 GI(7) .79 .62 .44 .54 .65 .70 .57 .88 RA(8) .70 .18 .03 .25 .06 .02 .30 .23 .84 LP(9) .74 .67 .41 .29 .53 .61 .41 .69 .29 .86 Confirm(10) .89 .55 .40 .41 .49 .55 .49 .65 .29 .73 .94 Sat(11) .73 .57 .45 .43 .61 .63 .39 .69 .13 .67 .58 .85 Cont(12) .83 .59 .45 .49 .62 .61 .42 .81 .24 .67 .69 .78 .91
1. Average variance extracted, AVE is required to exceed 0.5.
2. Each of the diagonal AVEvalue is required to exceed the construct AVE value, and other related coefficients of the non-diagonal construct values.
3. PU is taken as perceived usefulness, PEU is taken as perceived ease of use, PA is the perceived attractiveness, PP is the perceived playfulness, LM is the learning motivation, CC is the classroom climate, Incent is taken as the incentives, GI is the goal conflicts, RA is risk aversion, LP is the learning performance, Confirm is the confirmation level, Sat is the satisfaction level and finally Cont is the Continuance intention.
Learning
atmosphere motivationLearning
Perceived ease of use R2=0.21 Perceived usefulness R2=0.48 Perceived attractiveness Perceived Playfulness R2=0.50 Learning performance R2=0.60 Confirmation R2=0.53 SatisfactionR2=0.56 Intention to continue using R2=0.50 Risk
aversion conflictGoal Incentive
H17 =0.46***
H16 =0.25***
Learning Factors
Technology Acceptance Model
Emotion Factors Agency Theory
H11 =0.36*** H15 =0.46*** H7 =0.16 =0.25H6 =-0.11H5 H4 =0.73*** H14 =0.31*** H13 =0.01 H10 =0.35*** H12 =0.16 H9 =0.05 H8 =0.01 H2 =0.10 =0.49***H1 H3 =0.40***
Expectation Confirmation Theory