Who Gains from Trade?
Evidence from Taiwan
Brad M. Barber
Graduate School of Management University of California, Davis
Davis, CA 95616 (530) 752-0512 [email protected] www.gsm.ucdavis.edu/~bmbarber Yi-Tsung Lee Department of Accounting National Chengchi University
Taipei, Taiwan (886-2) 2939-3091 # 81027
[email protected] Yu-Jane Liu Department of Finance National Chengchi University
Taipei, Taiwan (886-2) 2939-3091 # 81123
[email protected] Terrance Odean1 Haas School of Business University of California, Berkeley
Berkeley, CA 94720 (510) 642-6767 [email protected] faculty.haas.berkeley.edu/odean July 2004
1 We are grateful to the Taiwan Stock Exchange for providing the data used in this study. Michael Bowers provided excellent computing support. Barber appreciates the National Science Council of Taiwan for underwriting a visit to Taipei, where Timothy Lin (Yuanta Core Pacific Securities) and Keh Hsiao Lin (Taiwan Securities) organized excellent overviews of their trading operations. We appreciate the comments of Ken French, Charles Jones, Mark Kritzberg, and seminar participants at UC-Davis, the University of North Carolina, and the Wharton 2004 Household Finance Conference.
Who Gains from Trade?
Evidence from Taiwan
Abstract
In the presence of information and trading costs, informed investors should profit from uninformed investors. We test this proposition by analyzing the performance of institutional and individual investors using trades data for all market participants in the Taiwan stock market during the five years ending in 1999. Before considering trading costs (commissions and transaction taxes), on the average day, institutions realize trading profits of $NT 178 million, while individual investors lose the same amount. In general, the gains to institutions are not offset by their trading costs, while trading costs exacerbate the losses of individuals. After costs, we estimate that the trading of institutional investors adds one percentage point annually to their portfolio performance, while the trading of individuals subtracts over three percentage points annually from their performance. All major institutional categories (corporations, dealers, foreigners, and mutual funds) earn profits before costs. Only corporations fail to do so after costs. We also map trades to orders, which we classify as aggressive (demanding liquidity) or passive (providing liquidity) based on order prices. Virtually all trading losses incurred by individuals can be traced to their aggressive orders. In contrast, institutions profit from both their passive and aggressive trades. Most of the institutional profits from passive trades, which provide liquidity to market participants, are accrued within a few days of the trade. In contrast, most of the institutional profits from their aggressive trades accrue at horizons up to six months. All of the gains from trade are exhausted within six months.
Poker is a zero-sum game. Players ante up. Some take home more than they bring to the table, others less. However, the sum of winnings from the game is zero. Similarly, trading in financial markets is a zero-sum game (before transactions costs). All investors can participate in market gains. However, when investors choose to trade with each other, some win, others lose.1 In an efficient market, prices fully reflect all available information. In such a market, the gains and losses from trade are random outcomes governed by luck. When information and trading are costly, informed investors earn trading profits, while uninformed investors incur trading losses (Fama (1991), Grossman and Stiglitz (1980)).
In this paper, we investigate whether there are systematic winners and losers from trade. To do so, we use a unique and remarkably complete dataset, which contains the entire transaction data, underlying order data, and the identity of each trader in the Taiwan stock market – the World’s twelfth largest financial market. With these data, we provide a comprehensive accounting of the gains and losses from trade during the period 1995 to 1999. Our data allow us to identify trades made by institutions, which fall into one of four categories (corporations, dealers, foreigners, or mutual funds), and individuals. To analyze who gains from trade, we construct portfolios that mimic the purchases and sales of each investor group. If stocks bought by an investor group reliably outperform those that they sell, the group benefits from trade. In addition, using the orders underlying each trade, we are able to examine whether gains and losses can be attributed to aggressive or passive orders.
Our empirical analysis presents a remarkably clear portrait of who gains from trade: Institutions win, and individuals lose. Each of the four institutional groups that we analyze – corporations, dealers, foreigners, and mutual funds – gain from trade, while individual investors lose. Though we analyze horizons up to one year following a trade, our empirical analyses indicate that most of the gains by institutions (and losses by
1 Of course, all investors can benefit from trade since trading facilitates risk sharing. In this paper, we focus on the pecuniary gains and losses from trading.
individuals) are exhausted at a horizon of six months. In addition, a disproportionate amount of the gains from trade occur in the first month following a trade.
Assuming the gains from trade are fully realized within six months of the trade, we document that on the average day institutions earn $NT 178 million, while individuals lose the same amount.2 Of these profits, roughly one-third ($NT 58.8 million) are earned in the first half month following transactions and 41 percent ($NT 73.4 million) in the first month following transactions. Similarly, we document that stocks bought by institutions reliably outperform those sold by 135, 78, and 33 basis points per month at holding periods of ten, 25, and 140 trading days (respectively). Conversely, stocks bought by individuals reliably underperform those sold at each horizon.
These calculations ignore transaction costs (commissions and transaction taxes). We document that these costs cut into the trading profits of institutions, but institutional profits net of these costs remain reliably positive. Transaction costs only exacerbate the losses incurred by individual investors.
A distinguishing feature of our dataset is data on the orders underlying each trade. Unlike most prior studies of the performance of institutional or individual investors, these order data allow us to classify each trade as aggressive or passive. Aggressive limit orders are defined as buy limit orders with high prices and sell limit orders with low prices (both relative to unfilled orders at the last market clearing); passive limit orders are defined to be buy limit orders with low prices and sell limit orders with high prices. 64 percent of all trades emanate from aggressive orders.
Our analysis of the profitability of aggressive and passive trading indicates virtually all of the losses incurred by individuals can be attributed to their aggressive trades. In contrast, institutions profit from both their passive and aggressive trades. At short horizons (up to one month), the majority of institutional gains can be traced to
2 The average exchange rate that prevailed during our sample period was $NT 29.6 per $US 1. Thus $NT 178 million was approximately $US 6 million.
passive trades. The profits associated with passive trades are realized quickly, as institutions provide liquidity to aggressive, but apparently uninformed, investors. The profits associated with the aggressive trades of institutions, which are likely motivated by an informational advantage, are realized over longer horizons.
Finally, we analyze the market timing ability of each investor group. We document that there is, at best, weak evidence of market timing ability. Again, we find institutions gain from market timing, while individuals lose, though the statistical and economic significance of the gains from market timing are less than those from stock selection.
The remainder of the paper is organized as follows. We discuss related research in Section II. Our data and methods are described in detail in Section III. We present results in Section IV followed by concluding remarks.
I. Related Research
In an efficient market, prices fully reflect all available information. Thus, in an efficient market, systematic trading profits are nil. This is clearly a strong version of market efficiency and, like all models, is surely false. As Grossman and Stiglitz (1980) and Fama (1991) point out, for this strong version of the efficient market hypothesis to hold, information and trading costs must be zero. In the presence of these costs, some investors choose to acquire costly information in return for superior portfolio returns, while uninformed investors earn lower returns. Similarly, Kyle (1985) demonstrates that informed insiders capitalize on their private information by gradually revealing their private information through trade. Informed traders profit on this information, while uninformed random (noise) traders incur losses. Though it is difficult to explicitly identify informed and uninformed investors ex-ante, we believe it is reasonable to presume – as has been done in many studies in financial economics – that institutional investors are better informed than individual investors, on average. If one accepts this assumption, theoretically, we would expect institutions to profit at the expense of individual investors.
There is a vast empirical literature on the performance of different investor groups. There are two main distinctions between our study and prior research. First, virtually all prior studies tend to analyze a particular investor group (e.g., mutual funds, pension funds, or hedge funds), while our data allow us to analyze all investor groups that compose the market. Second, virtually all prior studies rely on either quarterly holdings data or publicly reported returns data for the group analyzed. In contrast, we are able to analyze the complete trades and exact timing of all trades by each investor group. Our empirical analyses suggest that a focus on trades and the exact timing of those trades may be important for two reasons. First, the analysis of trades, rather than aggregate portfolio returns, focuses a sharper lens on the source of gains from an information advantage (trading), which is likely to provide a more powerful test of trading ability. Second, if a disproportionate amount of the gains (and losses) from trade occur within the first month following trade (a result we document later in this paper), knowledge of the exact timing of trade, rather than quarterly holdings, provides a more powerful test of trading ability.
There is considerable research evaluating the performance of institutional investors (primarily in the U.S.). The early work on the performance of mutual funds provided support for the strong version of market efficiency. For example, Jensen (1968) documents that the average return earned by mutual funds lags the market return, even before deducting fund expenses.
Though there is a general consensus that the average mutual fund is unable to beat the market net of fees, recent evidence indicates that at least some mutual funds may have trading ability.3 Perhaps closest in spirit to our own work is that of Chan, Jegadeesh, and Wermers (2000), who use quarterly mutual funds holding data to document stocks bought by mutual funds outperform those they sell. Coval and Moskowitz (2001) also use quarterly mutual fund holdings data and document mutual fund managers earn abnormal returns in excess of one percentage point per year on nearby investments. There is also evidence that U.S. pension fund managers perform well, but in all cases these studies
3 See, for example, Carhart (1997), Daniel, Grinblatt, Titman, and Wemers (1997), Grinblatt and Titman (1989, 1993), and Wermers (2000).
have relied on self-reported data to a pension consulting firm.4 Finally, several studies document hedge funds earn superior returns.5
In contrast to the research on institutional investors, there is relatively little work on the performance of individual investors. Indeed, research in financial economics has tended to focus on the search for the holy grail of an investor group that is able to reliably beat the market. Of course, if such a group exists, there must also be a group who loses. Using data from 10,000 accounts at a large U.S. brokerage firm during the period 1987 through 1993, Odean (1999) documents stocks bought by individual investors underperform those that they sell. Using similar data for the period 1991 through 1996, Barber and Odean (2000, 2001) document that investors who trade aggressively earn poor returns, but most of these losses emanate from transaction costs rather than poor security selection.6 Using a dataset that consists of portfolio holdings for all Finnish investors, Grinblatt and Keloharju (2000) document that individual investors perform poorly, while institutions – particularly foreigners – perform well. However, the methods that they employ do not allow them to estimate the total value of gains to institutions and losses to individuals.
Existing research on the performance of institutional and individual investors provides several incomplete pieces to a rather large puzzle – who, if anyone, gains from trade? These incomplete pieces indicate that institutions gain from trade, while
4 Ferson and Khang (2002) use data from Callan Associates; Lakonishok, Shleifer, and Vishny (1992) use data from SEI; Coggin, Fabozzi, and Rahman (1993) and Christopherson, Ferson, and Glassman (1998) use data from Frank Russell Co.; Delguercio and Tkac (2002) and Coggin and Trzcinka (2000) use data from Mobius; Ikenberry,Shockley, and Womack (1998) use data from DeMarche Associates.
5 Ackermann, McEnally, and Ravenscraft (1999), Brown, Goetzmann, and Ibbotson (1999), Liang (1999), and Agrawal and Naik (2000) provide evidence of superior returns, though Amin and Kat (2003) argue these results may be attributable to the skewed nature of hedge fund payoffs, which when appropriately accounted for, renders hedge fund performance unremarkable.
6 Schlarbaum, Lewellen, and Lease (1978a, 1978b) analyze the gross and net returns of positions built from
trading records and the profitability of round-trip trades made by 2,500 accounts at a retail brokerage during the seven years ending in December 1970. Though they emphasize that their results are conjectural, they conclude that their results “portray an overall picture of quite respectable individual investor security selection acumen.” See Barber and Odean (2000) for a detailed discussion of why these results differ from those in Odean (1999) and Barber and Odean (2000, 2001). Coval, Hirshleifer, and Shumway (2003) document that some individual investors at a large U.S. discount broker have stock selection ability.
individuals lose.7 In this research, we are able to complete the puzzle by analyzing all trades by all investor groups that compose a complete market and estimating the dollar value of gains and loses to each investor group. In addition, using orders data underlying each trade, we are able to trace trading gains and losses to passive and aggressive trading.
II. Background, Data, and Methods
II.A. Taiwan Market Rules
Before proceeding, it is useful to describe the Taiwan Stock Exchange (TSE). The TSE operates in a consolidated limit order book environment where only limit orders are accepted. During the regular trading session, from 9:00 a.m. to noon during our sample period, buy and sell orders can interact to determine the executed price subject to applicable automatching rules.8 Minimum tick sizes are set by the TSE and vary depending on the price of the security. Effective November 2, 1993, all securities listed on the TSE are traded by automatching through TSE’s Fully Automated Securities Trading (“FAST”) system. During our sample period, trades can be matched one to two times every 90 seconds throughout the trading day. Orders are executed in strict price and time priority. An order entered into the system at an earlier time must be executed in full before an order at the same price entered at a later time is executed. Although market orders are not permitted, traders can submit aggressive price-limit order to obtain matching priority. During our study period, there is a daily price limit of seven percent in each direction and a trade-by-trade intraday price limit of two ticks from the previous trade price.
7 Several related studies analyze the trading patterns of institutions and individuals. Choe, Kho, and Stulz (1999) analyze the impact of foreign traders in Korea in 1997 (during the Asian financial crisis). In contrast to our results, they find no evidence that the sales of foreign investors were followed by negative abnormal returns. Griffin, Harris, and Topaloglu (2003) analyze the trading patterns of individuals and institutions in Nasdaq 100 securities for the nine months ending in February 2001. In contrast to our results, they employ a VAR methodology to analyze the relation between institutional order imbalance and subsequent returns and find little evidence of return predictability. Cohen, Gompers, and Vuolteenaho (2002) use annual data on institutional ownership and document that institutions are net buyers of stocks with positive cash flow news and institutions as a group outperform individuals by 1.44 percent per annum. In contrast to the Taiwan trades data, which provides the timing and execution prices of institutional trades, Cohen et al. use annual data on institutional ownership. Thus, the institutional gains that they document are likely
underestimated.
8 Trading also occurred on Saturdays during most of our sample period. Before December 1997, Saturday trading occurred from 9:00-11:00. From January to March, 1998, stocks were traded only on the second and the fourth Saturday in each month. From April 1998 to Decebmber 2000, Saturday trading occurred from 9 am to noon. From 2001 on, there has been no trading on Saturday.
The TSE caps commissions at 0.1425 percent of the value of a trade. Some brokers offer lower commissions for larger traders, though we are unable to document the prevalence of these price concessions. Taiwan also imposes a transaction tax on stock sales of 0.3 percent. Capital gains (both realized and unrealized) are not taxed, while cash dividends are taxed at ordinary income tax rates for domestic investors and at 20 percent for foreign investors. Corporate income is taxed at a maximum rate of 25 percent, while personal income is taxed at a maximum rate of 40 percent.
II.B. Trades Data and Descriptive Statistics
We have acquired the complete transaction history of all traders on the TSE from January 1, 1995, through December 31, 1999. The trade data include the date and time of the transaction, a stock identifier, order type (buy or sell -- cash or margin), transaction price, number of shares, a broker code, and the identity of the trader. The trader code allows us to broadly categorize traders as individuals, corporations, dealers, foreign investors, and mutual funds. The majority of investors (by value and number) are individual investors. Corporations include Taiwan corporations and government-owned firms (e.g., in December 2000 the government-owned Post, Banking, and Insurance Services held over $NT213 billion in Taiwanese stock). Dealers include Taiwanese financial institutions such as Fubon Securities, Pacific Securities, and Grand Cathay Securities. Foreign investors are primarily foreign banks, insurance companies, securities firms, and mutual funds. During our sample period, the largest foreign investors are Fidelity Investments, Scudder Kemper, and Schroder Investment Management. Mutual funds are domestic mutual funds, the largest being ABN-AMRO Asset Management with $NT82 billion invested in Taiwanese stocks in December 2000.
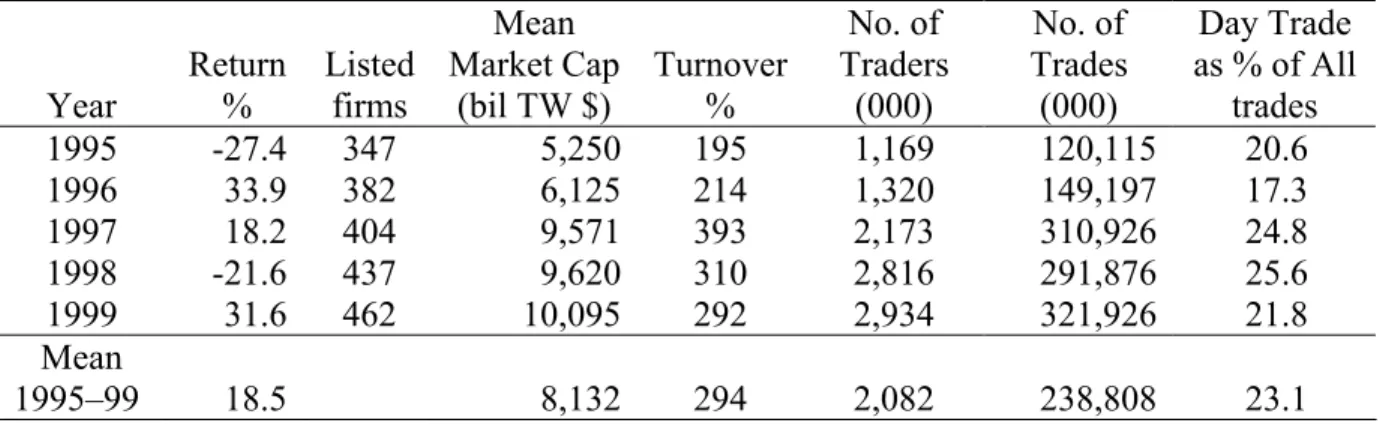
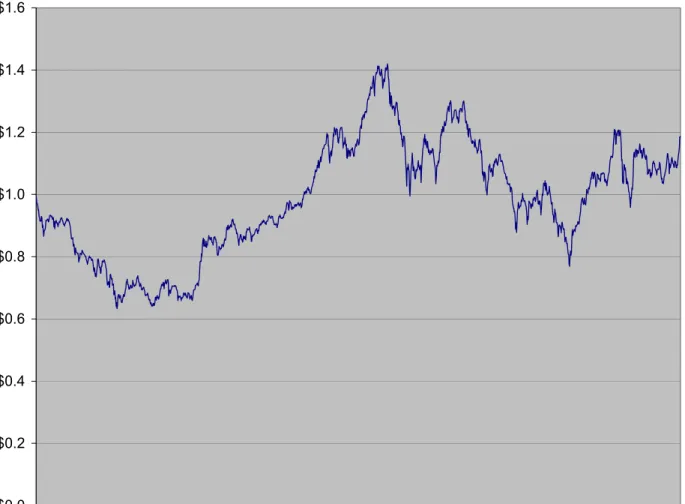
We present basic descriptive statistics on the market during the 1995 to 1999 period in Table 1. Several noteworthy points emerge. In contrast to the U.S., which enjoyed an unprecedented bull market in the late 1990s, Taiwan experienced modest overall gains (18 percent over our five-year sample period – see Figure 1). The main index for the Taiwan market (the TAIEX – a value-weighted index of all listed securities)
enjoyed gains of over thirty percent in 1996 and 1999… and losses of over twenty percent in 1995 and 1998. Our sample period also includes the period of the Asian Financial crisis, which began in May 1997 with a massive sell-off of the Thai Bhat.
Despite the return volatility in the Taiwan market, the overall value of the market has steadily grown. The number of firms listing in Taiwan grew at average annual rate of over 7 percent between 1995 and 1999. (This growth continues to date, with 638 firms listed on the TSE at the end of 2002.) The market value of the TSE nearly doubled from 1995 to 1999 – growing from $NT 5.2 trillion ($US 198 billion) in 1995 to over $NT 10 trillion ($US 313 billion) in 1999.9 At the end of 1999, the Taiwan market ranked as the 12th largest financial market in the world, though it was only slightly greater than two percent of the total U.S. market.
Turnover in the TSE is remarkably high – averaging 292 percent annually during our sample period.10 In contrast, turnover on the New York Stock Exchange averaged 69 percent during the same period.11 The number of TSE trades grew dramatically during our sample period. For the five-year period, we analyze more than 500 million buys and 500 million sales.
Day trading is also prevalent in Taiwan. We define day trading as the purchase and sale of the same stock on the same day by an investor. Over our sample period, day trading accounted for 23 percent of the total dollar value of trading volume. Most day trading (64 percent) involves the purchase and sale of the same number of shares in a stock over the course of one day (i.e., most day trades yield no net change in ownership at the close of the day).
Individual investors dominate the Taiwan market. According to the 2000 Taiwan Stock Exchange Factbook (table 24), individual investors accounted for between 56 and
9 The $TW/$US exchange rate reach a low of 24.5 and a high of 34.7 between January 1995 and December 1999.
10 We calculate turnover as ½ the sum of buys and sells in each year divided by the average daily market cap for the year.
59 percent of total stock ownership during our sample period. Taiwan corporations owned between 17 and 23 percent of all stocks, while foreigners owned between 7 and 9 percent. At the end of 2000, Taiwan’s population reached 22.2; 6.8 million Taiwanese (31 percent) had opened a brokerage account.
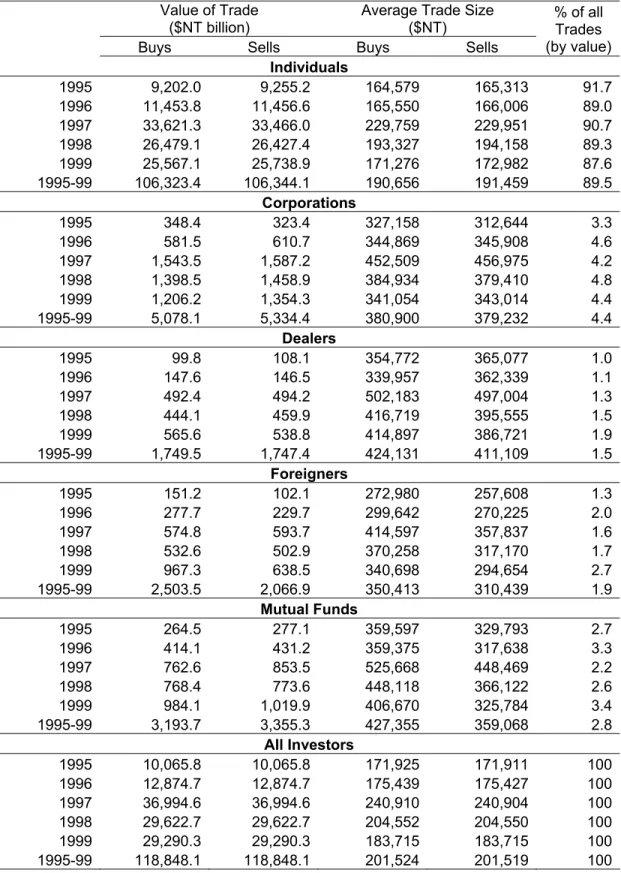
We restrict our analysis to ordinary common stocks. In Table 2, we present the total value of buys and sells of stocks for each investor group by year. As can be seen in the last column of the table, individual investors account for roughly 90 percent of all trading volume and place trades that are roughly half the size of those made by institutions (corporations, dealers, foreigners, and mutual funds). Each of the remaining groups accounts for less than five percent of total trading volume. During our five-year sample period, there were approximately 3.9 million individual investors, 24,000 corporations, 83 dealers, 1,600 foreigners, and 289 mutual funds that traded on the TSE.
Obviously, individual investors are very active traders in Taiwan. With back-of-the-envelope calculations using data on the percentage ownership and trading for each investor group, we estimate that annual turnover for the individual investor group ranges between 308 and 630 percent annually from 1995 to 1999.12
II.C. Return Calculations
On each day for each stock, we sum the value of buys made by a particular investor group (corporations, dealers, foreigners, mutual funds, or individuals). The intraday return on these purchases is calculated as the ratio of the closing price for the stock on that day to the average purchase price of the stock. On each day, we construct a portfolio comprised of those stocks purchased within the last ten trading days. (We also present results for longer holding periods.) The return on the portfolio is calculated based on the value of the initial purchase as:
12 For example, in 1995 the individual investor group accounted for 91.5 percent of all trades and 58.1 percent of stock ownership. Given annual market turnover of 195 percent, this implies that turnover for individual investors was 308 percent: (91.5 / 58.1) x 195.
1 1 bt bt n it it b i t n it i
x R
R
x
= =⋅
=
∑
∑
where Rit is the gross daily return of stock i on day t, nbt is the number of different stocks
purchased during the past ten days, and xit is the compound daily return of stock i from
the date of the purchase through day t-1 multiplied by the value of the purchase. The portfolio returns include the intraday return on the date of the purchase. The analysis yields a time-series of daily returns for each investor group. There is an analogous calculation based on the sales of each investor group.
To analyze the performance of the constructed portfolios, we compound the daily returns to yield a monthly return series for each investor group. Statistical tests are based on the monthly time-series of returns, where we calculate three measures of risk-adjusted performance. First, we calculate the mean monthly market-adjusted abnormal return by subtracting the return on a value-weighted index of TSE stocks from the return earned by a particular investor group’s buy (or sell) portfolio.
Second, we employ the theoretical framework of the Capital Asset Pricing Model and estimate Jensen’s alpha by regressing the monthly excess return earned by each investor group’s buy (or sell) portfolio on the market risk premium. For example, to evaluate the monthly return earned on the buy portfolio of corporations, we estimate the following monthly time-series regression:
where:
Rft = the monthly return on T-Bills,13
Rmt = the monthly return on a value-weighted market index,
13 We use the series of one-month deposit rates of the First Commercial Bank as the risk-free rate. This interest rate series is taken from Financial Statistics Monthly, Taiwan District, R.O.C., and is compiled by the Central Bank of China.
RtCorp −Rft = i + i Rmt −Rft + i ,
αi = the CAPM intercept (Jensen's alpha),
βi = the market beta, and
εi = the regression error term.
The subscript i denotes parameter estimates and error terms from regression i, where we estimate 15 regressions for each return horizon that we consider (the buy, sell, and buy less sell portfolios for five investor groups)
Third, we employ an intercept test using the four-factor model developed by Carhart (1997). For example, to evaluate the performance of the stocks bought by corporations, we estimate the following monthly time-series regression:
where SMBt is the return on a value-weighted portfolio of small stocks minus the return
on a value-weighted portfolio of big stocks, HMLt is the return on a value-weighted
portfolio of high book-to-market stocks minus the return on a value-weighted portfolio of low book-to-market stocks, and WMLt is the return on a value-weighted portfolio of
stocks with high recent returns minus the return on a value-weighted portfolio of stocks with low recent returns.14 The regression yields parameter estimates of
α βj, j, , and . The error term in the regression is denoted by s hj j wj εjt. The subscript j denotes parameter estimates and error terms from regression j, where we again estimate 15 regressions for each holding period that we analyze.
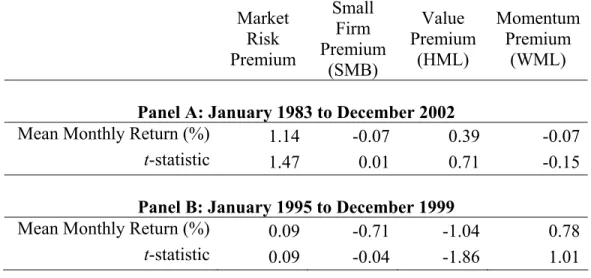
For reference, we present the mean returns on each of our factor portfolios from January 1983 to December 2002 and from January 1995 to December 1999 (our sample period) in Table 3. Over the longer period, none of the factor portfolios generate reliably positive premiums. During our sample period, large firms outperformed small firms, growth (low book-to-market) firms outperformed value (high book-to-market) firms, and
14 The construction of the size and book-to-market portfolios is identical to that in Fama and French (1993). The WML return is constructed based on a six-month formation period and a six-month holding period.
Rtcorp −Rft = j + j Rmt −Rft +s SMBj t +h HMLj t +w WMLj t + jt ,
stocks with strong recent returns outperformed stocks with poor recent returns. None these return differences are reliably different from zero.
II.D. Dollar Profits
In addition to calculating the returns to portfolios that mimic the buys and sells of each investor group, we calculate the dollar profits earned by each in investor group. Since our abnormal returns measures weight each day equally, they do not account for the magnitude of daily bets (i.e., trades) made by each investor group. Our dollar profit calculations do account for variations in daily trading volume. In addition, the calculation of dollar profits provides a precise accounting for the gains from trade, since the dollar profits are precisely equal to zero when summed across investor groups.
To estimate the dollar profit associated with trading on day t, we calculate the dollar profits from each trade net of any market gain. Specifically, for stock i on day t, we calculate the dollar profit from purchases as:
(
it mt)
t i b iP R R s ,−1 − , where b is is the number of shares of stock i bought in the prior ten trading days. (We also
consider horizons of 25 and 140 trading days.) There is an analogous calculation for the profits from sales. Note that on each day, the aggregate profits from trade for all traders (in a particular stock and across all stocks) are identically zero since for every buy there is a sell:
(
)
∑
(
)
∑
− − ≡ s it− it − mt i mt it t i b iP R R s P R R s , 1 , 1 .Day trading is prevalent on the TSE. Though we consider holding periods up to six months, it is important to note that when we sum the dollar profits of buys and sells, intraday trades only result in profits on the day of the trade. Consider a specific example, where an investor buys and sells the same number of shares in stock i on day 1. For
intraday trades, we calculate the total profit from the purchase and sale:
, 1 1 b b i s s i mt s s s s i mt b b b b i R s P s P P P P P s R P P P P s = − − − − − − where:
si = shares transacted (superscript b for buys, s for sells)
P = share price (subscript b for purchase price, s for sale price, 1 for closing price) Rmt = market return on day of trade.
By definition, intraday trades are the purchase and sale of the same number of shares on the same day. Thus, the profits from intraday trades are merely the proceeds from the sale less the cost of the purchase. On all subsequent days, though the purchase and sale remain in our constructed buy and sell portfolios, the calculated profits from the purchase will identically offset the profits from the sale.15
III. Results
III.A. Event-Time Results
To provide an overview of our results, we first present the results of an event-time analysis, where day 0 represents the day of a trade. Consider the buys of individual
investors. We begin by aggregating all purchases by individual investors by stock and day. We then calculate the mean market-adjusted abnormal return on event day τ (MAτ)
as:
(
)
buy 1 n i i m i MAτ x Rτ R τ = =∑
− ,where xi is the value of purchases of stock i on a particular day divided by the value of
purchases of all stocks on that day (i.e., event-time returns are weighted by the value of stocks purchased). There is a similar calculation for the sales of individuals. Finally, we calculate the cumulative (market-adjusted) abnormal return on stocks bought less the cumulative (market-adjusted) abnormal return on stocks sold as:
buy sell 1 ( ) T T CAR MAτ MAτ τ= =
∑
− .There is an analogous calculation for the purchases and sales of institutional investors.
15 The identical offset of dollar profits from intraday trades following the day of the trade does not necessarily hold for our analysis of returns. This is because a particular investor group may be a net buyer (or seller) of stocks on a particular day. For example, if an investor is a net buyer of stocks, the weight of a particular day trade in the buy portfolio will be less than its weight in the sell portfolio. The weights of the intraday trade will only be equal if the total value of stocks bought equals the total value of stocks sold.
The results of this analysis are presented in Figure 2. Consider first the results for institutions. Institutions appear to gain from trade, though the gains from trading reach an asymptote at approximately six months (140 trading days). After one month (roughly 23 trading days), the stocks bought by institutions outperform those sold by roughly 80 basis points. After six months, stocks bought outperform those sold by roughly 150 basis points.
In contrast, stocks sold by individuals outperform those bought. The magnitude of the difference is smaller than for institutions since most trades by individuals are with other individuals and do not contribute the difference in performance between stocks sold and stocks bought.. The large gains by institutions map into small losses by individuals merely because individuals represent such a large proportion of all trades. After one month, stocks bought by individuals lag those sold by roughly 10 basis points. After six months, the difference grows to roughly 20 basis points.
Though these results provide a powerful visual representation of our primary results, we are reluctant to draw strong inferences from this event time analysis because of the well-known problems associated with constructing a well-specified test of the null hypothesis that abnormal returns are zero using long-run event-time returns. Consequently, we base our statistical tests on the monthly time-series of calendar-time returns earned on stocks bought (or sold) by each of the investor groups that we analyze.16 We now turn to the analysis of calendar time returns, which are qualitatively
similar to the event-time results.
III.B. Calendar-Time Returns
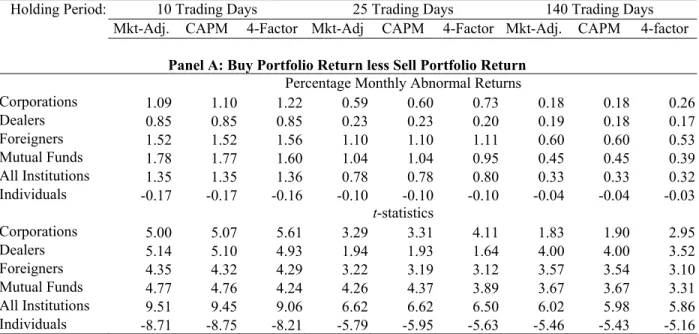
In Table 4, we present the abnormal return measures for the buy portfolio less sell portfolio (panel A), buy portfolio (panel B), and sell portfolio (panel C) for each investor group. We also present results for all institutions (corporations, dealers, foreigners, and mutual funds). We consider horizons of ten trading days (approximately two weeks), 25
16 For a thorough discussion of these methodological issues see Barber, Lyon, and Tsai (1999) and Mitchell and Stafford (2000).
trading days (slightly more than one month), and 140 trading days (roughly six months). (On average, the TSE is open 280 trading days per year during our sample period.)
The results provide strong evidence that institutions earn positive abnormal returns, while individuals earn negative abnormal returns. For example, assuming a holding period of ten days, stocks bought by institutions outperform those sold by 135 basis points (t=9.51) per month; stocks bought by individuals lag those sold by 17 basis points per month (t=-8.71).17 Furthermore, all institutions that we analyze gain from trade. At longer holding periods, the size of the abnormal returns dissipates but remains reliably positive for institutions and reliably negative for individuals. Risk adjustment has virtually no effect on these results. Jensen’s alphas and the four-factor intercepts are reliably positive for institutions and reliably negative for individuals.
Examination of panels B and C reveal that institutions generally buy stocks that perform well and sell stocks that perform poorly, though these results (particularly the statistical significance) vary with horizon and the model used to estimate abnormal returns. In contrast, individuals generally buy and sell stocks that subsequently perform poorly, though again these results vary with horizon and the model used to estimate abnormal returns. We present the results of the buy and sell portfolios for the sake of completeness, but it should be emphasized that the relevant consideration when calculating the gains from trade is the relative performance of the buy and sell portfolio. For example, if an institution bought a stock that subsequently performed well, while selling a stock that performed just as well, the return on the institution’s overall portfolio would be unaffected; the institution would not gain from trade. In fact, it is possible for all investors to buy and sell stocks that subsequently perform well, while it is not possible for all investors to gain from trade.18
17 The large t-statistic on the relatively small monthly return of 17 basis points can be traced to the relatively low standard deviation on the difference in the monthly return of stocks bought by individuals less the monthly return of stocks sold by individuals. This is not terribly surprising, since individuals tend to buy and sell many of the same stocks.
18 If investors buy and sell stocks that subsequently perform well, there would be a relation between volume and subsequent returns. In the U.S., Gervais, Kaniel, and Mingelgrin (2001) document that high-volume stocks subsequently earn high returns.
III.C. Dollar Profits
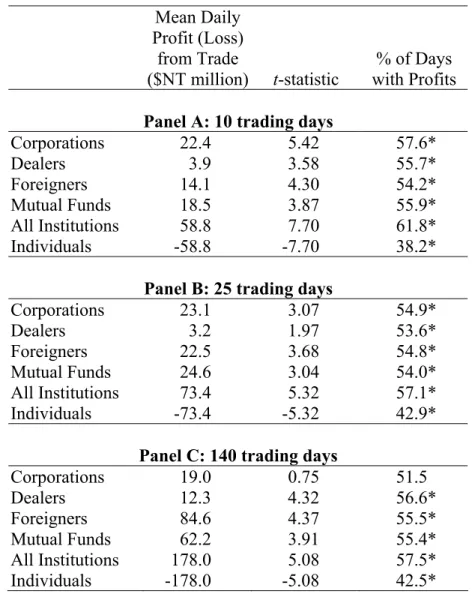
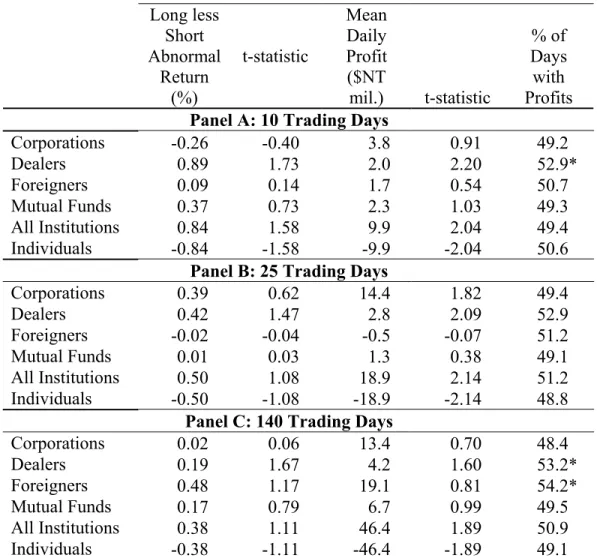
In Table 5, we present the dollar profits (and losses) from trade for each investor group. Profits (and losses) are calculated as the daily dollar gain on the buy portfolio (net of any market return) less the daily dollar gain on the sell portfolio (net of any market return). Of course, in aggregate the dollar profits from trade are precisely zero.
We test for statistical significance in two ways. First, we calculate a t-statistic using the time-series of daily profits. Second, we calculate the proportion of days on which dollar profits are positive and construct a standard binomial test of the null hypothesis that this proportion is equal to 50 percent (i.e., profits and losses are equally likely). The results of this analysis are qualitatively similar to the abnormal return results. Institutions earn reliably positive profits from trade, while individuals incur losses. The size of the profits generally increases with the horizon we consider, though a disproportionate amount of the profits are earned in the first ten and 25 days following trades. Of the total profit of $NT 178 million earned at a holding period of 140 trading days, roughly one-third are earned within the first ten trading days (seven percent of the days within the 140-day horizon) and 41 percent are earned within the first 25 trading days (18 percent of trading days within the 140-day horizon).
The results of our abnormal return and dollar profit calculations raise the obvious question of whether these gains grow at longer horizons. We also analyze holding periods of one year. The abnormal return measures remain reliably positive for institutions and reliably negative for individuals, though the measures are again smaller at a one-year horizon than at a six month (140-day) horizon. However, the average daily institutional gains from trade (and individual losses) are virtually identical at the one year and six month horizon.
III.D. Transaction Costs
Transactions costs put a sizable dent in the profits of institutions and exacerbate the losses of individuals. Our profits include any market impact from the transaction, since we include the intraday return on the day of the trade. Thus, the only trading costs we need to consider are commissions and transaction taxes. Commissions are capped at
0.1425 percent, so the average daily commissions paid by all institutions is easily calculated using the total value of buys and sells from Table 2. Over our sample period, institutions bought $NT 12.5 billion and sold $NT 12.5 billion of common stock. There are 1,397 trading days during our sample period. So, on the average day, institutions bought and sold $NT 9 billion. Thus, on the average day, institutions paid total commissions of $NT 25.6 million ($NT 9 billion x 0.001425 for buys and $NT 9 billion x 0.001425 for sells). Add to this the average daily transactions tax on sales of $NT 27 million ($NT 9 billion of sales x 0.003 transaction tax). Thus, on the average day, the total transaction cost including commissions and transaction taxes is $NT 52.6 million – roughly 30 percent of the average daily gain from trade of $NT 178 million. The average daily profit net of transaction costs ($NT 125.4) is reliably positive (t=3.58).
Not all institutions fair equally well net of trading costs. We conduct similar calculations for each institutional investor category. Net of transaction costs, the average daily profits of corporations, dealers, foreigners, and mutual funds are ($NT million) -3.1, 5.0, 75.5, and 48.4 (with t-statistics of -0.12, 1.74, 3.90, and 3.04, respectively). Seasholes (2000) presents evidence consistent with our findings on foreign investors. Using data on cross-border investments in Korean and Taiwanese stocks, Seasholes (2000) documents that foreigners increase positions prior to positive earnings surprises and decrease investments prior to negative surprises.
Similar calculations indicate individuals pay average daily commissions of $NT 216 million and average daily transaction taxes of $NT 228 million. Of course, these costs only serve to exacerbate the losses incurred by individuals.
III.E. Economic Significance
The estimation of dollar profits also affords us an opportunity to gauge the economic significance of the losses that individuals incur from trade. From 1995 to 1999, total reported personal income in Taiwan was $NT 51,896 billion. Over the same period, individuals lost $NT 249 billion ($NT 178 million daily loss x 1,397 trading days) from trade, paid $NT 303 billion in commissions and $NT 319 billion in transaction taxes. Together, trading losses, commissions, and taxes are $NT 871 billion or 1.7 percent of
total personal income. Similar calculations reveal that these losses are 1.5 percent of Taiwan’s total gross national product during this period. During our sample period, there are approximately 3.9 million individual investors who placed trades on the TSE. Our calculation of dollar losses indicate that the average investor experienced trading losses of $NT 223,333 ($US 7,545) during our five year sample period.
We can also do back-of-the envelope calculations to estimate the performance penalty suffered by individual investors. Individual investors held roughly 60 percent of all outstanding stock during our sample period. The average market value of all stock during our sample period was $NT 8,132 billion (see Table 1). Thus, trading losses represent roughly a daily performance penalty 0.36 basis points ($NT 178 million daily trading losses divided by $NT 8,132 total market value x 60 percent individual holding), while commissions and transaction taxes cost investors roughly 0.44 basis points and 0.47 basis points, respectively. Together, trading losses, commissions, and taxes exact a daily performance penalty of 1.27 basis points on the total invested wealth of individual investors. Annualized, this represents more than 3.5 percentage points.
Individual trading losses correspond to institutional trading gains. Thus, we can similarly calculate the average daily performance boost, net of commissions and transaction taxes, enjoyed by institutions. For institutions, the average daily values of trading gains, commissions, and transaction taxes are $NT 178 million, $NT 25.6 million, and $NT 27 million respectively. Thus, the average daily profit, net of commissions and transaction taxes, is $125.4 million. Institutions hold roughly 40 percent of all outstanding stock during our sample period. Thus, the net trading gains for institutions represent a daily performance boost of roughly 0.39 basis points ($NT 125.4 million daily trading gains divided by $NT 8,132 billion total market value x 40 percent institutional holding). Annualized, this represents 1.1 percentage points. Institutions are agents. Whether the principals represented by institutions ultimately enjoy this performance boost depends on the costs that institutions charge their principals for their portfolio management services.
Our analysis of institutional gains includes trading costs, but ignores information costs. Practically, information costs would include expenditures on all activities supporting trading operations (e.g., the hiring of analysts and the development of a trading room). In Grossman and Stiglitz (1980), informed investors earn a return on information gathering through trading profits. Net of trading costs, institutions earn annual trading profits of approximately $NT 35 billion. This estimate of trading gains places an upper bound on the amount institutions can profitably spend on information collection. According to the directorate-general of budget, accounting, and statistics in Taiwan, the mean annual salary for financial institutions (including banks, securities firms, and real estate agencies) is around $NT 800,000. (In Taiwan, the mean annual income in 1999 was $NT 390,000.) Assume those responsible for trading operations are paid a mean salary equal to that of financial institutions; annual trading profits of $NT 35 billion would support an industry of almost 43,750. Of course, professionals responsible for trading operations may be paid more than the mean income level for financial institutions. Even quadrupling the mean salary to $NT 3,200,000 (over $US 100,000) indicates the annual trading profits of $NT 35 billion would support an industry of almost 11,000 highly paid professionals.
III.F. Passive and Aggressive Orders
Why do institutions profit from trade, while individuals lose? If institutions possess superior information, they would likely place aggressive limit orders to buy undervalued stocks and to sell overvalued stocks to capitalize on their superior information. Alternatively, institutions could profit by providing liquidity to uninformed investors by placing passive limit orders to buy or sell stocks.
In addition to trade data, we have all orders (both filled and unfilled) that underlie these trades. Using these order data, we categorize each trade as aggressive or passive based on the order underlying the trade. This categorization involves three steps. First, for each stock, we construct a time series of clearing prices, the lowest unfilled sell limit order price, and the highest unfilled buy limit order price. These data are compiled by the TSE (the market display data) and are presented to market participants in real time. Second, we categorize all orders as aggressive or passive by comparing order prices to
the most recent unfilled limit order prices. Orders to buy with prices in excess of the most recent unfilled sell limit order are categorized as aggressive; those with prices below the most recent unfilled buy limit order are categorized as passive; those with an order price between the two unfilled limit order prices are categorized as indeterminant. There is an analogous algorithm for sells. Third, we match all orders to trades. This matching allows us to determine whether a trade emanated from a passive or aggressive order.
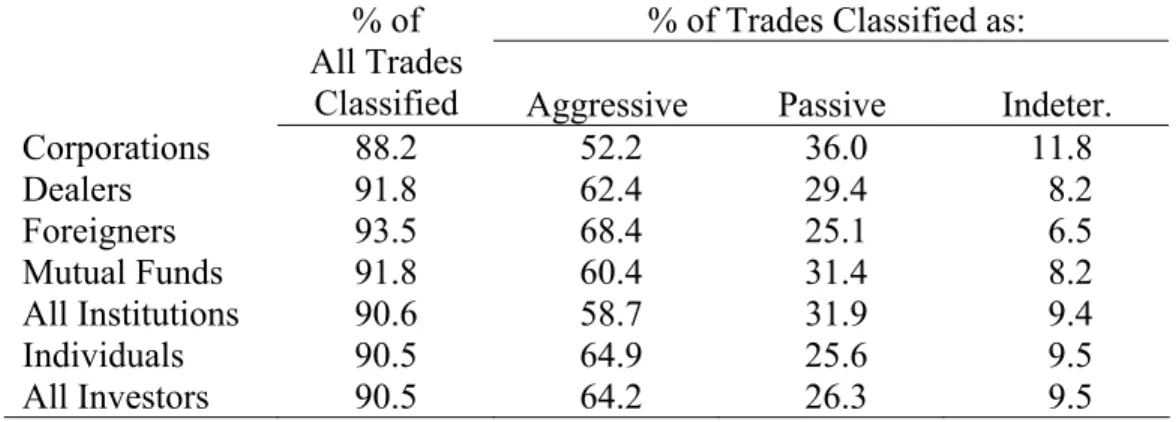
Using this algorithm, we are able to categorize 90 percent of all trades as passive or aggressive (see Table 6).19 The majority of executed trades – 64 percent – emanate from aggressive orders. Overall, individuals are more aggressive than institutions. However, there is considerable variation in the aggressiveness of institutions. Corporations are the most passive group of traders, while foreigners are the most aggressive group.
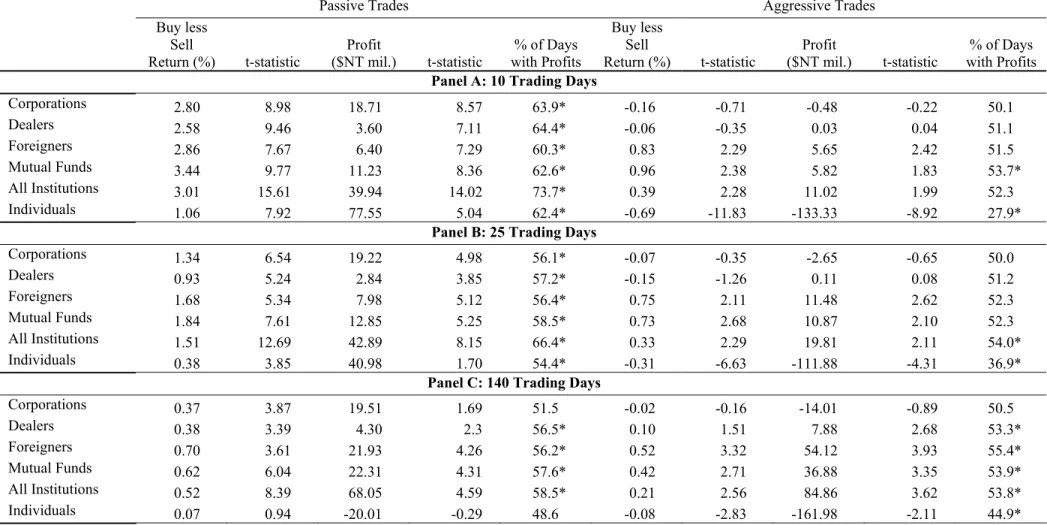
In Table 7, we present the returns and profitability of passive trades (columns two through six) and aggressive trades (columns seven through eleven). At horizons of ten and 25 trading days, all investors – including individuals – profit from passive trading. At the longer horizon of 140 trading days, institutions profit from passive trading, though individuals have no reliable gains from passive trading. In contrast, only institutions gain from aggressive trading, while individuals lose; this is true at all horizons analyzed. Among institutions, foreigners and mutual funds gain the most from aggressive trading, while corporations have no reliable gains or losses and dealers have reliable gains only at 140 trading days.
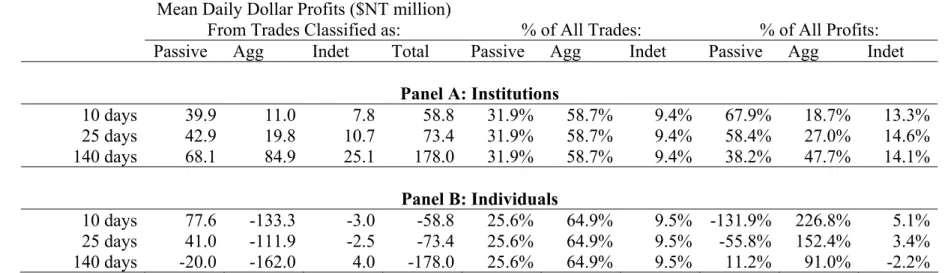
To put these results in perspective, we make two comparisons. First, we compare the profits from passive and aggressive trading to the total profits from all trades (see table 5). The results of this analysis are presented in Table 8. Though institutions profit from both passive and aggressive trading, a disproportionate amount of short-term profits can be attributed to passive trading. For example, at horizons of ten and 25 days, over
19 The indeterminant category also includes trades that we are unable to match to an order. We discussed this issue with the TSE and they suspect data entry errors in the order records is the source of the problem. Though annoying, this type of data error should not introduce any bias into our results.
half of institutional trading profits emanate from passive trading, which represents less than one-third of all institutional trades. In contrast, the losses incurred by individuals result almost entirely from their aggressive trades. In fact, at short horizons, individuals profit from their passive trades, but these profits are more than offset by the losses on their aggressive trades.
These results suggest institutions profit from passive trades by providing liquidity to investors who are, on average, uninformed (or misinformed). This is true at both short and long horizons. Institutions profit from aggressive trades, but it takes considerably more time for these profits to be realized. The lag in the profitability of institutions’ aggressive trades suggests it takes some time before the information possessed by institutions is impounded in market prices. In contrast, individuals lose money from aggressive trading. This is true at both short and long horizons. Individuals gain from their passive trades at short horizons, but these gains are eroded (and even reversed) at long horizons.
III.G. Market Timing
To this point, we have focused on the security selection ability of institutions and individuals. By calculating trading gains net of any market return, we have excluding any profits from market timing. In this section, we analyze the market timing ability of institutions and individuals.
The analysis of market timing is analogous to that of security selection, though we only consider the purchase and sale of two assets – the market portfolio and a riskfree asset. We ignore security selection, since we restrict our analysis to just the market portfolio and a riskfree asset. Essentially, we assume investors face a choice between investing in the market portfolio and the riskfree asset; increasing their investment in one reduces their investment in the other. Though a crude assumption that results in a noisy test of market timing ability, we are forced to make some assumption about the source of funds for new investment in the market and the use of funds from the proceeds of market portfolio sales. We also assume new investments in stock are made in the market portfolio, rather than the actual stock purchased, since here we are interested in market
timing ability, rather than security selection ability (the focus of our prior tests). As in our tests of security selection ability, we consider holding periods of ten, 25, and 140 trading days for the long and short portfolios.
On each day, we sum the total value of stock purchases and the total value of stock sales for each investor group. We then take the difference of these two sums. If individuals were net buyers of stock (i.e., the total value of buys exceeds the total value of sales), we construct a long portfolio that invests a dollar amount equal to their net long position in the market portfolio and a short portfolio that invests an equal amount in the riskfree asset. Thus, the long and short positions are of equal dollar value.
To test for abnormal returns from market timing, we first compound the daily returns and the long and short portfolios to yield a monthly time-series of returns for each portfolio. We then take the difference between the monthly return on the long portfolio and the short portfolio. This return is regressed on the market risk premium to calculate a Jensen’s alpha, where market timing is the only source of abnormal returns by construction. Our calculation of dollar profits is analogous to that for security selection, with one exception. From the realized dollar gain on the long portfolio, we subtract the expected gain, which is calculated using the Capital Asset Pricing Model and the beta of the long portfolio during the five-year sample period (Rft+βiRmt −Rft ). Essentially,
we are comparing the dollar gain of the long portfolio to the dollar gain of a portfolio that had a fixed investment in the market and the riskfree asset over the five-year sample period. There is an analogous calculation of the dollar profit for the short portfolio. The total gains from market timing are the sum of the gains on the long and short portfolio.
The results of this analysis are presented in Table 9. There is, at best, weak evidence of market timing ability. None of the Jensen’s alphas are reliably different from zero for any of the trader groups that we analyze. The only possible exception being the Jensen’s alpha for dealers at ten and 140 trading days, but these are only reliably positive at the ten percent significance level. The evidence from the analysis of dollar gains is slightly stronger and indicates that institutions gain while individuals lose from their
market timing ability. Even here, however, for each investor group, the proportion of days that institutions gain (and individuals lose) is not reliably different from 50 percent. Nonetheless, this analysis indicates that, if anything, market timing would add to the trading gains of institutions and exacerbate the trading losses of individuals. The point estimates of the dollar gains and losses from market timing are roughly one-fourth those from security selection.
III.H. Generalizing from Taiwan
We believe both theory and empirical evidence provide strong support for the view that better informed (institutional) investors will gain from trade, while less informed (individual) investors will lose. In Taiwan, institutions earn gross daily profits of $NT 178 million (roughly $US 6 million), while individuals lose the same amount. The U.S. equity market is the largest and most developed market in the world. Consequently, it is useful to compare and contrast the Taiwan and U.S. markets.
In extrapolating our results to other markets such as the U.S., we should bear in mind that the per trade losses suffered by Taiwanese individual investors may be less than the losses of individual investors in markets dominated by institutional investors. Taiwanese individuals—who account for 89.5% of trading volume—are far more likely to trade with other individuals, as opposed to institutions, than are individuals in countries such as the U.S. Thus, on a per trade basis, Taiwanese individuals are less exposed than U.S. individual investors to asymmetrical informational advantages held by institutional investors. This may be why Taiwanese individuals suffer lower gross trading losses per trade than those documented for U.S. individuals. In Table 4, we report that, over a horizon of 140 trading days, stocks bought by Taiwanese individuals underperform those sold by 4 basis points per month. Similar calculations for U.S. individuals indicate an underperformance of 20 basis points or more per month (Odean (1999), Barber and Odean (2001)).
Can the prevalence of day trading in Taiwan explain the institutional gains and individual losses that we document? Day trading in Taiwan represents more than 20 percent of total trading volume. Though precise data on day trading in the U.S. is sparse,
estimates of total volume that can be traced to day trading in the U.S. range from 15 to 30 percent.20 Thus, the high incidence of day trading does not appear to be unique to Taiwan.
In addition, Barber, Lee, Liu, and Odean (2004) document that virtually all day trading in Taiwan can be traced to individuals investors. In aggregate day traders earn gross profits (though these profits are not sufficient to cover transaction costs). Thus, the gross losses that we document for all individuals cannot be traced to the activity of
individual day traders.
Can the high turnover rates in Taiwan explain the institutional gains and individual losses? Annual turnover in Taiwan during our sample period averaged almost 300 percent; in contrast, turnover in the U.S. during the same period averaged 69 percent. Individual investors in Taiwan may trade so actively because they find trading more enjoyable than their American counterparts and thus willingly incur large losses for entertainment or they may trade more actively than U.S. investors because they are more overconfident.21 Since Taiwanese individual investors trade so actively—whether for entertainment or because of overconfidence—institutional investors could be earning their profits simply by supplying liquidity—e.g., serving as market-makers—to these overly aggressive investors. If so, we would expect institutional profits to be generated primarily by passive trades and realized at short horizons. While we do document that institutional investors earn short term profits by supplying liquidity to individual investors, approximately half of their profits are from aggressive trades and accrue at horizons of up to six months. This implies that these institutional investors are profiting from their information, not simply from their willingness to supply liquidity. Such an information advantage would be profitable even in the US where individuals are less
20 Britt Tunick, Day Traders Working Hard to Influence How the Profession is to be Defined, SEC.WEEK, May 24, 1999; Day Trading and Beyond: A New Year, An Updated View, Bear Stearngs, January 2001; David Tabok, Intraday Trading Rate in Shareholder Class Actions, Securities and Finance Insights, June 2002, NERA Economic Consulting.
21 Several studies document overconfidence tends to be greater in some Asian countries (e.g., China) than other cultures (e.g., U.S. and Japan). See, for example, Yates et al. (1998) and Lee et al. (1995).
exuberant traders, However, it is possible that the exuberant trading of Taiwanese individual investors create mispricings that are subsequently exploited by institutions.
Can the regulatory environment in Taiwan explain the gross institutional gains and gross individual losses? We do not believe this is the case for two reasons. First, business leaders and analysts do not perceive Taiwan as unusually corrupt. Transparency International constructs an annual corruption index for over 100 countries based on surveys of business leaders and risk analysts. In the 1999 survey, Taiwan ranked as the 28th least corrupt country – a rating similar to countries with larger stock markets: U.S. (18th), France (22nd), Spain (22nd), Japan (25th), and Italy (38th).22 Second, the financial reporting requirements and insider trading laws in Taiwan are substantively similar to those in the U.S.
During our sample period, two TSE stocks had level III American Depository Receipts (ADRs) trading in the U.S.: Micronix and Taiwan Semiconductors. The Micronix ADR began trading in the U.S. on May 9, 1996, while the Taiwan Semiconductor ADR began trading on October 8, 1997. This fact provides us with some ability to analyze the effect of the regulatory environment more carefully for two reasons. First, level III ADRs are required to meet the full registration and reporting requirements of the U.S. SEC's Exchange Act. Second, the presence of an ADR provides a near perfect substitute for the TSE listed stock facilitating arbitrage. In auxiliary analyses, we calculate the daily trading profits for institutions and individuals for these two stocks. Similar to our overall results, institutions gain, while individuals lose when trading these stocks after the introduction of the ADR. The post-ADR trades in these two stocks account for 9.7 percent of all institutional gains (and individual losses), but only four percent of total trading volume. Thus, the trades in these two stocks, which are very liquid, contain a close substitute in the U.S., and are subject to stringent SEC reporting requirements, are more profitable than other trades. This evidence indicates the unique features of the regulatory environment in Taiwan cannot explain our results.
22 Khwaja and Mian (2003) argue brokers in Pakistan are able to earn high returns by using manipulative trading practices. Pakistan ranks 98th in the Transparency International corruption index. In 1999, the total value of Pakistan’s stock market was less than $US 7 billion.
IV. Conclusion
Our empirical evidence comports neatly with the theoretical prediction of Grossman and Stiglitz (1980) that when information is costly some investors will earn greater expected profits than others. Institutions, which are on average the likely informed traders in financial markets, profit on their private information, while individuals, who are on average the likely uninformed traders in financial markets, incur trading losses. Before commissions and transaction taxes, the average daily institutional gain (and individual loss) is $NT 178 million. We estimate that, net of transaction costs, trading gains provide a performance boost of one percentage point annually to aggregate portfolio of institutional investors, while trading losses extract a penalty of 3.5 percentage points annually on the aggregate portfolio of individual investors.
Our empirical results suggest institutions profit in two ways. First, they provide liquidity to uniformed investors, thereby generating predominantly short-term profits. Second, they trade aggressively when they possess private information that indicates prevailing market prices are misaligned with their private estimate of value. The profits from aggressive trading accrue over longer horizons, as the private information of institutions is gradually revealed to market participants.
One puzzle remains. Why do individual investors willing incur such large net trading losses? We would expect uninformed investors to lose when trading with informed investors, but we would not expect them to incur transaction costs as high as those documented here. There are several reasons why uninformed investors might trade: liquidity requirements, rebalancing needs, hedging demands, entertainment, and the mistaken belief that they are informed, that is, overconfidence. Individual investors might need to trade to liquidate a portion of their portfolio or to invest savings, they might adjust the risk of their portfolios by rebalancing, or they might trade in order to hedge non-portfolio risks. It strikes us as unlikely that the liquidity, rebalancing, and hedging needs of Taiwanese investors account for annual turnover rates in excess of 300 percent annually. Why would liquidity, rebalancing, and hedging require more than four times as
much trading in Taiwan as in the US? Furthermore, liquidity, rebalancing, and hedging cannot explain the popularity of day trading in Taiwan.
Perhaps individual investors enjoy trading and receive utility from playing the game – even though they lose. This is a real possibility in the Taiwan market. Trading rooms are prevalent throughout Taiwan. Individual investors congregate daily at these venues affording an opportunity for social interaction. If entertainment motivates the trading of individuals, one can interpret our results as the price tag for this entertainment.
Finally, overconfidence can explain the trading losses incurred by individual investors. Odean (1998), Gervais and Odean (2001), and Caballé and Sákovics (2003) develop theoretical models of financial markets where investors suffer from overconfidence. These overconfidence models predict that investors will trade to their detriment.23 It is well documented that people tend to be overconfident (e.g., Alpert and Raiffa (1982), Griffen and Tversky (1992); see Odean (1998) for a more detailed review). Thus, overconfidence can explain the trading losses incurred by individuals.
Our empirical analysis cannot clearly distinguish between trading for entertainment and trading due to overconfidence. If investors trade solely for entertainment, they knowingly and happily incur losses in exchange for entertainment, with no detrimental effect on their utility. If trading is driven by overconfidence, individuals inadvertently incur losses, which reduces their overall utility. Both explanations are plausible in our setting and neither excludes the other. Our empirical findings on the profitability of aggressive and passive trading by individuals offer some illumination. Virtually all trading losses by individuals can be traced to their aggressive trading. If entertainment is the sole explanation for individual investor trading losses, this result suggests individual investors find aggressive trading more entertaining than passive
23 In an exception to this finding, Kyle and Wang (1997) argue that when traders compete for duopoly profits, overconfident traders may reap greater profits. This prediction is based on several assumptions that do not apply to individuals trading common stocks. Benos (1998) has a similar result. Daniel, Hirshleifer, and Subrahmanyam (1998) consider the asset price implications of overconfidence but do not directly address investor welfare.
trading. If overconfidence is the sole explanation, this suggests individuals trade more aggressively when they are overconfident. This is consistent with theoretical models of overconfident investors (e.g., Odean, 1998) and, in our opinion, a plausible explanation of these results.
In poker, professional players will beat amateur players most of the time. Not on every hand, but through the course of an evening’s game, the professional will usually come out ahead. This is because professional players possess better bluffing skills and better information about probability outcomes. Similarly, in financial markets, we provide compelling evidence that professional (institutional) investors beat amateur (individual) investors. This is almost certainly because professional investors possess some combination of better information and better skill at processing and utilizing information. Amateur (individual) investors lose either because they enjoy doing so or because they are overconfident about their ability to play the game.
References
Ackermann, Carl, Richard McEnally, and David Ravenscraft, 1999, The performance of hedge funds: Risk, return, and incentives, Journal of Finance, 54, 833-874.
Agrawal, Vikas, and Narayan Y. Naik, 2000, On taking the alternative route: The risks, rewards, and performance persistence of hedge funds, Journal of Alternative Investments, 2, 6-23.
Alpert, Marc, and Howard Raiffa, 1982, A progress report on the training of probability assessors, in Daniel Kahneman, Paul Slovic, and Amos Tversky, eds.: Judgment Under Uncertainty: Heuristics and Biases, (Cambridge University Press,
Cambridge and New York).
Amin, Gaurav S., and Harry M. Kat, 2003, Hedge fund performance 1990-2000: Do the “money machines” really add value?, Journal of Financial and Quantitative Analysis, 38, 251-274.
Barber, Brad M., and Terrance Odean, 2000, Trading is hazardous to your wealth: The common stock investment performance of individual investors, Journal of Finance, 2000, Vol. 55, No. 2, p.773-806.
Barber, Brad M., and Terrance Odean, 2001, Boys will be boys: Gender, overconfidence, and common stock investment, Quarterly Journal of Economics, 116, 261-292.
Barber, Brad M., Yi-Tsung Lee, Yu-Jane Liu, and Terrance Odean, 2004, Do individual day traders make money? Evidence from Taiwan, working paper, UC-Davis, Davis, CA.
Benos, Alexandros V., 1998, Aggressiveness and survival of overconfident traders,
Journal of Financial Markets, 1, 353-383.
Brown, Stephen J., William N. Goetzmann, and Roger G. Ibbotson, 1999, Offshore hedge funds: Survival and performance, 1989-95, Journal of Business, 72, 91-117.
Caballé, Jordi, and József Sákovics, 2003, Speculating against an overconfident market,
Journal of Financial Markets, 6, 199-225.
Carhart, Mark M., 1997, On persistence in mutual fund performance, Journal of Finance,
52, 57-82.
Chan, Hsiu-Lang, Narasimhan Jegadeesh, and Russ Wermers, 2000, The value of active mutual fund management: an examination of the stockholdings and trades of fund managers, Journal of Financial and Quantitative Analysis, 35, 343-368.