Performance Analysis of a Truncated Closed-Loop
Power-Control Scheme for DS/CDMA
Cellular Systems
Chieh-Ho Lee, Student Member, IEEE, and Chung-Ju Chang, Senior Member, IEEE
Abstract—This paper analyzes the system performance of a truncated closed-loop power-control (TCPC) scheme for uplinks in direct-sequence/code-division multiple-access cellular systems over frequency-selective fading channels. In this TCPC scheme, a mobile station (MS) suspends its transmission when the short-term fading is less than a preset cutoff threshold; otherwise, the MS transmits with power adapted to compensate for the short-term fading so that the received signal power level remains constant. Closed-form formulas are successfully derived for performance measures, such as system capacity, average system transmission rate, MS average transmission rate, MS power consumption, and MS suspension delay. Numerical results show that the analysis provides reasonable accuracy and that the TCPC scheme can substantially improve the system capacity, the average system transmission rate, and power saving over conventional closed-loop power-control schemes. Moreover, the TCPC scheme under real-istic consideration of power-control error due to power-control step size, power-control period, power-control command loop delay, and MS velocity is further investigated. A closed-form formula is obtained to accurately approximate the system capacity of the realistic TCPC scheme.
Index Terms—Power consumption, short-term fading, sus-pension delay, system capacity, transmission rate, truncated closed-loop power control (TCPC).
I. INTRODUCTION
I
N A direct-sequence/code-division multiple-access (DS/CDMA) system, many users can transmit messages si-multaneously over the same radio channel, each using a specific spread-spectrum pseudonoise (PN) code [1]. Within a cell, the code channels in downlinks can be considered as mutually or-thogonal because downlinks may exhibit synchronous CDMA transmission. However, these code channels in uplinks cannot be exactly mutually orthogonal for a set of asynchronous users; thus, mutual interference occurs among the uplinks. In such a case, a strong signal increases communication quality and a weak signal may suffer from strong interference. This problem is referred to as the near–far effect and limits the CDMA system capacity [2]. Hence, power control is an essential issue in a DS/CDMA system.Manuscript received June 28, 2001; revised March 28, 2002, October 17, 2002, October 6, 2003, and February 19, 2004. This work was sup-ported by the National Science Council, Taiwan, R.O.C., under Grant NSC-89-2219-E-009-035 and the Computer and Communications Research Laboratories, Industrial Technology Research Institute (ITRI) under Grant T2-89042-m.
The authors are with the National Chiao Tung University, Hsinchu, Taiwan, R.O.C. (e-mail: [email protected]; [email protected] ).
Digital Object Identifier 10.1109/TVT.2004.830141
Open-loop power control, that is, the average power control,
is applied to compensate for the long-term channel fading such that the average received signal power level is constant and the near–far problem is solved [3]. Closed-loop power control, how-ever, is typically used to mitigate the short-term channel fading so that an acceptable received signal quality can be attained for the uplink communication. Several closed-loop/open-loop power-control schemes have been investigated, such as: 1) the well-known perfect power control, within which MS transmis-sion power is adjusted to the exact inverse of the short-term fading and, thus, the received signal power level remains con-stant (such a method is also referred to as the “channel-inversion scheme”) [4], [5]; 2) combined power/rate control proposed in [6], which is the same as the perfect power control except in that MS holds its transmission power at and adapts its transmission rate to when , where is the desired received power level, is a preset cutoff threshold, is the short-term fading at time , and is the data symbol rate; 3) truncated average power control (TAPC) proposed in [7], which applies a truncated channel-inversion scheme to con-ventional average power control. This truncated channel-inver-sion scheme suspends transmischannel-inver-sion when the long-term channel
fading falls below a cutoff threshold; otherwise, it adaptively
controls power according to the channel-inversion scheme. By suspending transmission in this way, an improvement of system capacity was reported.
In this paper, we propose a truncated closed-loop power-con-trol (TCPC) scheme, which extends the TAPC scheme by considering the fast closed-loop power control, since mitigating the rapid variations of fading by power-control mechanism had been adopted in third-generation (3G) systems such as cdma2000 and WCDMA. In the TCPC scheme, when the short-term fading satisfies , MS suspends transmis-sion; otherwise, MS adaptively transmits power to compensate for the short-term fading, so that the received signal power level is constant. This paper analyzes the performance of the TCPC scheme for uplinks in DS/CDMA cellular systems over frequency-selective fading channels. It first analyzes an ideal TCPC scheme in which the transmission power is continuously and instantaneously adjusted. Based on the signal-to-interference ratio (SIR) formula over a medium-term period, closed-form formulas are successfully derived for system performance including system capacity, average system transmission rate, MS average transmission rate, MS power consumption, and MS suspension delay. The upper limit of the average system transmission rate of the TCPC scheme
achieved in a multicell system is also obtained and it is found to be the same as that of the perfect power-control scheme in a single-cell system. Numerical results show that the analysis is quite accurate; the TCPC scheme is more effective than the conventional closed-loop power-control schemes such as perfect power control [4], [5], combined power/rate control [6], and TAPC [7]. This paper further analyzes the realistic TCPC scheme that considers power-control error due to power-con-trol step size, power-conpower-con-trol command loop delay, and MS velocity. A closed-form formula is also derived to accurately approximate the system capacity of the realistic TCPC scheme. Numerical results indicate that the power-control error has a significant impact on the system capacities of the TCPC and conventional closed-loop power-control schemes.
The rest of this paper is structured as follows. Section II in-troduces the system model and derives a formula of the received SIR per bit. Section III derives the performance measures of the TCPC scheme in both ideal and realistic cases. Section IV presents numerical results as well as simulation results for val-idation. Comparisons between TCPC and other conventional schemes are also presented. Finally, Section V is the conclusion.
II. SYSTEMMODEL
A. Channel Model
Consider cells in a CDMA cellular system of which the central cell is surrounded by other cells in a hexagonal-grid configuration. Each cell has a base station (BS) located at the center and has MSs uniformly distributed in the system. Generally, the frequency-selective multipath channel of the uplink ( ), denoting the channel from any MS to any BS , is described by a time-variant impulse response
, where represents the chip duration, is the number of resolvable paths, and the random variables and are the power gain and phase of the th path at time , respectively [1].
The power gain of the th path can be divided into two parts, [8], where
and represent long-term and short-term fading, respectively. Long-term fading is normally modeled as , where and are complex numbers that represent the locations of MS and BS , respectively. is the propagation exponent that depends on the environment and is a zero-mean
Gaussian-random process with standard deviation . The short-term fading is widely modeled as Rayleigh fading and is exponentially distributed. For convenience, the multipath intensity profile (MIP) [1] of each uplink is assumed to be identical and every signal path has the same average re-ceived power. Without loss of generality, the overall short-term fading effect , given the optimal maximal ratio combing, is normalized to have unit mean. Thus, the probability density function (pdf) of , denoted by
, is found to have a gamma distribution.
B. Transmitter Model
If binary phase-shift keying (BPSK) modulation is consid-ered, the transmitted low-pass equivalent signal of MS is
given by ,
where is MS transmission power at time , is the MS bipolar data stream, is the corresponding PN sequence whose chip waveform is rectangular, is a value between zero and the data symbol duration and indicates each MS independent symbol timing due to asynchronous transmission, and is the random carrier phase. Under a transmission power control, can be conceptually divided into two parts as , where
and are the transmission powers controlled by open-and closed-loop power-control schemes, respectively. This paper assumes perfect open-loop power control; hence, for each MS served by its home BS , we have .
C. Receiver Model
Here, we consider a medium-term period that is sufficiently long to make the short-term fadings be averaged out while the long-term fadings remain almost constant, since MSs move only a little. Also, the set of the long-term fading from any MS to any BS is referred to as a scenario and is represented as , from which its time index is dropped. Based on the models of channel impulse response and the MS transmitted signal, the total signal received at a BS can be found to be as shown in (1) at the bottom of the page, where the background noise is ignored since it is much smaller than the other-cell interfer-ence. Consider a RAKE receiver with an optimal maximal ratio combiner to take full advantage of the multipath diversity. Here, we assume slow fading such that , , , and can be treated as constants , , , and , respectively, for all possible , , and , during
(1)
the th data symbol period. The decision statistics corre-sponding to an MS at cell can be derived and divided into three parts, as shown in (2) at the bottom of the previous page.
The first term is the desired signal part given by . The second term represents the multiple access and multipath in-terference from the other MSs and can be obtained as shown by (3) at the bottom of the page, where [see (4) at the bottom of the page]. Over the medium-term period, the long-term fading, which is the local mean of the channel gain, is treated as constant and the short-term fading is typically modeled as a stationary random process. Hence, the channel gain, which is the product of the long- and short-term fading, becomes a stationary random process. The transmission power under strength-based power control, which generally is a function of channel gain, will also turn out to be stationary. If both MS data streams and PN sequences are assumed to be stationary, then the interference signal in (4) will resemble a noise-like stationary random process and its distribution can be approximated by a Gaussian one according to the central limit theorem. Notably, has a mean of zero and a variance, which is the mean of the interference signal power at the output of the RAKE receiver, given by
(5)
where is the processing gain [1] and is the ex-pectation function. The third term represents the multipath interference itself, since , would be much smaller than and the effect of is ignored in the fol-lowing.
The SIR per bit during the th data symbol period of MS at the output of RAKE receiver, defined in [1, p. 244 ] and denoted by , is given by
(6) where is the instantaneously received signal power and and represent the mean power of the intracell interference signals and the mean power of the other-cell interference
sig-nals, respectively. In general, the term can be obtained by
Assuming that are independently and identi-cally distributed (i.i.d.) with a mean of , are also i.i.d. random variables with a mean of . From (5) and (6), and can be obtained by
(7) (8) where the in (8) refers to the set of the MSs that are served by BS .
III. PERFORMANCEANALYSIS
In the TCPC scheme, MS adjusts its transmission power to compensate for the short-term fading when the it is above a preset cutoff threshold and suspends its transmission oth-erwise. Accordingly, considering an uplink ( )
as
as (9) where denotes the preset desired received power level. If the transmission power can be adjusted continuously and
imme-diately, as shown in (9), the scheme is referred to as an ideal
TCPC.
A. Ideal TCPC
Conditional with , the SIR per bit in (6) given
is time constant over the medium-term period. The uncondi-tioned SIR per bit is then obtained by considering all possible . The formula of the unconditioned SIR per bit is the same as (6), but its denominator is now a random variable due to the randomness of . Again, applying the central limit the-orem, the normalized , represented as , can be approximated by a Gaussian random variable and expressed as
(10)
(3)
where and are the mean and variance of , respectively, when . The terms and can be obtained by
(11)
where . The was analyzed by Zorzi [9] and its mean and variance can be numerically com-puted as
(12) (13) where
(14) denotes the pdf of a random variable , and
(15) Considering an MS in central cell , the outage proba-bility of the uplink ( ), denoted by , is defined as
(16) where is the minimum SIR per bit required to achieve a desired bit-error rate at the output of the RAKE receiver. The outage probability given is not considered, since no data is transmitted in that case. Notably, only the statistics re-lating to the central cell are taken into account to avoid the corner effect. Using (6) and (10), can be approximated by
(17) where indicates the cumulative distribution func-tion (cdf) of a Gaussian variable with mean and
vari-ance . The average transmission power , controlled by the closed-loop power control, can be obtained by
(18) where denotes the cdf of a two-parameter gamma-random variable with parameters and . The average received power can be obtained by
(19) Five performance measures are investigated. The first mea-sure is the system capacity , which is defined as the maximum number of users per cell that the system can support under the constraint that the outage probability of an arbitrary MS in cen-tral cell is less than a preset outage threshold . That is
(20) where the operator denotes the maximum integer below the argument. Substituting (17) into (20) yields where
satisfies
(21) which is rewritten in the form of where (22) Accordingly, the capacity under the TCPC scheme is given by
(23) Notably, when , the TCPC is reduced to the perfect power control and the above analyzes remain applicable. On the other hand, when , , , and the capacity becomes infinite.
The second measure is the MS average transmission rate , which is
(24) where is the symbol rate.
The third measure is the average system transmission rate , which is defined as the average transmission rate multiplied by the system capacity. Thus, is given by
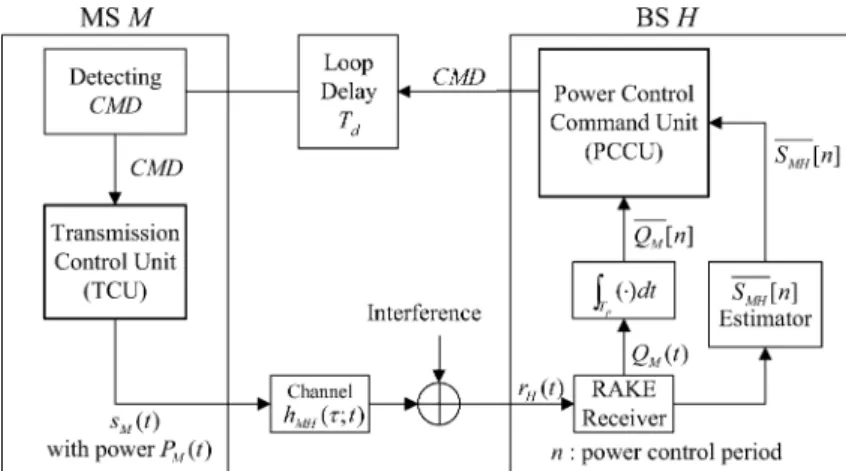
Fig. 1. Functional blocks of the realistic TCPC scheme.
such that can be approximated as a monotonously increasing function of . When , (25) corresponds to the average system transmission rate of the perfect power-control scheme and is the lower limit of . While , the factor in (25) approaches zero and the upper limit of the average system transmission rate in a multicell system under TCPC is
(26) which is just the upper limit of the average system transmission rate in a single-cell system under perfect power control.
The fourth measure is the MS average transmission energy per bit , which is defined as the average ratio of MS mission power to its transmission rate when data is being trans-mitted. is given by
(27) The last measure is the MS average suspension delay . It is, in fact, the average fade duration defined as [10, p. 189]
(28) where and is the level-crossing rate at a given strength level . Envelope follows a Nak-agami distribution, since the overall short-term fading
follows a gamma distribution. Consequently, as in [11], and are
(29) and
(30)
where is the maximal Doppler frequency and
denotes the pdf of a two-parameter gamma-random variable with parameters and .
B. Realistic TCPC
Considering that MS transmission power is adjusted dis-cretely according to finite-bit power-control commands and factors of power-control error (PCE) due to step size for power adaptation , power-control command loop delay , MS velocity , and power-control period , the TCPC scheme is referred to as a realistic TCPC scheme.
Fig. 1 presents the functional blocks of the realistic TCPC scheme. The transmitted signal with power from MS will pass through the channel and suffer inter-ference from other MS transmissions. The received signal at the BS is then fed into the optimal RAKE receiver to extract the averaged signal power and to estimate the average short-term channel fading over the th power-control period. The BS has a power-control command unit (PCCU) to generate the power-control command CMD periodically
if if
"suspend," if .
(31) The is then transmitted through the downlink channel to the destination MS, which has a transmission-control unit (TCU) that adjusts according to the received . It suspends the transmission temporarily if the received is “suspend” and adapts its transmission power by an amount of
dB otherwise.
In the realistic TCPC scheme, the received power is no longer a time constant. Conditional with , the PCE is de-fined as . Thus, the outage probability turns out to be the average of (16) over all possible PCE values. Using (10), can be approximated by (32), shown at the bottom of the page, where is the Gaussian pdf function and
As shown in (32), equals an arithmetic average of with weighting function of . Since
is a bell-shaped-like curve with peak at , can be accurately approximated by
(34) Based on the system-capacity definition given in (20), the system capacity can then be approximated by
(35) From (35), it is found that the factor is usually a number larger than other factors, whereby the PCE plays an important role in affecting the system capacity . The higher the disper-sion degree of PCE is, the lower the factor and the system capacity will be. Note that merely the factor is enough to estimate the system capacity and that the knowledge of the whole distribution of PCE is not necessary. On the other hand, the factor has nothing to do with closed-loop power control and is the same as that given in (11). The and in the realistic TCPC scheme depend on several factors including cutoff threshold , step size , power-control command loop delay , number of resolvable paths, and MS velocity . Hence, it is difficult to derive general formulas for and . The simulation shows that the and in the realistic TCPC scheme can be adequately approximated by the analytical re-sults given in (18) and (19), respectively. Based on the above approximations and by assuming that the factor is ob-tainable, the system capacity can be calculated.
Additionally, we assume that the average short-term channel fading is still Rayleigh distributed. Therefore, the per-formance measures , , and have the same formulas given in (24), (27), and (30), respectively. Finally, is computed ac-cording to its definition. Notably, as , the realistic TCPC becomes a realistic perfect power control and the above analyzes remain applicable.
The realistic TCPC has an issue with how the transmitter can understand when turns out to be good after a bad period. Using the real TCPC applied to a WCDMA system [12] as an example, the WCDMA system has two types of uplink dedicated physical channels (DPCHs): the uplink dedicated physical data channel (DPDCH) and the uplink dedicated physical control channel (DPCCH). Each connection is allocated a DPCH including one DPCCH and several DPDCHs. The DPDCH is used to send user data and its transmission is suspended when the received CMD is “suspend.” The DPCCH
is used to carry control information, including pilot symbols, power-control command for downlink power control, and rate information of current uplink transmission, required by the BS and the DPCCH is basically always on, even when the DPDCH is suspended. Thus, whenever the transmission of DPDCH is suspended, the receiver can somehow monitor the DPCCH channel condition and generate the power-control command according to (31).
Another issue is related to the MS velocity. By (30), for a mobile speed lower than 320 km/h, the average fade duration can be found greater than or equal to one power-control period and the TCPC scheme is still workable. As the mobile speed in-creases, the appearance probability of “suspend” command de-creases and the TCPC scheme degrades toward the conventional closed-loop power-control scheme.
IV. NUMERICALRESULTS
In the following examples, the DS/CDMA system has cells, the propagation exponent , the shadowing ef-fect , the resolvable path number , the processing gain , the outage threshold , and dB to yield BER [14]. The Rayleigh-fading random processes are generated according to Jake’s model. Also, MS velocity
km h; the step size of power adaptation dB, the power-control period ms, and the power-control com-mand loop delay are assumed for a realistic case. The antenna heights used with MS and BS are simply set to 0.003 and 0.01 times the BS radius, respectively, to prevent the occurrence of “zero distance” between an MS and a BS. The following figures show the numerical results of the performance of the ideal and realistic TCPC schemes, together with perfect power control [4], [5], combined power/rate control [6], and TAPC [7]. Simulation results are also provided to validate the theoretical analysis of the TCPC scheme. Notably, the perfor-mance of the perfect power-control scheme is directly obtained from TCPC by setting ; the cutoff thresholds for TAPC are applied such that the corresponding truncation probabilities are 10%.
For each scenario, the is randomly generated according to the channel model and the MS locations are uniformly distributed. can, thus, be calculated according to (8). Since TCPC is a type of strength-based power control, the distributions of and PCE , the average received power , and the average MS transmission power are obtained by a bit-level single-link simulation with 10 000 power-control cycles. Based on the above factors, the outage probability can then be calculated. For each , the
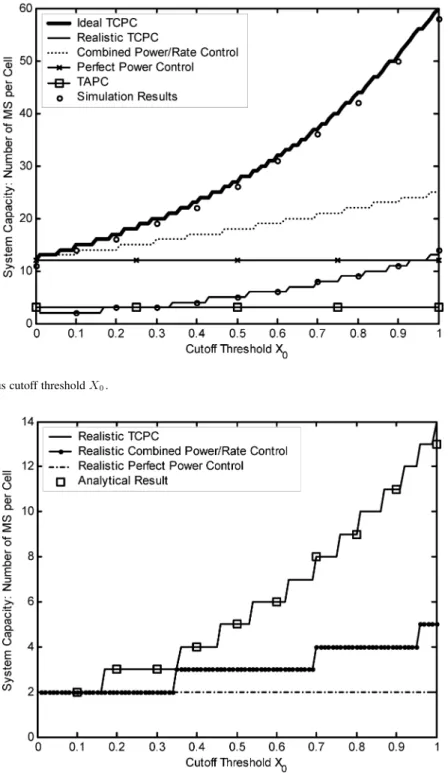
Fig. 2. System capacityC versus cutoff threshold X .
Fig. 3. System capacityC of various realistic power-control schemes versus cutoff threshold X .
overall outage probability is obtained by averaging the outage probability over 10 000 scenarios. Equivalently, the effect of MS movement on the outage probability is taken into account by considering many scenarios. The system capacity is then obtained. The other performance measures, including , , and , are also obtained by a bit-level single-link simulation. Finally, is calculated.
Fig. 2 plots the system capacity versus the cutoff threshold . It can be seen that the differences between analytical re-sults and simulation rere-sults are small, which indicates that the theoretical analyzes of the ideal and realistic TCPC schemes are quite accurate. Besides, it can be found that the ideal TCPC
achieves the greatest system capacity over all the cutoff thresh-olds. This is mainly because TCPC suspends transmission as soon as the channel becomes bad, effectively reducing mutual interference. As increases, the system capacity of the TCPC scheme rises at the cost of average transmission rate reduction and longer suspension delay, shown subsequently. TAPC has a low capacity because it suffers the short-term fading, although it employs a transmission-suspension mechanism to reduce mu-tual interference. Considering the case of for instance, the ideal TCPC can accommodate 37 MSs, while the combined power/rate control, perfect power control, and TAPC at the trun-cation probability of 10% can only accept 20, 12, and 3 MSs,
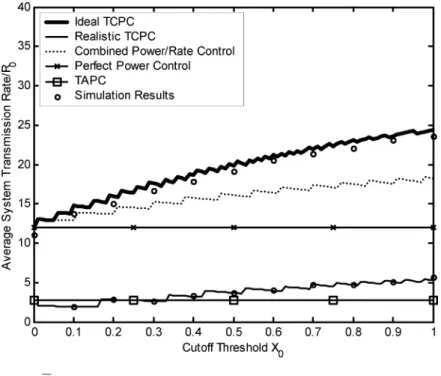
Fig. 4. Average system transmission rate< versus cutoff threshold X .
Fig. 5. MS average transmission rateR versus cutoff threshold X .
respectively. Also, the realistic TCPC scheme yields a system capacity by lower than that of the ideal TCPC scheme, which reveals that the PCE indeed has a great impact on the system capacity of the TCPC scheme.
Fig. 3 further plots the system capacity of various realistic power-control schemes versus the cutoff threshold . These simulation results show that the system capacity of each re-alistic power-control scheme is tremendously reduced by the PCE, as compared with the results of the ideal power-control schemes shown in Fig. 2. Also, the TCPC again attains the greatest system capacity in the realistic situations.
Fig. 4 plots the average system transmission rate versus , where is normalized by the default rate . The ideal
TCPC scheme is found to have the highest value. In the ex-ample with , the ideal TCPC is 133% of that of the combined power/rate control scheme, 183% of that of the perfect power-control scheme, and 815% of the TAPC scheme at the truncation probability of 10%. A larger results in a higher . Notably, is a zigzag increasing function of , not directly proportional to . The stepwise constant capacity and declining MS average transmission rate cause the zigzag curves of the TCPC and combined power/rate control schemes in the figure.
Fig. 5 shows the MS average transmission rate versus , where is also normalized by . Of these power-control schemes, TCPC has the lowest due to the transmission
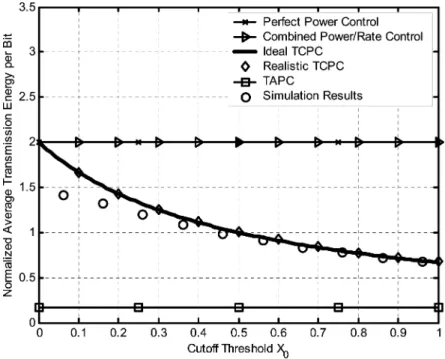
Fig. 6. MS average transmission energy per bit versus cutoff thresholdX .
Fig. 7. MS average suspension delayD versus cutoff threshold X .
suspension, while TAPC is 0.9, since its suspension probability is considered to be 10%. The low value of the TCPC scheme is a side effect. However, TCPC maintains the greatest average system transmission rate, as shown in Fig. 4. The side effect can be mitigated by either increasing the default rate or by assigning more than one code channel to an MS. Notably, the analytical curve of the realistic TCPC scheme coincides with that of the ideal TCPC scheme due to the assumption made in Section III-B.
Fig. 6 shows the MS average transmission energy per bit versus , where is normalized by that of the perfect av-erage power-control scheme. It can be found that TAPC saves the power most, followed by TCPC. The reason is intuitive:
both schemes apply the transmission-suspension strategy. MS power consumption under perfect power control is highest, since the MS uses high power to compensate for deep fading. One extreme case is : the of the perfect power-control scheme is theoretically infinite, which can be obtained by letting in (18), causing infinite interference and zero capacity. Also, the higher the is, the more power the TCPC scheme can save. For , it can be seen that the simulation re-sults can be well approximated by the analytical rere-sults, which supports the using (27) as the analytical formula of for the realistic TCPC scheme in Section III-B.
Fig. 7 shows the MS average suspension delay of the real-istic TCPC scheme versus for km h.
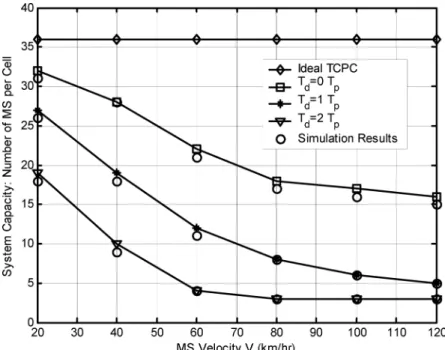
Fig. 8. System capacity versus MS velocity for power-control command loop delayT = 0, 1 1 T , 2 1 T .
A larger induces a longer suspension delay, which is unde-sirable for real-time service. Such a suspension delay is another side effect of the TCPC scheme. However, once the delay re-quirement is stated, the upper limit of for the best perfor-mance can be obtained. As shown in the figure, should be less than 0.75 to guarantee that the suspension delay is less than 80 ms, as the velocity is greater than 3 km/h. The TAPC suspen-sion delay would be much longer than that of the TCPC scheme, since the variation of long-term fading is much slower than that of short-term fading [8].
Fig. 8 plots the system capacity of the realistic TCPC scheme versus the MS velocity at cutoff threshold and step size dB for power-control command loop delay , , . It is found that the factor of MS velocity greatly af-fects system performance. For the case of , the system capacity is 27 for km h, which is 75% of the system ca-pacity in the ideal case. The caca-pacity drops rapidly and becomes only 5 for km h. The performance degradation is even worse for . Although the case of is practically impossible, its corresponding performance curve serves as an upper bound for the realistic TCPC scheme. The space between the performance curves for and means the performance gain that a power-control scheme equipped with channel gain predictor to compensate the effect of power-con-trol command loop delay could have.
V. CONCLUSION
This paper analyzes the system performance of a TCPC scheme for uplinks in DS/CDMA cellular systems over fre-quency-selective fading channels. Based on the SIR formula over a medium-term period, closed-form formulas for five performance measures are successfully obtained, including system capacity, average system transmission rate, MS average transmission rate, MS average transmission energy per bit, and MS average suspension delay. This TCPC scheme is further
analyzed under realistic conditions of PCE due to power-con-trol command loop delay, step size for power adaptation, and MS velocity. Simulation results are also provided to validate the theoretical analysis. Results show that the analysis is accurate and that the TCPC scheme can greatly improve the system performance. This analytical approach can also apply to the conventional perfect power control by setting . Notably, based on the SIR formula over the medium-term period, the analytical method presented herein can be easily extended for the study of another type of strength-based closed-loop power-control scheme in either circuit-switched or packet-switched CDMA systems.
ACKNOWLEDGMENT
The authors would like to thank the anonymous reviewers for their constructive suggestions for improving the presentation of this paper.
REFERENCES
[1] J. G. Proakis, Digital Communications, 3rd, Ed. New York: McGraw-Hill, 1995.
[2] R. Prasad and M. Jansen, “Near-far-effects on performance of DS/SS CDMA systems for personal communication networks,” in Proc. IEEE
VTC’93, May 1993, pp. 710–713.
[3] S. Ariyavisitakul and L. F. Chang, “Simulation of CDMA system per-formance with feedback power control,” Electron. Lett., vol. 27, no. 23, pp. 2127–2128, 1991.
[4] A. J. Goldsmith and P. P. Varaiya, “Capacity of fading channels with channel side information,” IEEE Trans. Inform. Theory, vol. 43, pp. 1986–1990, Nov. 1997.
[5] A. J. Goldsmith and S. G. Chua, “Variable rate variable-power MQAM for fading channels,” IEEE Trans. Commun., vol. 45, pp. 1218–1230, Oct. 1997.
[6] B. Hashem and E. Sousa, “A combined power/rate control scheme for data transmission over a DS/CDMA system,” in Proc. IEEE VTC’98, vol. 2, May 1998, pp. 1096–1100.
[7] S. W. Kim and A. J. Goldsmith, “Truncated power control in code-divi-sion multiple-access communications,” IEEE Trans. Veh. Technol., vol. 49, pp. 965–972, May 2000.
[8] T. S. Rappaport, Wireless Communications Principles and
[9] M. Zorzi, “On the analytical computation of the interference statistics with applications to the performance evaluation of mobile radio sys-tems,” IEEE Trans. Commun., vol. 45, pp. 103–109, Jan. 1997. [10] W. C. Y. Lee, Mobile Communications Engineering. New York:
Mc-Graw-Hill, 1982.
[11] M. D. Yacoub, J. E. V. Bautista, and L. G. de R. Guedes, “n higher order statistics of the Nakagami-m distribution,” IEEE Trans. Veh. Technol., vol. 40, pp. 790–794, May 1999.
[12] “Physical Channels and Mapping of Transport Channels onto Physical Channels (FDD),” 3GPP TS25.211, V3.1.1, 1999.
[13] A. Abrardo, G. Giambene, and D. Sennati, “Optimization of power control parameters for DS-CDMA cellular systems,” IEEE Trans.
Commun., vol. 49, pp. 1415–1424, Aug. 2001.
[14] K. S. Gilhousen, I. M. Jacobs, R. Padovani, A. J. Viterbi, L. A. Weaver Jr., and C. E. Wheatley III, “On the capacity of a cellular CDMA system,” IEEE Trans. Veh. Technol., vol. 40, pp. 303–312, May 1991.
Chieh-Ho Lee (S’01) was born in Taiwan, R.O.C.,
on November 24, 1969. He received the B.E. and M.E. degrees in communication engineering from National Chiao Tung University, Hsinchu, Taiwan, in 1991 and 1993, respectively, where he is currently working toward the Ph.D. degree in communication engineering.
From 1995 to 1997, he was an Engineer in a communication equipment company, where he was involved in the digital signal process programming of the modem. His research interests include power control in cellular radio systems.
Chung-Ju Chang (S’84–M’85–SM’94) was born
in Taiwan, R.O.C., in August 1950. He received the B.E. and M.E. degrees in electronics engineering from National Chiao Tung University (NCTU), Hsinchu, Taiwan, in 1972 and 1976, respectively, and the Ph.D degree in electrical engineering from National Taiwan University (NTU), Taiwan, in 1985. From 1976 to 1988, he was with the Telecom-munication Laboratories, Directorate General of Telecommunications, Ministry of Communications, Taiwan, as a Design Engineer, Supervisor, Project Manager, and then Division Director. There, he was involved in designing digital switching system, rural automatic exchange (RAX) trunk tester, integrated services digital network (ISDN) user-network interface, and ISDN service and technology trials in Science-Based Industrial Park. He also acted as a Science and Technical Advisor for the Minister of the Ministry of Communications from 1987 to 1989. In 1988, he joined the Faculty, Department of Communication Engineering and Center for Telecommuni-cations Research, College of Electrical Engineering and Computer Science, NCTU, as an Associate Professor. He has been a Professor since 1993 and was Director of the Institute of Communication Engineering from August 1993 to July 1995 and was Chairman of the Department of Communication Engineering from August 1999 to July 2001. He currently is the Dean of the Research and Development Office, NCTU. He has been an Advisor for the Ministry of Education to promote the education of communication science and technologies for colleges and universities in Taiwan since 1995. He also is a Committee Member of the Telecommunication Deliberate Body. His research interests include performance evaluation, wireless communication networks, and broad-band networks.