—
physics pp. 99–111
Quantitative theory of thermal fluctuations
and disorder in the vortex matter
DINGPING LI1,2,∗, BARUCH ROSENSTEIN2 and P LIN2
1Department of Physics, Peking University, Beijing 100871, People’s Republic of China 2National Center for Theoretical Sciences and Electrophysics Department, National Chiao
Tung University, Hsinchu 30050, Taiwan, Republic of China
∗E-mail: lipd [email protected]
Abstract. A metastable supercooled homogeneous vortex liquid state exists down to zero fluctuation temperature in systems of mutually repelling objects. The zero-temperature liquid state therefore serves as a (pseudo) ‘fixed point’ controlling the prop-erties of vortex liquid below and even around the melting point. Based on this picture, a quantitative theory of vortex melting and glass transition in Type II superconductors in the framework of Ginzburg–Landau approach is presented. The melting line location is determined and magnetization and specific heat jumps are calculated. The point-like dis-order shifts the line downwards and joins the dis-order–disdis-order transition line. On the other hand, the disorder induces irreversible effects via replica symmetry breaking. The irre-versibility line can be calculated within the Gaussian variational method. Therefore, the generic phase diagram contains four phases divided by the irreversibility line and melting line: liquid, solid, vortex glass and Bragg glass. We compare various experimental results with the theoretical formula.
Keywords. Vortex phase diagram; melting transition; glass transition. PACS Nos 74.60.-w; 74.40.+k; 74.25.Ha; 74.25.Dw
1. Introduction and the theoretical background
Inhomogeneities both on the microscopic and mesoscopic scale greatly affect ther-modynamic and especially dynamic properties of Type II superconductors in mag-netic fields. The magmag-netic field penetrates the sample in the form of Abrikosov vortices which can be pinned by disorder. Thermal fluctuations also greatly influ-ence the vortex matter in high Tc superconductors. For example, in some cases,
thermal fluctuations will effectively reduce the effects of disorder and melt the vor-tex lattice. As a result the H–T phase diagram of the high Tc superconductors is
very complex due to the competition between thermal fluctuations and disorder, and is still far from being reliably determined, even in the best studied supercon-ductor, the optimally-doped YBCO superconductor [1]. Experimentally, various phases with various (frequently overlapping) names like liquid [2] (sometimes dif-ferentiated into liquid I and liquid II [3]), vortex solid, Bragg glass [4] (=pinned
solid), vortex glass (=pinned liquid=entangled solid [5], the vortex slush [6]), were described. To differentiate various phases, one should understand the nature of the phase transitions between them. Although over the years the picture has evolved with various critical and tricritical points appearing and disappearing, several facts become increasingly clear.
1. The first order [7–9] melting line seems to merge with the ‘second magneti-zation peak’ line forming the universal order–disorder phase transition line [10,11]. At low temperatures, the location of this line strongly depends on disorder and generally exhibits a positive slope (termed also as the ‘inverse’ melting [12]), while in the ‘melting’ section, it is dominated by thermal fluctuations and has a large neg-ative slope. The resulting maximum at which the magnetization and the entropy jump vanish was interpreted either as a tricritical point [3,13] or as a Kauzmann point [14]. This universal ‘order–disorder’ transition line (ODT), which appeared first in the strongly layered superconductors (BSCCO [10]) was extended to the moderately anisotropic superconductors (LaSCCO [11]) and to the more isotropic ones like YBCO [14,15]. The symmetry characterization of the transition is clear: spontaneous breaking of the translation and rotation symmetry.
2. The universal ‘order–disorder’ line is different from the ‘irreversibility line’ or the ‘glass’ transition (GT) line, which is a continuous transition [16,17]. The almost vertical glass line clearly represents the effects of disorder although the thermal fluc-tuations affect the location of the transition. Experiments in BSCCO [18] indicate that the line crosses the ODT line right at its maximum, and continues deep into the ordered (Bragg) phase. This proximity of the glass line to the Kauzmann point is reasonable since both signal the region of close competition of the disorder and the thermal fluctuations effects. In more isotropic materials the data are more confusing. In LaSCCO [19] the GT line is closer to the ‘melting’ section of the ODT line still crossing it. Most of the experiments [13] indicate that the GT line terminates at the ‘tricritical point’ in the vicinity of the maximum of the ODT line. It is more difficult to characterize the nature of the GT transition as a ‘symmetry breaking’. The common wisdom is that ‘replica’ symmetry is broken in the glass (either via ‘steps’ or via ‘hierarchical’ continuous process) as in most of the theories of spin glasses [20].
Theoretically, the problem of the vortex matter subject to thermal fluctuations or disorder has a long history. An obvious candidate to model the disorder is the Ginzburg–Landau model in which coefficients have random components. The Ginzburg–Landau (GL) approach is generally appropriate to describe thermal fluc-tuations near Tc. However, this model is too complicated and simplifications are
required. The original idea of the vortex glass and the continuous glass transition exhibiting the glass scaling of conductivity diverging in the glass phase appeared early in the framework of the frustrated XY model (the gauge glass) [21,22]. In this approach one fixes the amplitude of the order parameter retaining the magnetic field with random component added to the vector potential. It was studied by the RG and the variational methods and has been extensively simulated numerically [6,23]. In analogy to the theory of spin glass, the replica symmetry is broken when crossing the GT line. The model ran into several problems (see [24] for a review): for finite penetration depth λ, it has no transition [25] and it was difficult to explain sharp Bragg peaks observed in the experiments at low magnetic fields. To address
the last problem, another simplified model had been proven to be more convenient: the elastic medium approach to a collection of interacting line-like objects subject to both the pinning potential and the thermal bath Langevin force [26,27]. The resulting theory was treated again using the Gaussian approximation [4,28] and RG [22]. The result was that when 2 < D < 4, there was a transition to a glassy phase in which the replica symmetry was broken following the ‘hierarchical pattern’ (in D = 2 the breaking is ‘one step’). The problem of the very fast destruction of the vortex lattice by disorder was solved with the vortex matter being in the replica symmetry broken (RSB) phase and it was termed ‘Bragg glass’ [4]. It is possible to address the problem of mesoscopic fluctuation using an approach in which one directly simulates the interacting line-like objects subject to both the pinning potential and the thermal bath Langevin force [26,27]. In this context the generalized replicated density functional theory [29] was also applied resulting in one-step RSB solution. Although the above approximations to the disordered GL theory are very useful in more ‘fluctuating’ superconductors like BSCCO, a prob-lem arises with their application to YBCO at temperature close to Tc(where most
of the experiments mentioned above are done): vortices are far from being line-like and even their cores significantly overlap. As a consequence the behavior of the dense vortex matter is expected to be different from that of a system of point-like vortices and of the XY model although the elastic medium approximation might still be meaningful [30,31].
To describe the non-point-like vortices, one has to return to the GL model and make a different simplification. One of the most developed schemes is the lowest Landau level (LLL) approximation valid close to the Hc2(T ) line [32]. Such an
attempt was made by Dorsey et al [33] in the liquid phase using the dynamic approach [34] and by Tesanovic and Herbut [35] for columnar defects in layered materials using supersymmetry.
The GL model is however highly nontrivial even within the lowest Landau level (LLL) approximation valid at relatively high fields. This simplified model has only one parameter: the dimensionless LLL scaled temperature aT → (T −
Tmf(H))/(T H)2/3. Over the last twenty years, so many theoretical methods were
applied to study this model. However, all those approaches do not provide a quan-titative theory since these are one-phase theories and in order, say, to calculate discontinuities at first-order transition an accurate description of both phases is necessary.
Two perturbative approaches were developed and greatly improved recently to describe both the solid and the liquid phases in the LLL GL model. On the solid side, long time ago, Eilenberger et al [36] calculated the fluctuations spectrum around Abrikosov’s mean field solution. They noticed that the vortex lattice phonon modes are softer than those of the acoustic phonons in atomic crystals and this leads to infrared (IR) divergences in certain quantities. This was initially interpreted as ‘destruction of the vortex solid by thermal fluctuations’ and the perturbation theory was abandoned. However the divergences look suspiciously similar to ‘spurious’ IR divergences in the critical phenomena theory and recently it was shown that all these IR divergences cancelled in physical quantities [37]. The series therefore are reliable, and are extended to two loops, so that the LLL GL theory on the solid side is now precise enough even around the melting point.
The perturbative approach on the liquid side was pioneered long ago by Ruggeri and Thouless [38]. They developed a perturbative expansion around a homogeneous (liquid) state in which all the ‘bubble’ diagrams are resumed. Unfortunately they found that the series are asymptotic. We recently obtained the optimized Gaussian series [39] which are convergent rather than asymptotic with radius of convergence of aT = −5, which is still unfortunately above the melting point.
Therefore, the missing part is a theory in the region −10 < aT < −5 on the liquid
side. Moreover, this theory should be very precise since free energies of solid and liquid happen to differ only by a few per cent around melting. The problem closely related to melting is the nature of the metastable phases of the theory. While it is clear that the overheated solid becomes unstable at some finite temperature, it is not generally clear whether the overcooled liquid becomes unstable at some finite temperature (like water and other molecular liquids, which however has a crucial attractive component of the intermolecular force) or exists all the way down to
T = 0 as a metastable state. The Gaussian (Hartree–Fock) variational calculation,
although perhaps of a limited precision, is usually a very good guide as far as qualitative features of the phase diagram are concerned. Such a calculation in the liquid was performed long ago [38], while a significantly more complicated one sampling also inhomogeneous states (vortex lattice) was obtained recently [39,40]. The Gaussian results are as follows: The free energy of the solid state is lower than that of the liquid for all temperatures lower than melting temperature am
T. The solid
state is therefore the stable one below am
T, becomes metastable at somewhat higher
temperatures and is destabilized at aT = −5.5. The experimental observation of
overcooled liquid, superheated solid and the spinodal line was recently carried out by Rutgers group [41]. The liquid state becomes metastable below the melting temperature, but unlike the solid, does not loose measurability all the way down to
am
T = −∞ (T = 0). This general picture is supported by an exactly solvable large
N Ginzburg–Landau model of vortex matter in Type II superconductors.
Assuming the absence of singularities on the liquid branch allows one to develop an essentially precise theory of the LLL GL model in vortex liquid (even including supercooled liquid, see also ref. [42]) using methods of theory of critical phenomena [43,44]. The generally effective mathematical tool to approach a nontrivial fixed point (in our case at zero temperature) is the Borel–Pade (BP) transformation [44]. As we showed in [39] (see also [45]), the BP liquid free energy combined with the correct two-loop solid energy computed recently gives scaled melting temperature
am
T = −9.5 in the 3D LLL GL model, and in addition predicts other characteristics
of the model. The LLL GL model was also studied numerically in both Lawrence– Doniach model (a good approximation of the 3D GL for large number of layers) [46,47] and in 2D [48] and by a variety of nonperturbative analytical methods such as the density functional [49], 1/N [50–52], dislocation theory of melting [53] and others [54]. However, all these methods do not provide us a good quantitative description of the experiments.
Now we come to discuss the disorder effect and we will consider only point dis-order. The point disorder will influence the location of the melting line. Using perturbation around the solid and overcooled liquid, we found that the melting line would be bent and join the order–disorder line [14]. Thus a portion of the over-cooled liquid region will be exposed and become thermodynamically stable. The
liquid which is originally overcooled in the zero disorder is called liquid II and the usual liquid is called liquid I. Liquid II is very viscous and locally looks like a solid. There will be no thermodynamical phase transition between the two liquids, though the two liquids are dynamically very different.
Moreover, the disorder will induce replica symmetry breaking [55] which is the so-called glass transition (citing also Lopatin). In [56] we obtained the glass tran-sition line within the Gaussian variational approach [57] to the liquid II (see also ref. [58], which considered a different model within the LLL GL model, and ref. [29] using the replica method within the density functional method [59]). Within the liquid II phase, part of the phase becomes glass-like because of replica sym-metry breaking. We have not calculated the glass line in the crystalline state, but anticipate that it depends little on the crystalline order. This is consistent with observations made in ref. [35] in which it was noticed (in a bit different context of layered materials and columnar defects) that lateral modulation introduced a very small difference to the glass line although it was obviously very important for the location of the order–disorder line. So we just continue the glass line in the homogeneous phase into the crystalline side. If the glass lines of the liquid side and solid side join to a single glass line, then the glass line must cross the order–disorder transition (ODT) line right at the Kauzmann point. That the glass line crosses the ODT line right at the Kauzmann point has been indeed supported by some evidences in an experiment in BSCCO [18], though two lines crossing ex-actly at the Kauzmann point or not is still an open question experimentally and theoretically. In conclusion, the generic thermodynamical phase diagram contains four regions: region one: replica symmetry breaking and translational symmetry breaking, Bragg phase; region two: replica symmetry and translational symmetry breaking, solid phase; region 3: replica symmetry breaking and translational sym-metry, vortex glass; region 4: replica symmetry and translational symsym-metry, liquid phase. There is no thermodynamical phase transition between liquid I and liquid II, though dynamically the two liquids are very different.
2. Theoretical formula and their comparison to experiments
We will not give here any explicit theoretical formula as this can be found in our previous works [42,56] and will only present the theoretical results and their com-parison to several experiments. The expressions can be obtained in the form of
Mathematica file from authors. The choice of the experimental data is rather
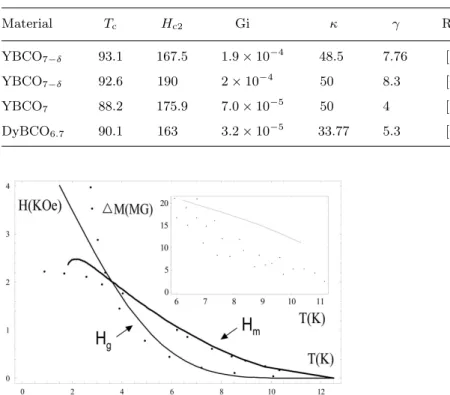
ar-bitrary and we apologize for not mentioning other materials and experiments. By fitting the melting line, we can obtain various parameters which are in excellent agreement with the parameters directly measured experimentally. In table 1, we list the parameters obtained by fitting the melting line.
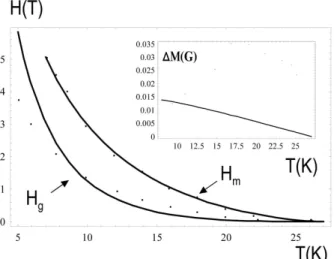
In figure 1, the experimental results [62] in the organic superconductor κ – (BEDT–TTF)2Cu[N(CN)2]Br are compared with the theoretical ones using Tc =
12.5 K, Hc2= 5.5 T, κ = 20, n = 0.02 where n is the disorder strength [56].
Though the melting line is far away from Hc2 in Bi2Sr2CaCu2O8+y, we could
still use the so-called effective LLL theory which can still describe qualitatively the phase diagram. Due to huge thermal fluctuation, the vortex core effectively becomes
Table 1. Parameters of high Tc superconductors deduced from the melting line. Material Tc Hc2 Gi κ γ Ref. YBCO7−δ 93.1 167.5 1.9 × 10⁻⁴ 48.5 7.76 [8] YBCO7−δ 92.6 190 2 × 10⁻⁴ 50 8.3 [60] YBCO7 88.2 175.9 7.0 × 10⁻⁵ 50 4 [13] DyBCO6.7 90.1 163 3.2 × 10⁻⁵ 33.77 5.3 [61]
Figure 1. Theoretical glass line, melting line and magnetization jumps com-pared with the κ – (BEDT–TTF)2Cu[N(CN)2]Br experimental results.
Figure 2. Theoretical glass line, melting line and magnetization jumps com-pared with the highly overdoped Bi2Sr2CaCu2O8+yexperimental result.
Figure 3. Theoretical glass line, melting line and magnetization jumps com-pared with (La1−xSrx)2CuO4experimental result.
quite big so that effectively Hc2 becomes small. As an example, see figure 2, where
the experimental results [63] in highly overdoped Bi2Sr2CaCu2O8+y are compared
with the theoretical ones of 2D GL LLL model using Tc = 80 K, Hc2 = 10 T,
κ = 40, n = 0.15: In figure 3, the experimental results [64] in (La1−xSrx)2CuO4
are compared with the theoretical ones of 3D GL LLL model using Tc = 27 K,
Hc2= 50 T, κ = 115, n = 0.01: We had used magnetization jump formula without
disorder in figure 1 and figure 2 as we cannot fit the jumps quantitatively (because the melting line in both figure 1 and figure 2 is far away from Hc2, so that the LLL
description of magnetization jumps will not be applicable quantitatively). If we use magnetization jump formula including disorder, usually there will be a maximum jump, as observed experimentally.
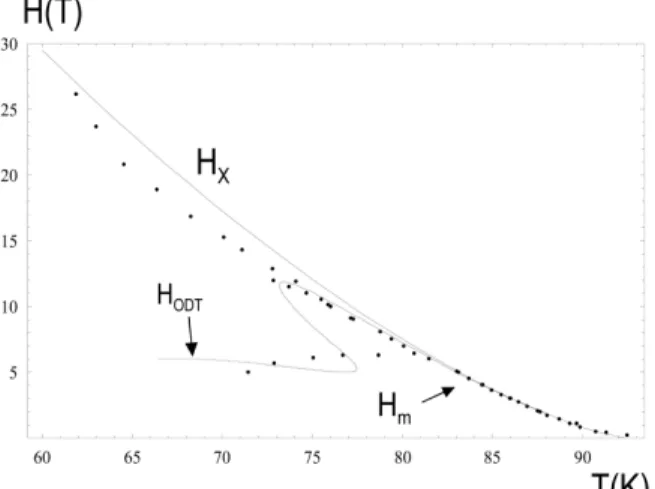
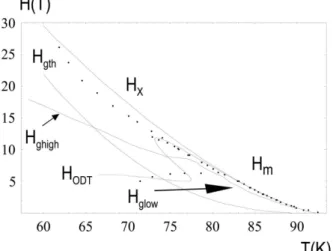
In figure 4, the experimental results [3] in optimal doped YBa2Cu3O7−δ are
compared with the theoretical ones of 3D GL LLL model using Tc = 92.6 K,
Hc2 = 190 T, κ = 50, γ = 8.3, n = 0.12: The melting line is joined by the order–
disorder transition line as shown in figure 4. Line Hxis the transition line between
liquid I and liquid II. This line is not a thermodynamical transition line, though it may be a dynamical transition line as liquid II locally looks like a solid rather than the usual liquid.
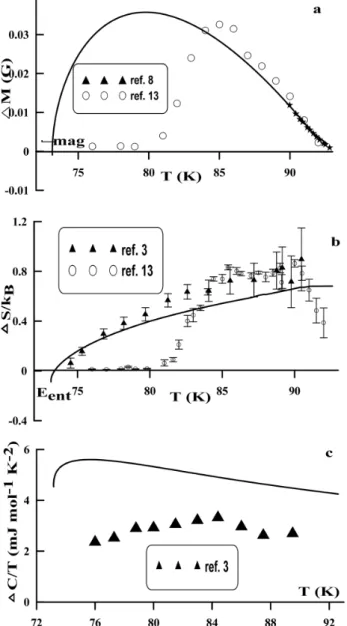
In figure 5, the experimental results on magnetization jumps, rather entropy jumps, and specific heat jumps [3,8,13] in optimal-doped YBa2Cu3O7−δ are
com-pared with the theoretical ones: In figure 5, from 85 K to 93 K, magnetization jumps and entropy jumps are in very good quantitative agreement with the theoretical re-sults. The experimental results below 85 K are different for different experiments. The good quantitative agreement near Tc is not surprising as in YBCO the melting
line is quite near Hc2 so that the LLL theoretical result should have quite a good
accuracy. The specific heat jumps have a very big error bar experimentally (usually underestimated) so that the discrepancy between the theoretical and experimental results could be originally attributed to the experimental error bar.
Figure 4. Theoretical melting line and Hx compared with YBa2Cu3O7−δ
experimental result.
Finally in figure 6, we present YBCO phase diagram with glass transition line and melting line (or the order–disorder transition line) together. The experimental glass line contains two parts: the high part of the line is the experimental results of ref. [13] and the low part of the line is the result of ref. [17]. The low part of the line (inside the solid phase) is usually very difficult to determine as the surface barriers will influence the location of the line.
3. Conclusion
A metastable overcooled liquid state exists down to zero temperature for any inter-acting system of repelling objects. At zero temperature, there is a pseudocritical fixed point controlling the low temperature asymptotics of the overcooled liquid. We have provided an evidence that in the LLL GL model, metastable homogeneous state (the supercooled liquid state) exists down to zero fluctuation temperature and the superheated vortex solid survives up to the spinodal line, by solving the large
N LLL Ginzburg–Landau model. The recent experiments in 2H–NbSe2 [41] have
demonstrated that there indeed exists the supercooled vortex liquid at very low temperature and the superheated vortex solid up to the temperature limit, very close to the theoretical drawn spinodal line.
There exist (unfortunately very few) numerical simulations of the overcooled one-component plasma and electron gas. The existing data favour the existence of the zero temperature pseudocritical point. If the conjecture were correct, properties of the overcooled liquid state (like structure function in the limit of low temperatures) should be rather universal. Thus the physics of the supercooled liquid state can be theoretically approached using methods of physics of critical phenomena (the Borel–Pade resummation technique).
The idea of pseudocritical point at zero temperature was applied in [14,39], where the BP liquid free energy combined with the correct two-loop solid energy gives us
melting temperature and, in addition, quantitatively predicts other characteristics of the model, for example, melting line, magnetization curves and their jumps, latent heats, spinodal line etc. All of those theoretical predictions are in very good quantitative agreements with experiments.
The glass transition induced by disorder can be obtained by using the replica method and Guassian variational method.
Figure 5. The magnetization jumps, entropy jumps, and specific heat jumps in YBa2Cu3O7−δ.
Figure 6. The glass transition line and melting line in YBa2Cu3O7−δ.
In this paper, we fit various experimental results based on very few fundamental parameters of the superconductors Tc, Hc2, κ, γ and the disorder strength n. In
some cases, there are very good quantitative agreements if the phase transition lines are near Hc2 so that the LLL approximation is accurate.
Acknowledgements
We are grateful to E Andrei and E Zeldov for valuable discussions. The work was supported by NSC of Taiwan grant NSC#93-2112-M-009-503, the Ministry of Science and Technology of China (G1999064602) and National Nature Science Foundation (10274030) and (90403002). Authors are indebted to E Zeldov for the hospitality provided at the Weizmann Institute of Science.
References
[1] For a review on the vortex phase diagram, see P Gammel, D A Huse and D J Bishop, in Spin glasses and random fields edited by A P Young (World Scientific, 1998) and references therein
[2] D R Nelson, Phys. Rev. Lett. 60, 1973 (1988)
[3] F Bouquet, C Marcenat, E Steep, R Calemczuk, W K Kwok, U Welp, G W Crabtree, R A Fisher, N E Phillips and A Schilling, Nature 411, 448 (2001)
[4] T Giamarchi and P Le Doussal, Phys. Rev. Lett. 75, 3372 (1994); Phys. Rev. B52, 1242 (1995)
[5] D Ertas and D R Nelson, Physica C272, 79 (1996) [6] Y Nonomura and X Hu, Phys. Rev. Lett. 28, 5140 (2001)
[7] E Zeldov, D Majer, M Konczykowski, V B Geshkenbein, V M Vinokur and H Shtrik-man, Nature (London) 375, 373 (1995)
[8] A Schilling, R A Fisher, N E Phillips, U Welp, D Dasgupta, W K Kwok and G W Crabtree, Nature (London) 382, 791 (1996)
M Roulin, A Junod and E Walker, Science 273, 1210 (1996)
[9] H Pastoriza, M F Goffman, A Arribˆere and F de la Cruz, Phys. Rev. Lett. 72, 2951 (1994)
X Liang, D A Bonn and W N Hardy, Phys. Rev. Lett. 76, 835 (1996)
[10] B Khaykovich, E Zeldov, D Majer, T W Li, P H Kes and M Konczykowski, Phys. Rev. Lett. 76, 2555 (1996)
[11] Y Radzyner, A Shaulov and Y Yeshurun, Phys. Rev. B65, 100513 (R) (2002) Y Radzyner, A Shaulov, Y Yeshurun, I Felner, K Kishio and J Shimoyama, Phys. Rev. B65, 100503 (R) (2002)
[12] N Avraham, B Khaykovich, Y Myasoedov, M Rappaport, H Shtrikman, D E Feldman, T Tamegai, P H Kes, M Li, M Konczykowski, K van der Beek and E Zeldov, Nature (London) 411, 451 (2001)
[13] N Kobayashi, T Nishizaki, K Shibata, T Sato, M Maki and T Sasaki, Physica C362, 121 (2001)
K Shibata, T Nishizaki, T Sasaki and N Kobayashi, Phys. Rev. B66, 214518 (2002) [14] D Li and B Rosenstein, Phys. Rev. Lett. 90, 167004 (2003)
[15] D Pal, S Ramakrishnan, A K Grover, D Dasgupta and Bimal K Sarma, Phys. Rev. B63, 132505 (2001)
D Pal, S Ramakrishnan and A K Grover, Phys. Rev. B65, 096502 (2002)
[16] K Deligiannis, M Charalambous, J Chaussy, R Liang, D Bonn and W N Hardy, Physica C341, 1329 (2000)
[17] B J Taylor, Shi Li, M B Maple and M P Maley, Phys. Rev. B68, 054523 (2003) [18] D T Fuchs, E Zeldov, T Tamegai, S Ooi, M Rappaport and H Shtrikman, Phys. Rev.
Lett. 80, 4971 (1998)
E Zeldov, private communication
[19] U Divakar, A J Drew, S L Lee, R Gilardi, J Mesot, F Y Ogrin, D Charalambous, E M Forgan, G I Menon, N Momono, M Oda, C D Dewhurst and C Baines, Phys. Rev. Lett. 92, 237004 (2004)
[20] V Dotseko, An introduction to the theory of spin glasses and neural networks (Cam-bridge University Press, 2001)
[21] M P A Fisher, Phys. Rev. Lett. 62, 1415 (1989)
D S Fisher, M P A Fisher and D A Huse, Phys. Rev. B43, 130 (1991) [22] T Natterman, Phys. Rev. Lett. 64, 2454 (1990)
T Natterman and S Scheindl, Adv. Phys. 49, 607 (2000) [23] P Olsson and S Teitel, Phys. Rev. Lett. 87, 1370001 (2001)
[24] T Giamarchi and S Bhattacharya, in High magnetic fields: Applications in condensed matter physics and spectroscopy edited by C Berthier et al (Springer-Verlag, 2002) p. 314
[25] H K Bokil and A P Young, Phys. Rev. Lett. 74, 3021 (1995)
[26] A van Otterlo, R T Scalettar and G T Zimanyi, Phys. Rev. Lett. 81, 1497 (1998) [27] C Reichhardt, A van Otterlo and G T Zimanyi, Phys. Rev. Lett. 84, 1994 (2000) [28] S E Korshunov, Phys. Rev. B48, 3969 (1993)
[29] G I Menon, Phys. Rev. B65, 104527 (2002) [30] E H Brandt, Rep. Prog. Phys. 58, 1465 (1995)
[31] G P Mikitik and E H Brandt, Phys. Rev. B64, 184514 (2001); Phys. Rev. B68, 054509 (2003)
J Kierfeld and V Vinokur, Phys. Rev. B61, R 14928 (2000) [32] D J Thouless, Phys. Rev. Lett. 34, 946 (1975)
E Brezin, D R Nelson and A Thiaville, Phys. Rev. B31, 7124 (1985) [33] A T Dorsey, M Huang and M P A Fisher, Phys. Rev. B45, 523 (1992) [34] H Sompolinsky and A Zippelius, Phys. Rev. B25, 6860 (1982)
[35] Z Tesanovic and I F Herbut, Phys. Rev. B50, 10389 (1994) [36] G Eilenberger, Phys. Rev. 164, 628 (1967)
K Maki and H Takayama, Prog. Theor. Phys. 46, 1651 (1971) [37] B Rosenstein, Phys. Rev. B60, 4268 (1999)
H C Kao, B Rosenstein and J C Lee, Phys. Rev. B61, 12352 (2000) [38] G J Ruggeri and D J Thouless, J. Phys. F6, 2063 (1976)
[39] D Li, B Rosenstein, Phys. Rev. Lett. 86, 3618 (2001); Phys. Rev. B65, R220504, (2002)
[40] D Li and B Rosenstein, Phys. Rev. B65, 024514 (2002)
[41] Z L Xiao, O Dogru, E Y Andrei, P Shuk and M Greenblatt, Phys. Rev. Lett. 92, 227004 (2004)
Y Paltiel, E Zeldov, Y N Myasoedov, H Shtrikman, S Bhattacharya, M J Higgins, Z L Xiao, E Y Andrei, P L Gammel and D J Bishop, Nature (London) 403, 398 (2000)
Y Paltiel, E Zeldov, Y Myasoedov, M L Rappaport, G Jung, S Bhattacharya, M J Higgins, Z L Xiao, E Y Andrei, P L Gammel and D J Bishop, Phys. Rev. Lett. 85, 3712 (2000)
X S Ling, S R Park, B A McClain, S M Choi, D C Dender and J W Lynn, Phys. Rev. Lett. 86, 712 (2001)
Z L Xiao, E Y Andrei and M J Higgins, Phys. Rev. Lett. 83, 1664 (1999) [42] Dingping Li and B Rosenstein, Phys. Rev. B70, 144521 (2004)
[43] D J Amit, Field theory, the renormalization group, and critical phenomena (World Scientific, Singapore, 1984)
[44] G A Baker, Quantitative theory of critical phenomena (Academic Press, Boston, 1990) [45] S Hikami, A Fujita and A I Larkin, Phys. Rev. B44, R10400 (1991)
E Brezin, A Fujita and S Hikami, Phys. Rev. Lett. 65, 1949 (1990); 65, 2921(E) (1990)
[46] R Sasik and D Stroud, Phys. Rev. Lett. 75, 2582 (1975) [47] J Hu and A H MacDonald, Phys. Rev. B56, 2788 (1997) [48] Y Kato and N Nagaosa, Phys. Rev. B48, 7383 (1993)
J Hu and A H MacDonald, Phys. Rev. Lett. 71, 432 (1993) A E Koshelev, Phys. Rev. B56, 11201 (1997)
[49] I F Herbut and Z Tesanovic, Phys. Rev. Lett. 73, 484 (1994) [50] I Affleck and E Brezin, Nucl. Phys. B257, 451 (1985)
[51] M A Moore, T J Newman, A J Bray and S-K Chin, Phys. Rev. B58, 9677 (1998) [52] A Lopatin and G Kotliar, Phys. Rev. B59, 3879 (1999)
[53] T Maniv, V Zhuravlev, I Vagner and P Wyder, Rev. Mod. Phys. 73, 867 (2001) V Zhuravlev and T Maniv, Phys. Rev. B69, 024522 (2004)
[54] Z Tesanovic, L Xing, L Bulaevskii, Q Li and M Suenaga, Phys. Rev. Lett. 69, 3563 (1992)
Z Tesanovic and A V Andreev, Phys. Rev. B49, 4064 (1994) [55] G Parisi, J. Phy. A13, 1101 (1980)
[56] Dingping Li and B Rosenstein, cond-mat/0411096
[57] M Mezard and G Parisi, J. Phys. (France) I 1, 809 (1991) [58] A V Lopatin, Europhys. Lett. 51, 635 (2000)
[59] G I Menon and C Dasgupta, Phys. Rev. Lett. 73, 1023 (1994)
[60] A Schilling, U Welp, W K Kwok and G W Crabtree, Phys. Rev. B65, 054505 (2002) [61] M Roulin, A Junod and E Walker, Science 273, 1210 (1996)
M Roulin, A Junod, A Erb and E Walker, J. Low Temp. Phys. 105, 1099 (1996) B Revaz, A Junod and A Erb, Phys. Rev. B58, 11153 (1998)
[62] T Shibauchi, M Sato, S Ooi and T Tamegai, Phys. Rev. B57, 5622 (1998) [63] S Ooi, T Shibauchi and T Tamegai, Physica C302, 339 (1998)
[64] T Sasagawa, Y Togawa, J Shimoyama, A Kapitulnik, K Kitazawa and K Kishio, Phys. Rev. B61, 1610 (2000)