Xiao-Shu Zhu et al.
Journal of Research in Education Sciences 2011,56(1),91-127
DIF Detection Using HGLMs. 91 •
Differential Item Functioning Analyses in
Large-Scale Educational Surveys: Key
Concepts and Modeling Approaches for
Secondary Analysts
Xiao-Shu Zhu
Department ofMeasurement,
Statistics& Evaluation,
University of Maryland Graduate Student
Andre A. Rupp
DepartmentofMeasureme 肘, Statistics&Evaluation, University ofMaryland Associate Professor
Abstract
ling Gao
Otlice of Assessment&Evaluation,
University College University ofMaryland
Psychometrician
Many educational surveys employ a multi-stage sampling design for students,which makes use of stratification and/or clustering of population units,as well as a complex booklet design for items from an item pool. In these su何C抖, the reliable detection of item bias or differential item functioning (DIF) across student groups is a key component for ensuring fair representations of different student groups. In this paper, we describe several modeling approaches that can be useful for detecting DIF in educational surveys. We illustrate the key ideas by investigating the performance of six hierarchical generalized linear models (HGLMs) using a small simulation study and by applying them to real data from the Trends in Mathematics and Science Study (TIMSS) study where we use them to investigate potential uniform gender DIF.
Keywords: complex booklet design,D眩, HGLMs,multi-stage sampling design
• 92 • DIF Detection Using HGLMs Xiao-Shu Zhu et a1.
National and international educational surveys are important empirical tools for monitoring student achievement in particular content domains such as mathematics, science, and reading. For instance,the Program for International Student Assessment (PISA) (http://nces.ed.-gov/assessments/ pisa/) and the Trends in International Mathematics and Science Study (TIMSS) (http://nces. ed.gov/timss/) are well-established international surveys while the National Assessment of Educational Progress (NAEP) (http://nces.ed.gov/nationsreportcard/) is a well-established national survey in the United States whose technical developments have driven many of the current standards in like surveys around the world (e.g.,Mislevy, 1991; Mislevy,Beaton,Kaplan,& Sheehan, 1992; Mislevy, Johnson, & Muraki, 1992). There also exist numerous independent educational surveys conducted by provinces or states that are implemented at regular intervals.
These educational surveys are designed to suppo此 system-wideaccountability systems,which requires that any inferences about mean performance differences across groups of students can be made reliably and validly (Rutkowski,Gonzalez,Joncas,& von Davier,2010; von Davier,Sinharay,
Oranje, & Beaton, 2006). Statistically, the examination of differential item functioning (DlF) is regarded as an important component in this overall process (Mapuranga,Dorans,& Middleton,2008) and is reflected in various quality assurance statements in the Standards for Educational and Psychological Testing (American Educational Research Association, American Psychological Associating,& National Council on Measurement in Education, 1999).
Our goal for this paper is to introduce key concepts for DIF detection as well as six model specifications under a unified estimation framework for DIF detection within educational surveys,
which is the framework of hierarchical generalized linear models (HGLMs) (e.g.,Kamata,2001; Prowker & Camilli,2007; Raudenbush &B可k, 2002). We investigate the practical utility of the six models using a small scale simulation study and demonstrate their use with real data from TIMSS 2007.
We have organized the paper as follows. In the first section,we provide an overview of key concepts for DIF detection, whether in educational surveys or other application contexts. In the second section we discuss impo此ant features of data collection procedures in educational surveys and the way in which they impact parameter and standard error / variance estimation in parametric statistical models. We then provide a rationale for a designed-based estimation process ofDIF effects as implemented in the HGLM framework. In the third section,we conduct a small simulation study to investigate the DlF detection ability of six different HGLMs. In the fourth section we apply these models to a subset ofthe 2007 TIMSS data. We close the paper with asumma可 andbrief discussion ofkey findings.
Xiao-Shu Zhu et al.
Basic Concepts in DIF Detection
DIF Detection Using HGLMs. 93 •
The literature on the theory and practice of DIF is vast and we recommend the following sources for further reading. For a general overview of DIF methods,we recommend,for example,
Ferne and Rupp (2007),Mapuranga, Dorans, and Middleton (2008),Oster1ind (2009), and Zumbo
(1999). For an overview of key implications of the complex sampling designs for educational surveys for secondary analyses generally,we recommend the articles by Rutkowski et al. (20 I0),
von Davier,Gonzalez,and Mislevy (20 I0),and von Davier et al. (2006). For examples of how DIF analyses can be conducted within unified estimation frameworks for parametric statistical models,
which are most appropriate for educational survey data, we recommend Binici (2008), Kamata (2001),Kamata and Binici (2003),Kim (2003),and Prowker and Camilli (2007).
DIF ys. Impact
DIF occurs when different item response probabilities are observed for students with identical levels of proficiency (i.e.,equal values on the observed or latent variables in the statistical model) who belong to at least two distinct groups. Importantly,DIF is not the same as true mean differences proficiency,which are known as impact in the literature (Camilli & Shepard, 1994; Hauger& Sireci,
2008). Put differently, DIF reflects conditional performance d,珈rences whereas impact reflects
unconditional/marginal performance differences. DIF can be viewed as caused by distributional
differences on a variable that reflects a secondary construct that an instrument is not intended to measure but that the items that display DIF appear to require during responding. Hence, biased inferences for items displaying DIF will only result if the students in different groups actually differ in their proficiency distribution on the secondary variables (Shealy & Stout,1993).
Uniform ys. Non-uniform DIF
Researchers distinguish between two general types of DIF,which are known as uniform DIF and non-uniform DIF. Uniform DIF refers to the condition when one of the groups - typically the one denoted as the n可erence group 一 is predicted to perform either better or worse than the other group(s) - typically denoted as the focal group(s) - throughout the entire proficiency range. In contrast, non-uniform DIF exists when there is a point on the proficiency continuum where the predicted difference in performance across the groups reverts. This is important to remember because certain statistical approaches to DIF detection do not allow for the detection ofnon-uniform DIP. Importantly,this is equally true of some methods that employ observed-score matching (e.g.,
the Mantel-Haenszel method from the area of multivariate statistics / categorical data analysis) and
• 94 • DIF Detection Using HGLMs Xiao-Shu Zhu et al.
some methods that employ latent-variable matching (e.g.,models in the Rasch family from the area ofItem Response Theory(IRT)); for an overview oflRT see,for example,de Ayala (2009),Yen and Fitzpatrick (2006),and Embretson and Reise (2000).
Grouping Structures in DIF Analyses
The reference and focal groups that are used in DIF analyses could be observed (e.g., gender groups, ethnicity groups) or unobserved, in which case the groups are often believed to represent students who utilize differential strategies for responding. In the first case,statistical models with categorical group indicators can be used while in the second case statistical models with latent classes need to be used, which are also known as 戶nite mixture models (e.g., McLachlan & Peel, 2000).
Although two-group comparisons are commonly utilized in DIF studies for legislative or technical reasons (Zhang, Dorans, & Matthews-Lopez, 2005), this can sometimes be problematic because specific performance differences across different subgroups created by combining individual grouping variables (e.g.,male Caucasians vs. female non-Caucasians) might not be fully teased apart (Mapuranga et aI., 2008). Fortunately, multi-group comparisons with either one or multiple categorical variables can nowadays be carried out with relative ease by borrowing principles from factorial analysis-of-variance models (for a review of the latter see, e.g., Lomax, 2007).
Matching Criteria for DIF Analyses
The criterion that is used to match the student groups to investigate potential conditional performance differences can technically be external or internal to an instrument under investigation,
even though internal criteria are by far more frequently used in practice. External criteria could be observed total scores or estimated latent-variable scores from supplementary assessment batteries that measure constructs that are similar to the target construct of the instrument of interest; in contrast, observed total scores or estimated latent-variable scores frequently serve as internal matching criteria (Camilli, 1993; Camilli & Shepard, 1994; Clauser, Mazor, & Hambleton, 1993; Dorans& Holland,1993; Holland& Thayer,1988).
One potential challenge for using internal criteria is that DIF analyses might suffer from empirical and interpretational circularity (Camilli, 1993; Zenisky, Hambleton, & Rubin, 2003a) because matching scores are computed with information from potential DIF items included. One possible remedy is applying iterative strategies that remove such items and lead to a purification of
Xiao-Shu Zhu et al. DIF Detection Using HGLMs. 95 •
& Wainer, 1993; Zumbo, 1999). In contrast, a confirmatory application of procedures such as SIBTEST ( Shealy& Stout, 1993) requires the a priori specification of a subtest for matching for which it is known that the constituting items do not show DIF.
Statistical Models and Methods for DIF Detection
As already alluded to,it is helpful to differentiate conceptually between parametric statistical
models for DIF detection, which assume a particular distributional form for the item response
variables (e.g., a Bernoulli or multinomial distribution for each variable) and non-parametric
statistical methods,which do not. Since parametric latent-variable models are the state-of-the-art for
analyzing data from educational surveys in light of the complex sampling design for students and the complex booklet design for items,these models are typically also used exclusively for DIF analyses in operational stages for such surveys.
The difference between observed-score matching and latent-variable score matching has immediate implications for the statistical models that can be used. Nowadays, most parametric modeling approaches are viewed as special cases of more general modeling frameworks. Many parametric models,including the ones formulated within the HGLM framework that is the focus of this paper, can be cast as special cases within a Generalized Linear Mixed Model (GLMM) framework (e.g., Goldstein, 2003; Raudenbush & Bryk, 2002) or an even broader Generalized Linear Latent and Mixed Model (GLLAMM) framework (e.g., Binici, 2008; Skondral & Rabe-Hesketh,2004).
Statistical Detection versus Substantive Explanation
It should be noted that DIF analyses are purely empirical exercises in that certain statistical models or methods are applied to data and certain items or groups of items are then flagged. What these basic analyses frequently do not provide is either an explanation of what might have led to the conditional performance differences or a prescription of what should be done with the items that are flagged as displaying DIF.
However,with regards to the former,substantive hypotheses about potential causes of DIF can nowadays be empirically operationalized by including predictor variables for the variation in item parameters in statistical models (e.g., surface-structure item design variables, deep-structure cognitive complexity variables) even though that is not necessarily always done in practice. Substantive hypotheses about potential causes for impact can be simultaneously investigated by including predictor variables for the variation in student parameters (i.e., observed or estimated proficiency scores) in statistical models. The inclusion of covariates at both of these levels is
• 96 • DIF Detection Using HGLMs Xiao-Shu Zhu et al.
nowadays relatively straightforward within the unified estimation frameworks mentioned earlier and is known in the latent-variable modeling literature specifically as explanatory item response
modeling(De Boeck& Wilson,2004).
Summary
To conceptually understand andjudicio叫y apply particular methods for DIF detection, it is important to be clear about: 1. whether DIF for two or multiple groups is of concern,2. whether these groups are observed or unobserved, 3. whether uniform or non-uniform DIF is likely to be present,4. whether external matching criteria are available and of interest for use,5. whether single or multiple matching variables are available, 6. whether the matching criterion is / the matching criteria are observed total score(s) or estimated latent-variable score(s), (7) whether parametric or non-parametric statistical models can or should be used for DIF detection, and (8) whether covariates for explanatory pu中oses at the item or student levels can or should be directly or indirectly included in the analysis.
Since educational surveys contain sampling complexities at both the student and the item level,
certain statistical modeling approaches for DIF detection - non-parametric statistical models in particular - are not appropriate if integrated DIF analyses are desired. In the following section we outline some ofthe key implications ofthese complexities for DIF analyses and focus specifically on DIF detection with parametric models within a unified estimation framework.
DIF Detection in Educational Surveys
Complex Sampling Designs for Students and Sampling Weights
As discussed in Rutkowski et al. (2010), educational surveys usually employ a multistage
cluster sampling design that additionally uses strati日cation at one or multiple stages. For instance,
NAEP utilizes a two-stage sampling design: the first stage involves the selection of schools within strata, and the second stage involves the selection of students within schools (von Davier et aI.,
2006). Generally speaking, multistage cluster sampling designs are employed because they reduce the cost of data collection and make the surveys practically feasible even though they typically increase the sampling error compared to simpler sampling designs.
Specifically, stratification is a process of grouping students into relatively homogenous subgroups before sampling at a particular level. Cluster sampling refers to the selection of sets of units (e.g., districts,schools,or classrooms within schools) rather than individual students. Further information about the particularities of sampling designs for educational surveys can be found in
Xiao-Shu Zhu et al. DIF Detection Using HGLMs. 97 •
Rutkowski et a!. (2010),von Davier et a!. (2006),and the technical reports for educational surveys that can be found on the websites we referenced above.
With multi-stage sampling designs,sampling weightsare used to adjust parameter estimates for differences in the probability of selecting individual sampling units. Each sampling unit is assigned a
base weight,which is the inverse of the overall initial probability of selection. For example, if a
student is selected with probability of 1/100 during sampling, then that student represents 100 students in the target population. The sum of the base weights of all the sampled students is an unbiased estimate of the total number of students in the target population.
Developers of large-scale educational surveys provide various types of sampling weights in publicly available databases. For instance,five main types of sampling weights are available in the TIMSS 2007 database: total student weight, student house weight,student senate weight, school
weight,and teacher weight (Rutkowski et a!.,20 I0). The total student weight is the inverse of the
overall probability of a student being selected. The student house weight is a linear transformation of the total student weight such that the sum of these weights is equal to the observed sample size; it eliminates the inflation of degrees of freedom that would result if the total student weight were used. The senate weight is the student total weight rescaled such that all students' senate weights sum to 500 in each country; it is useful when comparing statistics from countries of different population sizes. When senate weights are properly used,thecount可 witha considerably larger population does not dominate any statistical analyses.
Due to the fact that TIMSS also reports on school,teacher,and classroom characteristics aside from student characteristics, a school weight and a teacher weight are also provided. The school
weightis the inverse of the probability of selection for a specific school while the teacher weight is
the student total weight divided by the total number of teachers a specific student has. Depending on the focus of analysis (e.g., capturi月 the directionali秒, magnitude, and significance of effects for students,teachers,or schools) researchers need to either select or, potentially, compute weights at appropriate sampling levels to accommodate features of nested data.
• 98 • DIF Detection Using HGLMs Xiao-Shu Zhu et a!.
she attends being selected and 芯, thus,not directly appropriate. When appropriate weights are not readily available,researchers should be prepared to manually calculate weights for each level (see Rutkowski et a!.,2010,for illustrations).
Complex Sampling
I
Booklet Designs for Items
Correct Estimation ofMean Proficiency Differences via Plausible
均似的The design of any large-scale educational survey requires a fine balance between accommodating theoretical desiderata for reliably and validly assessing student performance and accommodating practical constraints regarding implementation of data-collection schemes at the same time. Ideally, survey developers would like to make very precise inferences about the proficiency of individual students while (1) ensuring a broad coverage of tested domains for each individual student and (2) simultaneously testing a large cross-section of the student population. However,since resources such as testing time or money for administering and scoring responses are finite,there exists a notable tension among these desiderata (Adams& Gonzalez, 1996).
As a solution, complex item sampling designs, which are also known as matrix sampling
designs or booklet designs,are commonly employed in educational surveys. In these designs,subsets
of items are selected from the total item pool and are typically arranged intoblocks corresponding to
a certain administration time (e.g. ,的 or20 minutes),which are then assigned to thesurvey戶rmsor
test booklets using a particular design structure (see Frey, Hartig, & Rupp, 2009, for a didactic
introduction to such designs). All educational surveys use multiple booklets (e.g., there were 14 booklets in TIMSS 2007 and 13 booklets in PISA 2009) and each booklet typically contains items from multiple content domain(s) of interest (e.g.,reading,mathematics,and science).
Educational surveys are designed to provide reliable inferences at aggregate levels (e.g.,school districts, countries, student groups defined otherwise). That is, resulting estimates of proficiency should not be used to make inferences about individual students because these proficiency estimates are far too imprecise / unreliable (Rutkowski et aI.,2010; von Davier et aI.,2010; von Davier et aI.,
2006). This is a result of the booklet design, because each individual student only responds to few items from each domain,often targeted at a relatively broad range of ability, resulting in very few well-targeted statistical pieces of information that are available for domain-specific subscore estimation for each student. Put differently,data from booklets typically match the
Xiao-Shu Zhu et a!. DIF Detection Using HGLMs. 99 •
students use alternative estimates of proficiency known aspia仰的 Ie values (e怠, Mislevy, 1991; Mislevy & Sheehan, 1987; Rubin, 1987; von Davier et a!., 2010; von Davier et a!., 2006). The statistical machinery for estimating plausible values was first developed for NAEP in 1983 and is the current state-of-the-art for many educational surveys. Unlike the single latent variable values estimated in a traditional IRT model, plausible values are multiple imputations of the single latent variable value that needs to be estimated for a particular reporting dimension for each student. Put even more technically,they are multiple random draws from an appropriate posterior distribution of
latent variable values for each individual student,which is adjusted for the influence of a wide range
of covariates on student performance.
Typically, published data sets for educational surveys contain several - often five - plausible values and proper statist叫I analyses require an integratedana加isthat aggregates and synthesizes the point estimates and standard errors from separate analyses,each one run on a different plausible value. For example,Rutkowski et a!. (2010) discussed how to combine the results of each analysis into a single set of point estimates and standard errors using Rubin's (1987) multiple imputation formulas. This aggregation and synthesis strategy avoids potential problem of underestimating the standard errors of the statistics of interest if only one of plausible values or the mean point estimates across the plausible values were used.
Model-Based Standard Error Estimation
The assumption of independent responding that underlies traditional statistical analyses (i.e.,of a response process for individuals that is not influenced by context effects such as a common educational environment) is violated when data are collected using the complex sampling designs that are common to educational surveys; consequently, analytic procedures must be adjusted to appropriately address the hierarchical structure of the sample.
The ratio of the adjusted variance for a parameter estimate and the unadjusted variance that is produced when treating a complex survey sample as a simple random sample is called the design
effect. When the desψ1 同ffect of a survey is not considered in the statistical analysis, the results
underestimate variances and consequently inflate type-I errors (Cochran, 1977). For example,in DIF analyses for educational surveys, more items than appropriate may be flagged for DIF if the sampling design is not accounted for by the statistical analysis.
Two approaches exist for variance estimation under a complex sample design, which are grounded in design-based and model-based inference (Kalton, 1983). In a design-based approach,
post-hoc adjustments are made to unadjusted variance estimates to account for the complex sampling structure. For the analyses that follow, we adopt a model-based approach, which directly
.
100.
DIF Detection Using HGLMs Xiao-Shu Zhu et al. decomposes the observed variance of response variables into contributions at various design levels (e.g.,classrooms,schools) and,thus,represents the various sampling levels with their stratification variables directly in the statistical model. Consequently, corrected standard errors are produced directly.A commonly used statistical framework for model-based DIF analysis in general is the HGLM framework that we mentioned earlier. Various general-purpose latent-variable programs can nowadays estimate HGLMs using, for example, pseudo-likelihood methods (Binder, 1983; Pfefferman,Skinner,Holmes,Goldstein& Rasbash,1998),amongst them SAS PROC GLIMMIX in SAS, MPlus (Muth缸, L. K. & Muth徊, B.a., 2007) and HLM (Raudenbush, B可k, Cheong, Co月don
&
du Toit,2004). Such programs have options for specifying sampling weights at multiple design levels as well as associated item and student covariates.HGLM Model for DIF Detection
Statistical models within an HGLM framework are relatively simple to speci 身 andestimate in user-friendly general-purpose latent-variable software such as SAS 9.2, Mplus 5.0 or HLM 6.0. Importantly,these programs can accommodate data that are missing randomly and by design,both of which are common for educational surveys,as well as plausible value estimation. In the following sections,we present four candidate models that have been proposed for DIF detection within the HGLM framework - two of them in two variations resulting in a total of six models - and assess their efficacy in detecting DIF using a small simulation study. Our key objective is to provide readers with an intuition about the underlying specification principles that they embody, rather than to provide a seemingly complete answer regarding their utility for DIF detection under a wide range of conditions.
A Primer on the Basic Ideas for DIF Detection: The One-level Logistic
Regression Model
Swaminathan and Rogers (1990) proposed the use of logistic regression analysis for DIF analysis,which allows for the simultaneous detection ofuniform and non-uniform DIF depending on which model is specified. For a single dichotomously scored item (i.e., a response variable with scores 0 and 1 that follows a Bernoulli distribution),the probability(Pii) for an individual} to get a correct response on item i depends on his or her ability level and his or her group membership; these elements are connected via a log-odds or logit link function(仇)的 follows:
Xiao-Shu Zhu et al. DIF Detection Using HGLMs
.
101 • p10g(~一)=刁t;- β+β W+ β G.+ β (WG);1 月 ij 1"'0 ' t-'1 j " j '1"'2 j - j '1"'3 j \ " - J j (1)
where Wi is the matching variable for studentj (e.g.,the observed total score or the estimated ability level), Gjdenotes the group membership of studentj (i.e.,0 for the reference group and 1 for the focal group) and (WG)j denoted the product / interaction term of these two variables.
In the linear predictor on the right-hand side of the equation, the intercept parameter
13
0 corresponds to the conditional log-odds of a correct response for the reference group, which indicates the“
difficulty level" of this item; thus,a higher value indicates a greater probability for correctly answering itemj for students in the reference group. The parameter131
models a main effect of the matching variable (i.e.,the influence of proficiency differences on item performance) whose inclusion as a covariate represents the matching step in DIF analyses.DIF analyses mai的 focus on the coefficients for the grouping variable. The parameter
13
2 corresponds to a group main effect (i.e., the difference in the conditional log-odds of a correct response between the reference and focal groups) so that a significant non-zero value indicates uniform DIF.Ifnon-uniform DIF is ofthe interest,the/3,
parameter associated with the interaction effect term is used so that a significantly non-zero value for133'
or a significant joint test of13
2 and133'
indicates non-uniform DIF.The HGLM framework that we describe in the following expands these ideas. Itcan be used for two distinctpu中osesas far as DIF detection is concerned,which are to specify and estimate(1) one-and two-parameter hierarchical IRT models for DIF detection, (2) hierarchical logistic regression models for DIF detection,and (3) hybrid IRT and logistic regression models. Since our focus is on data 企om educational surveys we focus specifically on simple cases of models (1) and (3) in the following.
Kamata's (2001) Rasch Model Formulation as a HGLM
A traditional unidimensional IRT model can be viewed as the simultaneous estimation of several simple logistic regression models with a single latent predictor variable. In prototypical IRT models, the latent variable values va可 randomly across students to model differing proficiency levels of students while the item parameter values are fixed to model that a single fixed form is given to a subset of students. A basic IRT model is, by definition, equivalent to a two-level HGLM. Consequently, DIF analyses can be conducted within a HGLM framework, which possess the additional advantages that more levels can be added to the model to accommodate more complex nested data structures. Moreover,covariates can be included at different model levels to account for
.
102 • DIF Detection Using HGLMs Xiao-Shu Zhu et al.DIF or proficiency differences of students.
The utility of the HGLM framework for DIF analyses was original outlined by Kamata (2001) who introduced a hierarchical Rasch model formulation into the literature. In Kamata's level-l model, one item serves as reference item with its difficulty set to
‘
0' and the other items are represented via dummy variables. For a single dichotomously scored item (i.e.,a response variable withscores 旬,and‘
l' that follows a Bernoulli distribution),the probability(刊)for studentj to give a correct response to itemiis expressed via a logit link function(科)aslog~= 刁σ=β+β z. +β'2i
1-pυ 目 i .r' lj~1υZ
2ij +...+β:(k-lljZ(卜llij
=β。i+ 主化 Zqij
(2)
where
PO
j is the level-l intercept or student main effect. ForK
items,K -
1 dummy variables(Zqij) are included at the level-l model,each of which is coded‘
l' for item q and‘
0' otherwise to allow for the possibility that not every item is presented to every student. Consequently , β叮 corresponds to the difficulty parameter for item q,which is interpreted relative to the difficulty of the reference Item.Since proficiency varies across students,
PO
j is modeled as a random effect at level 2. In contrast, since item difficulty remains constant across students, theP
qjparameters are modeled as fixed effects at level 2. When recasting the level-2 model for DIF analyses, a group indicator variable Gjneeds to be included similar to the one-Ievellogistic regression model above:β~j = roo
+
rO I G j+
UOjβqi = rqo + 几IGj
(3)
(4)
where roo is the mean proficiency estimate of the reference group, rOI denotes the mean
difference between the focal and reference group,and UOj is the random effect that follows a normal
distribution with a mean of 0 and a variance of roo
Similarly, rqo is the relative difficulty parameter of item q for the reference group,and rql is
the difference in relative item difficulty between the reference and focal group for item q (i.e., the effect size of DIF for item q relative to the reference item). Taken together,these equations can be expressed as a single regression equation as follows:
Xiao··Shu Zhu et al. DIF Detection Using HGLMs
.
103 •f于 正斗
log(~一)=η。 =
Yoo
+YOIGj
+2)yqo
+yqlG)Zqij
+UOj
l - R l j
ff
(5)which shows the simultaneous adjustment for group differences in mean proficiency (i.e., impact) via
YOI
and group differences in item difficulty (i.e.,DIF) for item q viaYql
.Since the model formulation in equations 2-4 is for the Rasch model,only uniform DIF can be examined. This model is theoretically straightforward to specify and can be easily estimated using general-purpose latent-variable software programs such as SAS 9.2,Mplus 5.0 and HLM 6.0.
Kim's (2003) Simultaneous Logistic Regression Model within the
HGLM Framework
Kim (2003) formulated a hybrid of a logistic regression and an IRT model for DIF detection as a hierarchical model within the HOLM framework. This allowed for the detection of non-uniform DIF while using a Rasch-like modeling basis, which has some potential advantages as HOLM formulations for two-parameter IRT models that could be used to test for non-uniform DIF are rather complicated to set up. The resulting HOLM formulation also allows for a simultaneous estimation of the mean proficiency difference across groups (i.e., impact) as in Kama徊's Rasch model
,which
would have to be estimated separately (e.g.,via a two-sample t-test on observed total scores) if traditional logistic regression models were used for each item.
The HOLM formulation of this hybrid model thus mimics the formulation of Kamata's model and the one-level logistic regression model from above. The level-l regression equation is the same as in Equation 3. However, the level-2 equations for the slope parameters differs from Equation 4 and is the same as in the one-levellogistic regression model in Equation 1:
P
Oj
=Yoo
+几
IGj +UOj
P
qj
=
Yqo
+YqlWj
+Yq2Gj
+Yq3(WG)/
(6)
(7)
Similar to the one-Ievellogistic regression model,the regression coefficient
Y
q2 is used to examine uniform DIF while the regression coefficient心,
or both coefficients jointly,
are used to test for non-uniform DIF.These equations can be expressed as single model equation as follows:p ~
log(~一)斗υ=Yoo+
YolG
j +斗的。 +yqlWj
+Yq2Gj
+Yq3(WG»)Zqij
+UOj
(8).
104 • DIF Detection Using HGLMs Xiao-Shu Zhu et al.which shows the simultaneous adjustment for group differences in mean proficiency (i.e., impact) via YOI' and conditional group differences in item difficulty (i.e.,DIF) for itemqvia Yq2 and Yq 3'
Moreover, it shows that the random effect UOj in Equations 6 and 8 is the conditional proficiency level of an individual student after a matching variable for DIF has been included in the item parameter model at level 2~arguably not as easily interpretable as in Kamata's model though.
However, just as Kamata's original model, it has been criticized for requiring an arbitrary specification of a reference item which may have an undesirable impact on the DIF detection for other items if the reference item is itself subject to DIF; this is addressed with the following two models.
Pan 's Reparameterizations of
Kamatl的 and Kim 甘 ModelFormulations as
HGLMs
Pan (2008) argued that deleting the intercept parameter Yoo in the level-2 model while keeping dummy variables for all items yields an equivalent formulation of the above models for DIF detection without the need to specify a desirably non-DIF item as a reference item. Pan reparameterized Kamata's and Kim's models withK,instead ofK一 1 , dummy variables(Zqi/) in the
level-l model as follows:
見 =
f3
0i + β'Jj Zli/ +β'2jZ勾 +...+β付一I)λk-l)if+f3
kjZki/=β!Oj +
I.,f3
qjZqi/(9)
The level-2 model for the intercept was now written as
Af=uol 、‘,', Aυ ••• A J'. ‘、
in both models while the slope expressions remained as in Equations 4 and 7 for Kamata's and Kim's models,respectively.
Again,these equations can be expressed as single model equations; Pan's reparameterization of Kamata's model is
P
..!£. log(~一)=17u = 斗的。 +YqP)Zqi/ +UOj l-~ 告 、‘,', •• EA --EA J'. ‘、Xiao-Shu Zhu et a1.
P ..!5...
蝴tT= 科=名 (Yqo+Yq
DIF Detection Using HGLMs
.
105 •(12)
Pan's reparameterized version of Kamata's model is still a Rasch model, except that the random effect is a direct estimate of the proficiency level for student j rather than an indirect estimate expressed as a difference from the mean proficiency. Similarly,the Y s now directly represent the
difficulty parameters for specific items,rather than the difficulty parameters relative to the reference Item.
Summary and Discussion
In summary,the four core models for OIF detection within an HGLM framework mentioned above include Kamata's model and Pan 's reparameterization of Kamata's model,both of which are Rasch models,and Kim's model and Pan's reparameterization ofKim's model,both ofwhich can be viewed as hybrid versions of logistic regression models and Rasch models.
Importantly, there is an additional methodological question for Kim's model and Pan's reparameterization of此,which is whether total score estimates or latent-variable estimates should be used as internal matching variables. For complex booklet designs,the use of booklet total scores is tedious and even less desirable than the use of plausible values. Of course,both of these methods seem intuitively less desirable than doing a direct OIF analysis within an IRT framework. To investigate the degree to which these intuitions are true for OIF analysis we have designed a small simulation study that we present in the next section.
We also note that all four HGLMs presented in this section treat the OIF effect as a fixed effect across any potential higher-order sampling units. However,as discussed in the previous section,the nature of sampling design in large-scale surveys results in the fact that responses from students within the same school and / or school district and / or country are contextually dependent upon one another even after proficiency differences have been accounted for. As a result, the two-level HGLMs can be extended to three-level HGLMs to investigate whether the magnitude of OIF varies across schools even though this is not the focus of our paper.
.
106 • DIF Detection Using HGLMs Xiao-Shu Zhu et al.Simulation Study Rationale and Design
Objective of Simulation Study
No simulation study has been conducted so far to investigate the statistical perfonnance of the four core HGLMs in the previous section - and their variations using booklet total scores and plausible values - in relation to one another under different conditions for DIP.Thus,the three main pu叩osesof our simulation study were: 1. to investigate whether using a non-DIF item or a DIF item as the reference item in Kama徊 's and Kim's original models impacts their DIF detection ability; 2. whether using booklet total scores or estimated plausible values in Kim 冶 model and Pam's reparameterization ofit impacts their DIF detection ability; and 3. which ofthe six models perform(s) superior overall across a range of conditions
Design of Simulation Study
We employed a total of seven models, which were: 1. the Rasch model with a mean item parameter constraint for identification as estimated via marginal maximum likelihood in Conquest 2.0; 2. Kama徊 's Rasch model fonnulation as estimated via pseudo maximum likelihood within the HGLM framework with a reference item constraint for identi日cation (Kamata); 3. Kim's model with a reference item constraint for identification as estimated via pseudo maximum likelihood within the HGLM framework and with booklet total scores as matching variables (Kim-BTS); 4. Kim's model with a reference item constraint for identification with plausible values as matching variables as estimated via pseudo maximum likelihood within the HGLM framework and (Kim-PV); 5. Pan's reparameterization of Kamata's Rasch model without a reference item constraint as estimated via pseudo maximum likelihood within the HGLM framework (Pan-Kamata); 6. Pan's reparameterization ofKim冶 modelwithout a reference item constraint and with booklet total scores as matching variables as estimated via pseudo maximum likelihood within the HGLM framework (Pan-Kim-BTS); and (7) Pan's reparameterization of Kim's model without a reference item constraint and with plausible values as matching variables as estimated via pseudo maximum likelihood within the HGLM framework (Pan-Kim-PV). The six HGLMs with their two-level specifications are summarized in Table 1.
DIF Detection Using HGLMs. 107 • 吋(們 HHhh) 吋(們 HHhh) Xiao-Shu Zhu et al. 正叫〈+JK{〈+CCHd 、。這+d之+。。入H 可 、ONC+URC+CCHB屯 JH「。屯 、。-C+。CHd 占這 Hrq 叭。們已+EAt-C+。CHG屯 SE+「。 -o入+之H「。屯 、ONC+正{已+。CHhmh J+、。-之+之H、近 、。{〈+CCHK 『q s 芯+正 -o入+cc入H「 Jq (百 U℃ E ∞)。注 γ-UKFUJ EEU 早已挂∞ -u ℃CE N 詛 咒 『伊~l
+
近 II 足于 N'"
巴之 有ν-.:n + 吋 ~ Nd
唱ν~l + q b N'"
屯 :ν~l + q b Nd
zν~l + 吋 II b N 持 巴之 三ν~l + q b (EUH 』)U 口。自 -UKFUJ 的口 EUKFC 明明。』 U咱可 U這∞ U』∞∞唱 U』 UK 戶乏自己∞〉《 HZH 一注明 -u ℃CE 』。 MHEH 明心這 u司已一問 的UD-唱 kru-nHgD 唱 -ι 明心』。 u 明 -呵 HCHHU-M 晶。。白 U 口 CZ 的UD-呵 kru-nHZD 呵 -ι 明心』。 u 的 -呵抖。甜甜 U-M 晶。。白 uz 。 z 丘吉它呵〉∞ EfH 呵莒 M ::.::: M 也必
::.::: 明ω-nH 吋它由〉 hEEDOM 。張 出口 出口自已。 z 出口 h自己 tz 。 z h口。 出口自己。 z 心已 hHES-UUZU 』 UMUU 凶 C Z 。 Z C Z Q) > 的心〉 Q) > EUH-UUZU 』UMU凶 〉已 tg-凶 tZ 唱已 ∞[戶自 15 一叫 AI 已由已 E 唱叫 A 』已呵已 〉《 HIE-凶 ∞[戶白,告一凶 S 吋口這叫品 的-u 可。甲 4 起。扭扭 υEE 山 EJGEEZH 呵扭扭曲-品。 2υ 這曰:苟且吋扒)已∞'志也已。 -H呵。口已。已∞ -o-A 吋[[.
108 • DIF Detection Using HGLMsFixed Design Factors
Xiao-Shu Zhu et al.
We fixed the number of groups for DIF analyses to two to keep the complexity of the study manageable. To mimic the complex sampling design for students in large-scale survey,we specified that all students from the two student groups were clustered within five schools. For each student group,we specifically generatedlOO students per school resulting in a total sample size of 1,000. Variations in the school and individual weights were not considered in the current simulation study.
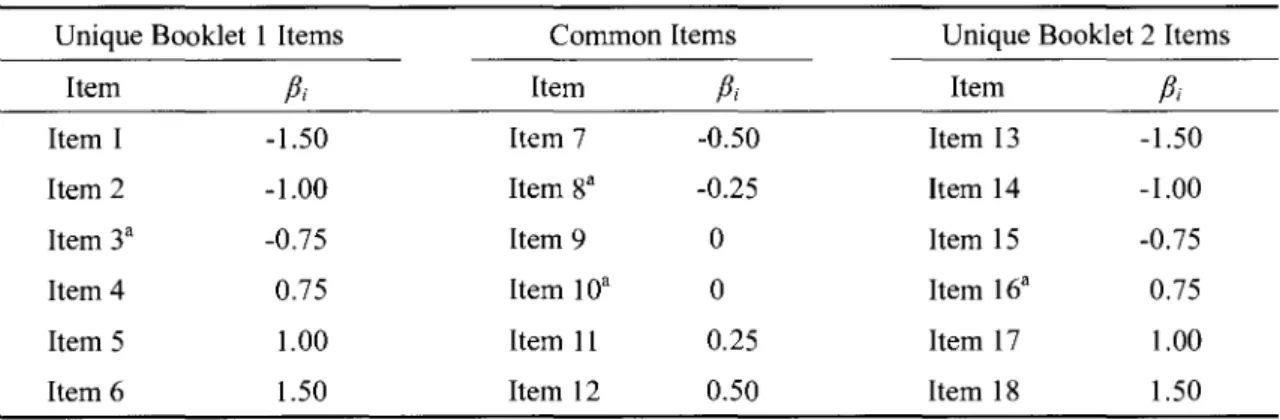
As shown in Table 2,we implemented a complex booklet design for items by generating a total of 18 items and constructing two booklets from them; we specified each booklet to contain 12 items with six items shared by the two booklets. We specified the item parameters within each booklet to range from -1.50 to 1.50 with parameters for anchor items ranging from -0.50 to 0.50 in accordance with a discrete approximation to a normal distribution for item parameters within each booklet. Among the 18 items,we selected four items as DIF items; we specifically selected one easy item
(Item 3), two moderately difficult items (Item 8 and Item 10) and one difficult item (Item 16) as displaying DIF.
Table 2 Item Difficulty Parameters forItem Generation
Unique Booklet 1Items CommonItems Unique Booklet 2Items
Item βt Item βt Item βt Item I -1.50 Item 7 -0.50 Item 13 -1.50 Item 2 1.00 Item 8a -0.25 Item 14 -1.00 Item 3a -0.75 Item 9 O Item 15 -0.75 Item 4 0.75 ItemlOa O Item 16a 0.75 Item 5 1.00 Item 11 0.25 Item 17 1.00 Item 6 1.50 Item 12 0.50 Item 18 1.50
aindicates items for which DIF was introduced.
We completed a total of 30 replications for each condition. We investigated the DIF detection ability of each model by computing the empirical type-I error rates for no仔DIF items as well as the empirical power for DIF items using the 5% cut-offs suggested by the theoretical sampling distributions for the model parameters under the null hypothesis ofno DIE The rates were computed as averages over all items of a particular type (i.e.,non-DIF and DIF items) and,for models with plausible values as matching variables,across all five runs for the five plausible values.
Xiao-Shu Zhu et al.
Manipulated Design Factors
DIF Detection Using HGLMs. 109 •
We specified two types of reference item conditions, one where the reference item did not display DIF and one where the reference item did display DIF; in both conditions we chose a moderately difficult item as the reference item - Item 9 andItem 10,respectively - to allow for a sufficient amount of response variance. We also manipulated the magnitude of DIF at two levels,a moderate effect size of .50 and a strong effect size of .75,which was applied equally to all DIF items. We also manipulated the proficiency score distribution of the focal group at three levels with N(-.5, 1),N(O,1) and N( .5,1) and fixed the distribution of the reference group to N(O,1). Thepu中ose of manipulating the ability distribution was to investigate how well the different models are able to detect DIF in the presence of impact.
Clearly,the above design is not an exhaustive treatment of all possible design factors and their levels that might influence the ability of the models to detect DIF; instead,we wanted to use the design as a consciousness-raising device so that readers can understand some of the basic issues in DIF analyses and interested researchers can extend this simulation to a wider set of conditions.
Data Generation
The model that we used to generate data was the three-level model presented in Binici (2008). In this model,the log-odds of a correct answer to item i by studentj in schoolkis given by
仇 =iik b;'-'j+I aG;k...' - Jik +I ""'ic;G;k' - Jik +I u\(;l"""'Iik +I """'lkU\(:l+I u;~)G ,...2k' - Jik (13)
where bi represents the difficulty of item i; Gjk is the dummy variable for group indicator with
value 汁,when studentj in schoolk belongs to focal group and
‘
0' otherwise; a is the main group effect representing the mean proficiency difference between the focal and reference groups; ci is the interaction effect between item and student variables,which is the difference in item difficulty between focal and reference group or the DIF effect size for item i.The last three terms are the random effects corresponding to the three modellevels. Specifically,
ui:)
represents the random effect associated with schoolk
and can be interpreted as the mean ability of individuals in school k; u位 representsrandom effect ofstude臨 inschools and can be interpreted as the proficiency of studentj in school kexpressed as a difference from the average ability of students in that school; and ui~) represents the random DIF effect, which can be interpreted as the difference of the item difficulty parameter value for schoolkfrom the average item difficulty parameter value across all schools..
110.
DIF Detection Using HGLMs Xiao-Shu Zhu et al.We assume that the u\(;J and ui~) are sampled from a bivariate normal distribution with the following mean vector and variance-covariance matrix:
\Ill--/ 「 -Ili--」 到 2月叮叮 「 lIll-lllL 可 11Ill--」 AVAV 「 lllllll 』 /Ili--1 、\
酬
We specified the variance-covariance matrix as
Z=[::;;OOlo]
which results in a moderate correlation coefficient between the random school and DIF effects 0.004
(ρ=r一一一-=0.4). Finally,we independently sampled the proficiency estimates for studentj
0.01 x 0.01
in school k from a standard normal distribution N = (內, 1 一 σ12k)' We simulated the data in Rand obtained the plausible value estimated via ConQuest 2.0 (恥地, Adams, Wilson, & Haldane, 2007) using the standard Rasch model specification in this software, which constrains the mean item parameter value to
‘
0\We then used SAS PROC GLIMMIX, which uses pseudo maximum-likelihood estimation,的 specify and estimate the six proposed HGLMs. For Kim's model with plausible values and Pan's modification of it,we estimated the model five times,each time with one plausible value,and then aggregated all counts for power and type-I error rates across the five runs.Simulation Study Results
Reference Item Effect
The first issue of interest was whether DIF in the reference item had an effect on the power and type-I error rates for Kamata's and Kim's original model formulations that included a reference item; the resulting values are shown in Table 3 for each combination of the DIF effect size and ability distribution of the focal group.
In short, as one would expect,using a DIF item as a reference item has a negative impact on DIF detection overall. When DIF is present for the reference item,Kamata's and Kim's models were not only unable to effectively detect other DIF items but also incorrectly identify most non-DIF items as displaying DIF. This pattern existed largely independent of proficiency distribution differences and DIF effect sizes; some differences existed in places but those were largely
Xiao-Shu Zhu et al. DIF Detection Using HGLMs
.
III.
Table 3 Power and Type-I Error as a Function of DIF Effect Size, Proficiency DistributionDifference,and DIF in ReferenceItem
DIF Proficiency Distribution ofFocal Group
Effect Reference (Reference Group DistributionisN(O,1)) Model
Size Item N(-0.5,1) N(O,I) 圳的,1)
Power Type-I Error Power Type-I Error Power Type-I Error
Pan .82 .64 .61 .23 .19 .59 None Rasch .69 .16 .67 17 .78 .18 Kamata .53 .05 .60 .05 .65 .04 .50 Non-DIF Kim .28 .30 .50 08 .74 .16 Kamata .08 .56 Aυl .54 .04 .55 DIF Kim .28 .51 .06 .30 .18 .08 Pan .92 .69 .86 .31 .45 73 None Rasch .91 .25 .91 .26 .94 .28 Kamata .85 .05 .84 .03 .87 03 .75 Non-DIF Kim .47 38 .71 .16 .91 .15 Kamata .07 .85 .06 .81 .07 85 DIF Kim .23 .52 .07 .42 .22 .21
Note. Power and type-I error are computed over all items displaying or not displaying DIF,respectively,
excluding the reference item, as well as all replications for plausible values. The row for Pan's model contains aggregated information from Pan's reparameterized versions of Kamata's model and both matching variable versions of Kim's model. The row for Kim's model contains aggregated information for both matching variable versions for Kim 's model.
overshadowed by the overwhelmingly high type-I error rates and relatively low power. This pattern was even worse for Kama徊 's model than for Kim 's model as the former had a less than 10% of chance to detect DIF in other items with even more severely inflated type-I error rates.
In contrast,when the reference item did not display DIF,Kamata's model performed overall best in that it controlled the nominal type-I error rate while showing moderate power across all proficiency distribution conditions. As expected,the power increased as the DIF effect size increased as well. Given the distinct adverse impact of using a DIF item as a reference item, the following analyses exclude models with reference items that contain DIF and only focus on the models in which either the reference item does not display DIF or no reference item is required in the first place.
.
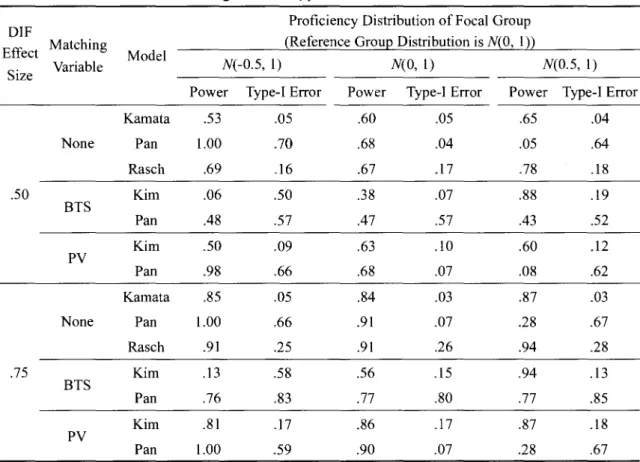
112 • DIF Detection Using HGLMsMatching Variable Effect
Xiao-Shu Zhu et al.
There was a rather complex impact of the type of matching variable on DIF detection in Kim's original model and Pan's reparameterization of it as shown in Table 4,which we compared also to basic Rasch model formulations.
Table 4 Power and Type-I Error as a Function of DIF Effect Size, Proficiency Distribution Difference,and Matching Variable Type
DIF Proficiency Distribution ofFocal Group Effect Matching
Model
(Reference Group Distribution isN(0,I))
Size Variable N(-0.5, I) N(O,I) N(0.5,I) Power Type-I Error Power Type-I Error Power Type-I Error Kamata .53 .05 .60 .05 .65 .04 None Pan 1.0υ
o
.70 .68 .04 .05 .64 Rasch .69 .16 .67 .17 .78 18 .50 Kim .06 .50 .38 .07 .88 .19 BTS Pan .48 .57 .47 .57 .43 .52 Kim .50 .09 .63 10υ .60 .12 PV Pan .98 .66 .68 .07 .08 .62 Kamata .85 .05 .84 .03 .87 .03 None Pan 1. 00υ .66 .91 .07 .28 .67 Rasch .91 .25 .91 .26 .94 .28 .75 Kim .13 .58 .56 .15 94 .13 BTS Pan .76 .83 .77 .80 .77 .85 Kim .81 .17 .86 .17 .87 .18 PV Pan 1.0υo
.59 .90 .07 .28 .67Note. Power and type-I error are computed over all items displaying or not displaying DIF,respectively,
excluding the reference item,as well as all replications for plausible values. BTV= Booklet total scores,
PV= plausible values.
Overall, Kamata's original Rasch model specification and the Rasch model specification in Conquest 2.0 performed comparatively better than Kim's model or Pan's reparameterization of it.
They had consistent power largely independent of proficiency distribution differences and power differences were consistent with the magnitude differences of the DIF effect sizes; however, the Conquest 2.0 model estimation for the Rasch model showed some noticeable type-I error rate inflation. P妞 'sreparameterization of Kamata's model performed relatively more poorly among the
Xiao-Shu Zhu et al. DIF Detection Using HGLMs
.
113 • set of Rasch models whenever the proficiency distribution of the focal group did not match the proficiency distribution of the reference group.Looking across the models that use matching variables specifically, Kim's model performed best when plausible values were used with moderate to high power and relatively mildly inflated type-I error rates across all proficiency distribution and DIF effect size conditions. In contrast,Pan's reparameterization of Kim's model with plausible values only worked well when the proficiency distribution of the focal group matched that of the reference group but performed poorly otherwise. The use ofbooklet total scores cannot be recommended for Pan's reparameterization of Kim's model at all and did not fare much better for Kim's original model even though,amongst all conditions for it,the best condition was the one where the proficiency distributions of the reference and focal group matched.
General Model Comparison
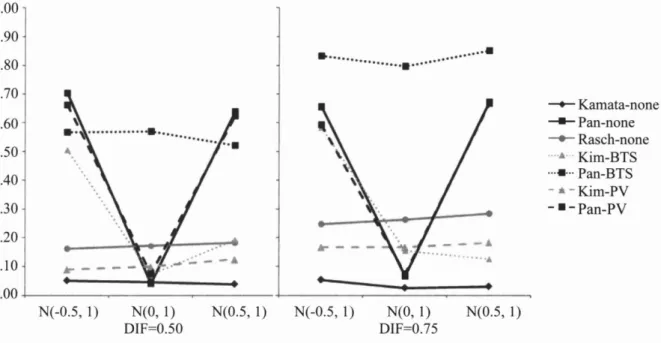
To summarize the patterns in Tables 3 and 4 above,the type-I error rates and power for the models we investigated are plotted in Figure 1 and Figure 2,respectively.
1.00 0.90 0.80 0.70 0.60 0.50 0.40 0.30 0.20 0.10 0.00
...•
. . . a . .
...
-1•
、‘"
...
-A N(-0.5,1) N(O,I) N(0.5,1) N(-0.5,1) N(O,1) N(0.5,1) DIF=0.50 DIF=0.75 一← Kamata-none 一﹒-Pan-none 一。一 Rasch-none ....•.. Kim-BTS ...•... Pan-BTS - . -Kim-PV-.
-Pan-PVFigure1. Type-I error rates across different models as a function ofDIF effect size and distributional differences
.
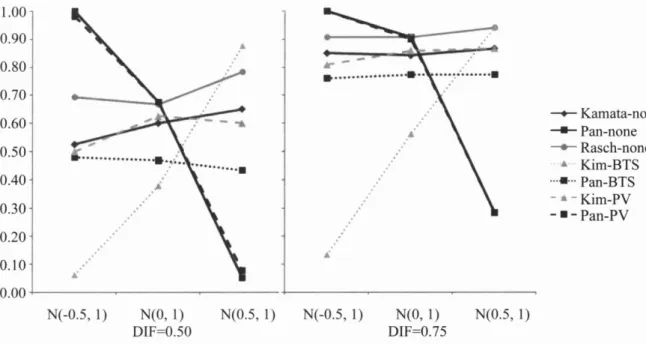
114 • DIF Detection Using HGLMs Xiao-Shu Zhu et al. 1.00 0.90 0.80 0.70 0.60 0.50 0.40 0.30 0.20 0.10 0.00 一+-Kamata-none-.-
Pan-none 一.一 Rasch-none.',
Kim-BTS ...•... Pan-BTS 申蠢 -Kim-PV-.-
Pan-PV aa -Y ••• A . A A. N(-0.5,1) N(0,1) N(0.5,1) N(-0.5,1) N(0,1) N(0.5,1) DIF=0.50 DIF=0.75Figure2. Power across different models as a function of DIF effect size and distributional differences computed using theoretical cut-offs
Overall, only in Kamata's model did the empirical sampling distributions match the theoretically expected ones closely, followed by Kim's original model formulation with plausible values as matching variables and the Rasch model as implemented in Conquest 2.0,both of which appear to require slight adjustments to the cut-off values.
More specifically, it can be seen that the test statistics followed the theoretical sampling distributions best when the proficiency distributions of the focal and reference group matched. The one exception was Pan's reparameterized version ofKim's model with booklet total scores,which showed uniformly poor performance. Pan 's modifications of models also showed strikingly large increases in type-I error rates overall whenever the proficiency distributions for the focal and reference group were different independent of the magnitude of the DIF effect size.
With respect to power,one has to be careful with the interpretations of the patterns in Figure 2 as the inflated type-I error rates in Figure 1 indicate that the cut-off values for decision-making should be adjusted upward and, thus, effectively result in decreased power rates. As one would expect, then, the Rasch model as estimated via maximum likelihood in Coquest 2.0, Kamata's HGLM version of it as estimated with pseudo maximum likelihood, and Kim's original hybrid model with plausible values as matching variables appear to perform similarly well considering some slight downward a吐justmentsfor the latter two models given the observed inflated type-I error rates.
Xiao-Shu Zhu et al. DIF Detection Using HGLMs
.
115· As stated before, Pan's versions of the models without reference items or Kim's model with booklet total scores are only attractive alternatives when proficiency distribution differences between focal and reference group can be assumed to be nonexistent. Given the highly inflated type-l error rates,we are hesitant to make other global statements about the remaining models across conditions.Real-Data Analyses Using TIMSS 2007 Data
The Data
The example items for this analysis come from the publicly released TIMSS 2007 science items for 4th grade (TIMSS & PIRLS International Study Center, 2009). To keep the illustration conceptually simple, we use a unidimensional subtest with items from the life science content domain only and use all 24 dichotomously scored life science items that can be found in eight out of the 14 booklets in the database. The subsample from the overall U.S. sample that we used consisted of 4,483 students who provided responses to at least one of these eight booklets.
A section of the raw data file is shown in Figure 3 to illustrate the data structure in TIMSS; in particular,the distinction between randomly missing data and data missing by design is apparent (see also Enders,20 I0,for more detailed discussions of missing data analysis in general).
In TIMSS, as in our simulation study, two booklets usually share several common items. For example,booklet I and booklet 2 (the first column is the booklet ID) contain eight and seven items,
respectively,and share four common anchor items. Consequently,anchor items have more responses from the selected 4,483 students than booklet-specific items and yield more precise parameter estimates.
The TIMSS 2007 international database also provides various student background variables,
including sex,age and testing language of the students. For this paper our focus is on the potential gender bias on the life science items to mimic a two-level grouping variable from the simulation study. Our use of sex as a grouping variable,albeit chosen primarily for its two-level nature, was substantively motivated by research on DIF by Hamilton(1999) and Hamilton and Snow(1998) who found that for those items requmng spatial reasoning or visual content, the male examinees performed better than the female examinees after matching on total test scores. Zenis旬,Hambleton, and Robin (2003b) further suggested that gender DIF in science could result from three sources: item content category, reference component, and item type. However, we acknowledge that our intent here is not substantive interpretation but,rather,illustration of consistency of results across a variety
Xiao-Shu Zhu et al. 旦司的名 hDE 咱已。可白白宮∞ EESSE-EZZ 偉志的 S 呂∞∞ E 口,古巴旦芯 ω∞ -ht3hdhh
.
116 • D1F Detection Using HGLMsXiao-Shu Zhu et al.
of statistical DIF detection methods.
Data Preparation
DIF Detection Using HGLMs. 117 •
In the following we show the data preparation for DIF analyses in HLM 6.0 (Raudenbush et aI., 2004) where each model level requires one separate data file; if SAS PROC GLIMMIX were used then only one file would be needed.
In the original data file the responses and background information for one individual are arranged in one single row as shown in Figure 3. The ID variables for the booklet (IDBOOK),
school (IDSCH) and student (IDSTUD) were used to identify each individual. The following 24 variables (VI to V24) are the response to the 24 selected life science items. The grouping variable (SEX),five plausible values (PVs),as well as the booklet scores for one particular booklet (SUBT) are also included. As we discussed earlier,the use of a complex sampling design requires the use of appropriate sampling weights for secondary analyses such as the DIF analyses we conduct here. Consequently,the two appropriate sampling weight variables for the students and the schools,which are not shown in Figure 3,were also used.
For all the HGLM DIF analyses, dummy variables were specified in the model as item indicators. The 24 items require 23 dummy variables for Kamata's and Kim's original models. Instead of one row for one student as in the original data file,a matrix with 24 rows and 23 columns is specified for each student as shown in Figure 4; in this matrix the response for a particular item for a particular student occupies one row.
In particular,the first row represents the first student's response to the first item. Since the first item is used as reference item in the example data,it is noticeable that all the dummy variables are given ‘0' values for this item. The exact item scores for the 24 items are arranged in one column while the ID variables,weight variables,plausible values,booklet total score,and sex for a particular student are the same across the 24 rows for each student. The data files for Pan's modified models are very similar except that there is one dummy variable for each item.
As the simulation study showed, whether a reference item displays DIF or not has a strong impact on DIF detection for other items in Kamata's and Kim's original models; unfortunately,in the absence of a priori DIF information,for the empirical data it is hard to decide which item should be selected as reference item. The strategy we used is to select two items (Item land Item 24) as reference items for the TIMSS data in a two-step stra
Xiao-Shu Zhu et al 自 ωzgg 』ωMEZ-EBHZH-偉 EJUE 』晶且自由但由可∞〈∞怕。 ω1 日吋阿叫出 vhvk 『Hh 心hh
Xiao-Shu Zhu et al.
DIF Analysis Results
DIF Detection Using HGLMs
.
119 •Recall that no reference item is required for the Rasch model and Pan 's three reparameterized versions ofKamata's model and Kim's model- one with booklet total scores and one with plausible values. Since these models seem to perform better for DIF detection,the results of DIF analyses for these four models are compared first to provide the initial identifications of DIF items; results are summarized in Table 5.
Overall, eight out of 24 items are consistently identified as displaying DIF by at least three models; specifically,five items were declared to favor male students(Item I,Item 3,Item 5,Item II andItem 22) and the other three were declared to favor female students(Item 2,Item 4 andItem 19); due to the consistency across models it is likely that these results are trustworthy. The Rasch model identified four more items as displaying DIF (i.e.,Item 7,Item 8,Item 12 andItem 20),which may be due to a slightly inflated type-I error rate relative to the other models assuming the ability distributions are identical across the two groups. We note also that we would expect about 1-2 items to be declared as displaying DIF anyway under a nominal 5% type-I error rate.
The models that require reference items were compared next with Items 1 and 24 chosen as reference items for two separate runs; we selected these items based on their likely DIF characteristics. Specifically, according to the DIF analyses using models without reference items above,it is most likely that Item I displays DIF against males while Item 24 is most likely not displaying DIF against either sex group.
In short, the analyses with these two items as reference items echo the findings in the simulation study. Specifically,when the likely non-DIF item,Item 24, is used as a reference item,
Kim's model with plausible values as well as Kamata's model agrees with the results from the previous analyses for the remaining items,especially for items where multiple models pointed to DIF.
However,when the likely DIF item,Item 1,is used as a reference item,Kamata's model and Kim's model with plausible values agree but they flag many other items as displaying DIF,predominantly for females,which is largely contrary to the directionality of the DIF effects detected previously. Moreover,Kim's model with booklet total scores gives conflicting results with respect to these two models.
Table 5 DIF Detection Results for TIMSS It ems using Different Models No Reference Reference It em 1 Reference It em 24 It em Rasch Pan-Kamata Pan-Kim 平 V Pan-Kim-BTS Kamata Kim-PV Kim-BTS Kamata Kim-PV Kim-BTS k 由 9uhv mm .E R叫 QU
MFWFWWWFWWMMWWMMMFM
蜘叫
sa γAFK FW ut- 乎乎 -gO 它 p3 們且 Im 位 MU MFMFMFMFFME-KE :-MS E 叮 E hvm :-GQh F 海 K L--b MFMFMFMFFMmT 如﹒叫 mmm EBob 汀倒叫 dPN n 同志 E 心 U-FFFWWMWMMM-FM
站叫
.ρiv戶UWQU YTir 且 OL j叫 q“ r且 dsm MU汀 h vfa -FFFFFFFFFFFFFF 一串即制 -hkd ﹒可目的 -1 』 -訓 nk 目 ρivqGnu -rPAO 一時 db FFFFFFFFFFFFFF 一叫個抽 -Mvhw -3l -mb油 -hmm -nas -myvtd MMFFWFFWFFM-U 姐姐 一位pd 一的風m E 兒 a , 一tmm -汀 aA 一&KA 吼 一個bm -gLIM --hig MFMFMMFM-Johbn -hmum --tdh 于叭圳m -ce 的 -mdu --nuHE --也e 叮 一心血跡 MFMFMMFM-nsi 心 于心的UM -EL---ρlwIamQO Ttnku 回 VAatqAME2Il --O 訂 P 一沮昀 h -0 、&..•
MFMFMMFMMFFM 一叮叮伽.m-m
旺啊
。 12345678901234-hr 句 n l234567891111lIll--A22222-t 仙 I mmmmmmmmmmmmmmmmmmmmmmmm 一川卸的 eeeeeeeeeeeeeeeeeee--3lkkkkkkkkkkkkkukkkkkkkkku-nω 門UP 、UYM且﹒1
Xiao-Shu Zhu et al. DIF Detection Using HGLMs. 121
.
analyses,seven out of the 18 booklets that we used required five or six other reference items in addition to Item I,which makes strict comparisons difficult.Discussion
In this paper we reviewed key ideas for DIF detection generally and their practical implementation for educational surveys using the HGLM framework specifically. The complex sampling design for students coupled with the complex booklet design for items have a significant impact on the ways DIF parameters and their standard errors need to be estimated. By utilizing the HGLM framework, as one member of the larger family of GLLAMMs,explanatory DIF analyses can be conducted accurately and efficiently.
Six general HGLMs within the GLLAMM framework were introduced and a small-scale simulation study was conducted to compare their DIF detection ability under different conditions. Given the technical nuisance and undesirability of obtaining total scores on a booklet-by-booklet basis under a complex booklet design,IRT models are generally preferable. Indeed,the simulation study indicated that the Rasch models perform best across a wide range of conditions with some exceptions that align with theoretical expectations.
Specifically,the DlF detection ability of Kamata's Rasch model formulation is dependent upon whether DIF is present in the reference item. One possible solution is to randomly select several items as reference items and compare results for the other items across all analyses in order to identi
fY
potential DlF items. Since both the results of the simulation study and the empirical data indicate that the Rasch model as estimated in Conquest 2.0 may also lead to a few additional false-positives, we suggest combining the results from both model formulations 一 or multiple comparable model formulations for the same model generally - to arrive at a joint judgment about DIP.Even though removing the need to identi
fY
a reference item through the application of Pan's reparameterized models is conceptually appealing,all of Pan 's modified models were sensitive to whether the proficiency distributions between the two groups of interests matched or not. The unacceptably high type-l error rates when the distributions did not match in the simulation study reflected the seeming inability of the modified models to differentiate between impact and DIP. Further study is required to explore this issue comprehensively.In real-data analyses where true proficiency score distributions are not known the use of models that are not affected by potential distributional differences is key and,if a range of models with
.
122 • DIF Detection Using HGLMs Xiao-Shu Zhu et al.different properties is used,a synthesis of evidence is required. For example,for our data set there were several items for which the same items were flagged for the same sex group - even when Pan's models were used - which is strong evidence of likely DIF for these items.
Interestingly,the use ofplausible values in Kim's model- albeit not Pan's modification ofit for differing proficiency distributions - did not appear to deteriorate the DIF detection markedly compared to Kamata's Rasch model formulation or the Rasch model formulation as estimated in Conquest 2.0. That is, if a hybrid IRT and logistic regression modeling approach within a HOLM framework is desirable, using plausible values in complex booklet design scenarios seems to be possible ifKim's original model formulation with a non-DIF reference item is used.
Of course,if individual response data are available,which is necessary for DIF analyses,there is no technical reason - and no real statistical advantage that we can think of - to using a hybrid IRT and logistic regression approach as in Kim's model over a direct IRT approach. This would seem to be true for Rasch models,which allow only for the detection of uniform DIF by definition,as well as two-parameter models, which allow for the detection of both uniform and non-uniform DIF. The specification and the resulting DIF detection of two-parameter models can still be somewhat cumbersome in some general-purpose latent-variable estimation programs,but we expect that any perceived specification and estimation advantages of Kim's model will vanish in the near future. Nevertheless, our simulation study provides some evidence that plausible values could be used if desired, especially if the results are properly aggregated across the multiple analyses that they reqUire.