行政院國家科學委員會專題研究計畫 期中進度報告
投資銀行推薦股票之利益衝突及其決定因素(1/2)
計畫類別: 個別型計畫 計畫編號: NSC94-2416-H-004-044- 執行期間: 94 年 08 月 01 日至 95 年 07 月 31 日 執行單位: 國立政治大學金融系 計畫主持人: 沈中華 報告類型: 精簡報告 處理方式: 本計畫可公開查詢中 華 民 國 95 年 5 月 2 日
Mar 23, 2006
Trust Your Friends, But Don’t Forget
to Lock Your Car Door
Conflicts of Interest in the Stock Recommendations of
Investment Banks and Their Determinants
Abstract
This paper explores the phenomena associated with conflicts of interest,
particularly as they pertain to the proprietary trading and brokerage divisions of
investment banks. This distinguishes it from past studies, which have researched
conflicts of interest between underwriting and brokerage divisions. We examine
whether or not an investment bank issues buy recommendations to the market and, at
the same time, sells the same recommended stocks through its proprietary trading
division, and if so, to what extent this goes on. This paper, therefore, constructs the
indices of such conflicts of interest based on weeks, amounts and shares so as to
measure the extent of such conflicts of interest using Taiwan’s stock market from
January 2000 to December 2003. We obtain the following results.
First, conflicts of interest do, indeed, exist, and some investment banks
continuously sell (and/or buy no) recommended stocks a few weeks before and after
posting their buy recommendations. Second, those investment banks, which are more
prone to have conflicts of interest are generally characterized as being smaller in size
and issuing more frequent buy recommendations. Third, firms whose stocks are most
associated with a conflict of interest typically have a smaller trading volume, are
smaller in size, have greater systematic risk, have more insider holdings and are
issued recommendations less frequently. Finally, a stock recommendation coupled
with a conflict of interest is beneficial to the profits of an investment bank, especially
to its brokerage division.
JEL classification: G14, G24, G28, G34
1. Introduction
On account of recent allegations of accounting fraud at Enron, soon followed by
allegations of there being problems with tainted research at such brokerage houses as
Merrill Lynch and Morgan Stanley, investors seem to have increasingly lost
confidence in brokerage analysts' integrity as far as issuing unbiased and trustworthy
stock recommendations goes. In response to such potential conflicts of interest among
security analysts employed by investment banking firms, on April 28, 2003, the
Securities and Exchange Commission (SEC) in the U.S. announced a historic
agreement with large investment banks, known as the Global Analyst Research
Settlement.1
Since then, securities firms have been required to separate their
brokerage from their investment banking activities because research analysts in the
former may face undue pressure from their respective investment banking division to
issue stock reports that favor the interests of their investment banking clients over
those of their brokerage clients (Morgan and Stocken, 2003). According to Michaely
and Womack (1999), three main sources of income for investment banks, i.e.,
investment banking (such as underwriting issues of publicly traded companies, raising
bank loans and giving advice on mergers), brokerage services (such as providing
investment advice and conducting equity research) and proprietary trading, may create
conflicts of interest within a bank and between a bank and its clients. To examine
whether investment banks have constructed a “Chinese Wall” between their
investment banking division and their brokerage division, researchers have seriously
begun to analyze the quality of stock recommendations because conflicts of interest
have often arisen, and these from two scenarios, in particular. First, when brokerage
analysts’ compensation is positively related to the profits of the corporate finance
division, these analysts are more likely to issue positively-biased recommendations
about firms that have business dealings with their corporate finance divisions even
1
The ten firms are Bear Sterns, Citigroup, Credit Suisse First Boston, Goldman Sachs, J. P. Morgan Securities, Lehman Brothers, Merrill Lynch,
though those analysts’ outside reputation depends, at least partially, on the quality of
their recommendations. Secondly, not wanting to offend their investment banking
clients, analysts may well opt to offer favorable comments on their clients’ stocks.
To cite another example, Michaely and Womack (1999) find that when
recommended by underwriter analysts, stocks typically perform more poorly than
when they are recommended by unaffiliated equity analysts. This is also supported
by the research of Barber, Lehavy and Trueman (2004) who find that the average
daily abnormal returns from an independent research firm’s buy recommendations
exceed those of investment banks by almost 8 percent annualized.Conversely, those
same investment banks’ buy recommendations subsequent to equity offerings
underperform by an almost astounding 22 percent annualized, when compared to the
buy recommendations of independent research firms. To account for this
underperformance on the part of investment banks, Barber, Lehavy and Trueman
(2004) hold the view that at least part of this can be attributed to banks’ reluctance to
downgrade stocks even when the prospects of those stocks have actually diminished.
This, therefore, represents a potential conflict of interest among security analysts
employed by investment banking firms.2
More empirical evidence that supports the view that affiliated analysts’
earnings forecasts and recommendations are significantly more favorable than those
made by unaffiliated analysts abound. Among these, Dechow, Hutton, and Sloan
(2000) find that, as a rule, stocks are most overpriced when they are covered by
affiliated underwriters. Again, this finding is a clear sign that potential conflicts of
2
Some research finds that analysts’ recommendations are informative. For example, Stickel (1995) and Womack (1996) find that favorable (unfavorable) changes in individual analyst recommendations are accompanied by positive (negative) returns at the time of and after their announcement. But Barber, Lehavy, McNichols, and Trueman (2001) show that high trading levels are required to capture the excess returns generated by purchasing (selling short) stocks with the most (least) favorable agreed upon recommendations along with daily portfolio rebalancing and a timely response to changes in recommendations. Since these strategies entail substantial transaction costs, they cannot reliably generate
interest exist among security analysts employed by investment banking firms (also
see Dugar and Nathan, 1995; Lin and McNichols, 1998).
While research on stock recommendations has been voluminous, for the most
part, such studies have focused on conflicts of interest between an “investment
banking” division and a “brokerage” division.3
Yet, the picture would be far from
complete without recognizing potential conflicts of interest between a “proprietary
trading” division and a “brokerage” division. To the best of the present authors’
knowledge, however, no study has ever empirically studied the conflicts of interest
between a “proprietary trading” division and a “brokerage” division.4
It cannot be
ignored that additional conflicts of interest may arise when an investment bank holds
a large number of overvalued stocks which are expected to fall in value in the near
future. In this case, to avoid losses, that bank’s research department might issue buy
3
See Dugar and Nathan (1995); Lin and McNichols (1998); Dechow, Hutton, and Sloan, (2000); Ljungqvist, Marston, and Wilhelm (2003); Ellis, Michaely, and O’Hara (2004); as well as Barber, Lehavy, and Trueman (2004) and references therein.
4
One exception is Chan, Chang, and Wang (2004) who measure the relation between equity recommendations and stock trades of financial firms using U.S. data. They find that financial firms actually trade with their own recommendations before, during and after they are issued. However, their
paper is quite different from ours in four aspects: (i) To measure the
stock trades of financial firms, they use changes in the holdings of financial firms, where the data are only available at quarterly intervals. However, the use of quarterly holdings may ignore that stock recommendations have been revised several times within a quarter. Also, the performance of a corporation has changed. The use of weekly data may therefore be more precise in detecting whether investment banks send a wrong message. (ii) We also explore the determinants of the conflicts of interest of investment banks. This helps us to understand the motivating forces for security houses to issue biased buy recommendations. (iii) We also delve into the financial characteristics of those biased buy recommendation stocks. (iv) We explore whether brokerage and dealer departments of the investment banks profit when they have conflicts of interest.
Also, Sirri’s (2004) analysis of conflicts of interest between research and proprietary trading is similar to but not completely the same as ours. He claims that analysts could favor some investors over others in choosing how to disseminate the information, which is used to make more precise inferences about the value of a given security. For example, analysts could allow the information to be used internally at the bank’s proprietary trading desk where the bank may establish a large principal position based on such information. However, he does not empirically analyze the potential
recommendations, thereby misleading its brokerage customers, and at the same time,
its proprietary trading division might be selling off the same recommended stocks.
In the presence of this new type of conflict of interest, an independent security
house5 may also issue biased recommendations even though it has no affiliation
with its customers. Insight into conflicts of interest between a proprietary trading
division and a brokerage division within an investment bank complements and
completes the understanding we require of conflicts of interest.
The major aim of this paper is to investigate, for the first time, this never before
studied conflict of interest: i.e., one between a proprietary trading division and a
brokerage division. Hereafter, our conflict of interest only refers to the stress and
strain that occurs between a proprietary trading division and a brokerage division.
To do so, we use a developing country, Taiwan, as the example because of data
availability. In Taiwan, in every Sunday commercial newspaper, roughly six
security houses make buy recommendations based on their own favored stocks. We
investigate the buying and selling activities of security houses one and two weeks
before and after buy recommendations are made. As there are no sell
recommendations, we refine our definition of this new type of conflict of interest by
limiting it as follows. There is no conflict of interest in the event that a security
house buys the stocks it has recommended, whereas there is a conflict of interest in
the event that it sells the very stocks it has recommended.
To achieve our goal to investigate this new type of conflict of interest, we first
construct three indices of conflicts of interest within each security house based on
weeks, amounts and shares, this in order to measure the magnitude of the conflicts
of interest in stock recommendations. We employ information for only one and two
weeks before and after a buy recommendation, where ‘week’ means the number of
weeks the net sells of a security house are positive, ‘amount’ means the net worth of
the stocks it buys and sells, and ‘shares’ means the net number of shares it buys and
sells.
Once we construct the indices of the conflicts of interest, we explore their
determinants as this helps us to gain an understanding and insight into the
motivating forces for security houses to issue biased buy recommendations. We
investigate the following questions: First, are larger security houses which have
been established for a longer period of time less prone to operate with conflicts of
interest for fear of tarnishing their reputation? Secondly, are security houses that
more frequently issue recommendations associated with conflicts of interest? It is
important to note that we expect that unsophisticated, less savvy investors will be
able to greatly benefit from our findings when they are confronted with the decision
to accept or reject stock recommendations.
Besides this, we delve into the financial characteristics of those firms whose
stocks are often recommended because of a bias. More specifically, we examine
whether the characteristics of being illiquid, smaller and fast-growing as well as of
having higher systematic risk and of making less frequent recommendations make
those firms’ stocks more prone to be associated with a higher incidence of conflicts of
interest vis-à-vis stock recommendations.
Finally, with respect to these very conflicts of interest vis-à-vis stock
recommendations, we investigate the extent to which they are beneficial to the profits
of an investment bank. The purpose of making buy recommendations and, all the
while, selling those very stocks is either to gain profit or to avoid loss. In this regard,
an investment bank’s issuing biased recommendations may generate trade and
increase the amount of trading revenue it expects their reports to generate.6 To
6
The ability of analysts to generate trade is a key assumption in McNichols and O'Brien (1997) study, which shows that self-censoring is a possible explanation for analysts' earnings optimism. The authors contend that potential trading revenue influences an analyst's decision to release a particular forecast. By using a unique data set obtained from the Toronto Stock Exchange (TSE), Irvine (2001) finds that analysts’ coverage of a particular stock results in a significantly higher broker volume in that stock; on average, brokers increase their market share in covered stocks
explore this issue, we examine whether the profits of investment banks are affected by
conflicts of interest. If the market is able to differentiate between good and bad stock
recommendations, then in all likelihood, investment banks with more conflicts of
interest cannot generate as much profit by issuing biased recommendations.
This paper is organized as follows. Section 2 outlines the relevant background
information and the sources of the data. Section 3 provides details on the method we
use to construct the “indices of the conflicts of interest in stock recommendations”
and discusses the determinants of these. Section 4 provides a discussion on the
empirical models. Section 5 summarizes the data and the descriptive statistics.
Section 6 discusses the determinants of and the impact on profits gained from
having conflicts of interest, this based on empirical research. Section 7 presents the
conclusions that we draw from this extensive research.
2. Background and Sources of the Data
2.1 Taiwan Stock Exchange
Generally, a stock exchange is one of the most important financial markets in a
country, and this is certainly no less true of the Taiwan Stock Exchange (TAIEX),
which reflects Taiwan as an emerging yet rapidly expanding market. The TAIEX
commenced operations on February 9, 1962 with only 18 listed companies, but by
the end of 2003, that number had drastically increased to 669. The total year-end
market capitalization in 2003, represented by 470 billion shares outstanding,
amounted to an impressive NT$ 12,896 billion. In tune with the objectives of the
TAIEX to accelerate capital market internationalization and to promote innovation
and professionalism, the share of total trade by classified institutional investors
increased from a mere 3.33% at the end of 1990 to a somewhat staggering 22.16%
in just 13 years. This figure includes trade by registered trading firms (dealing with
their own accounts), domestic investment companies (closed-ended and mutual that analysts' coverage decisions depend, at least in part, on the amount
funds), asset management companies with overseas capital and qualified foreign
institutional investors. Just as stunning, the number of securities company branches
and the accumulated number of accounts opened at securities companies surged
from 67 and 634,495 at the end of 1987 to 1,153 and 13,720,461 at the end of 2004,
respectively.
Such rapid expansion notwithstanding, small individual investors largely tend
to base their investments on news reports in various media, such as TV and the web,
analyst reports and on stock recommendations issued by investment banks.
Institutional investors, on the other hand, are gradually becoming more and more
astute, sophisticated players, and their trading affects stock returns which, in turn,
affects small individual investors (see Lee, Lin and Liu, 1999). It goes without
saying, therefore, that the relatively more unsophisticated individual investors, with
much less expertise with which to judge the prospects of listed companies, could be
much better off by institutionalizing their investment decisions by investing in
mutual funds. But according to annual statistical reports from the Taiwan Stock
Exchange Corporation (TSEC), despite a decline from 96.67% at the end of 1990,
trading by individual investors still amounted to 78.84% of total trade by the end of
2003. Thus, there is little doubt that individual investors in Taiwan still prefer to
make their trade decisions on their own. Particularly important to note here is that
investment banks, by virtue of their greater expertise and definitive edge in terms of
access to information, could very well expropriate undue profits from individual
investors by issuing biased stock recommendations.
2.2 Sources of the Data on Proprietary Trading
As stated earlier, in every Sunday commercial newspaper, about six security
houses issue buy recommendations, but exactly which six investment banks is
usually randomly selected by those newspapers and hence may not be the same each
week. That a particular stock receives a buy recommendation sends a strong signal
recommendations are given as that could offend a bank’s customers, and besides this,
rarely are there any “hold” recommendations. It is, of course, widely assumed that
security houses themselves do not sell the stocks they recommend unsophisticated
investors to buy.
This proprietary trading information, including the names of stocks, the
transaction amounts of stocks and the number of shares, is reported to the SEC
weekly.7
For this reason, we are in the unique position of having complete records
of the buying and selling activities of investment banks before and after they issue
buy recommendations. Because this trading information is released on a weekly
basis, we only use “weekly” data. Furthermore, because the impact of a particular
stock recommendation on unsophisticated investors cannot be sustained over a long
period of time, we only collect data on the proprietary trading of security houses for
one- and two-week periods before and after each recommendation, and these data
cover January 2000 to December 2003.
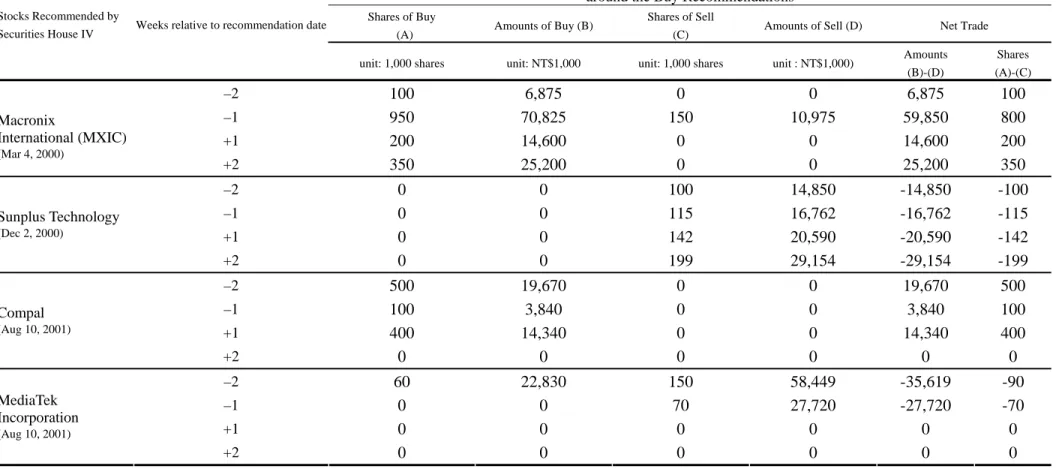
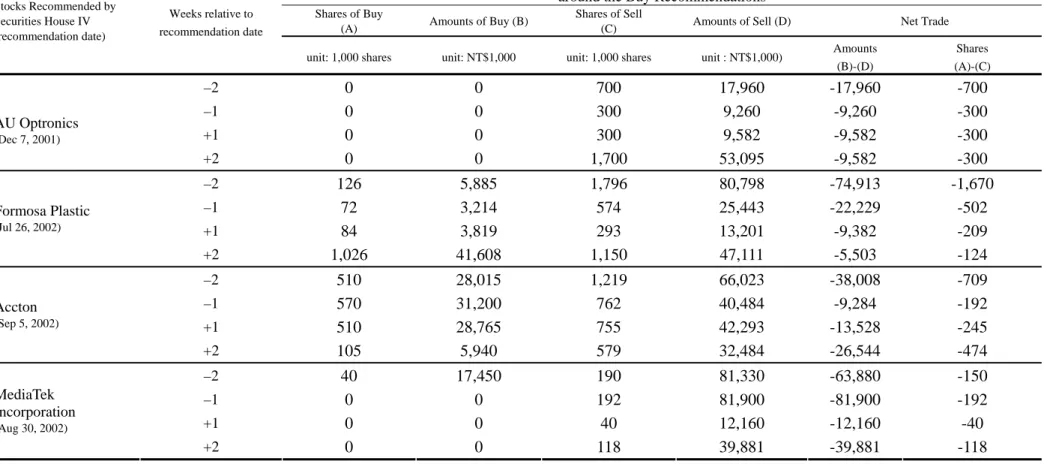
To get a firmer grip on our data, we use the data presented in Table 1 as the
example to explain proprietary trading after recommendations have been made. As
shown, the investment bank, Securities House IV,8 which is ranked among the top
three in terms of brokerage, offered eight buy recommendations between 2000 and
2002. As described above, we collect the proprietary trading data for one- and
two-week periods before and after each recommendation. Between 2000 and 2002,
Securities House IV recommended eight stocks, i.e., Macronix International
(MXIC), Sunplus, Compal, MediaTek, AUO, FPC and Accton. Clearly, there were
conflicts of interest with regard to five stocks, but not for MXIC and Compal. Take
Sunplus (Sunplus Technology Company Limited) to illustrate this. Securities
House IV made a buy recommendation on December 2, 2000 but sold the stocks on
7
The Taiwan Economic Journal, a private data vendor in Taiwan, collects these data.
8
We use capital letters from A to Z and Roman numerals from II to VI
proprietary trading for four weeks, i.e., the dealer department sold Sunplus stocks
for these four weeks (two weeks before and two weeks after the recommendation),
with the selling amounts per week being 100 (100,000 shares), 150 (150,000
shares), 142 (142,000 shares) and 199 (199,000 shares) respectively in each
consecutive year. From this, it is apparent that not all buy recommendations with a
conflict of interest are highly concealed for fear of being viewed as tricks; quite the
contrary, some, like this, are very noticeable indeed.
3. Measures and Determinants of Conflicts of Interest
We construct three indices for conflicts of interests between the proprietary
trading division and the brokerage division of an investment bank.
3.1 Three Measures of the Conflict of Interest Indices
A. By Week. We use net sell and net buy to define the selling action of a
proprietary division because the division may buy and sell the same stocks in the
same week. That is, a net sell week (denoted as NSWi) means that the sell amounts
of proprietary trading exceed the buy amounts, whereas a net buy week (denoted as
NBWi) means the buy amounts exceed the sell amounts, where the subscript i
denotes the ith week. The two terms are equal to one if they are positive and zero if
negative. For example, for i week around the recommendation, if a dealer
department buys 10 shares but sells 7, then NSWi = 1 and NBWi = 0. Thus, the
measure of the conflict of interest by weeks (CI_W) is defined as the net sell week minus the net buy week. That is:
CI_WN =
∑
+ − = − N t N t i i i NBW NSW ) ( , N=1, 2. (1)This means we calculate the number of the cumulative week’s total as the difference
between NSWi and NBWi , first, for one week (N=1) and, then, for two weeks (N=2)
before and after the recommendation at time t. When N=1, the highest measure of
the conflict of interest is found when CI_W1 = 2 because the net sell amount is
same way, when CI_W1 = –2, the lowest measure of the conflict of interest is found
(NSW t-1 = NSW t+1 = 0 and NBW t-1 = NBW t+1 = 1). Next, when N=2, the highest
measure of conflict of interest is found when CI_W2 =4 (NSW t-2 = NSW t-1 = NSW t+1
= NSW t+2 = 1 and NBW t-2 = NBW t-1 = NBW t+1 = NBW t+2 = 0) and –4 (NSW t-2 =
NSW t-1 = NSW t+1 = NSW t+2 = 0 and NBW t-2 = NBW t-1 = NBW t+1 = NBW t+2 = 1)
when there is the lowest measure of the conflict of interest. Accordingly, the larger
the value of CI_WN is, the stronger is the conflict of interest.
B. By Amount. Similar to our net sell week, we define the net sell amount as
NSAi = max (total amount of sells – total amount of buys, 0), whichis the maximum
of the total amount of sells minus the total amount of buys and zero; and we define
the net buy amount as NBAi = max (total amount of buys ﹣total amount of sells, 0),
whichis the maximum of the total amount of buys minus the total amount of sells in
a week and zero. For example, if the value of the amount that a security house buys
is $100 but the value of the amount that it sells is $120 in a certain week during the
sample period, then NSA is equal to $20, but NBA is equal to 0. Thus, the measure of
the conflict of interest by amounts (CI_A) is defined again as the net sells minus the net buys. That is:
CI_AN =
∑
+ − = − N t N t i i i NBA NSA ) ( , N=1, 2. (2)where N is defined the same as in equation (1). A positive value for CI_AN indicates
that the security house sells more of a particular stock than it buys when it
recommends that investors buy that stock. Accordingly, the larger the value of
CI_AN, the stronger is the conflict of interest.
C. By Share. Our last index is based on the number of the shares bought and sold.
Here, the definitions and calculations of the number of the net sell shares (NSS) and
net buy shares (NBS) are exactly the same as those for NSA and NSB above. Hence,
we do not provide a detailed discussion on these here. The third index is the conflict of interest by shares (CI_S) therefore:
CI_SN =
∑
+ − = − N t N t i i i NBS NSS ) ( , N=1, 2. (3)3.2 Conflict of Interest Index for Each Investment Bank
We calculate the average conflict of interest index for each of the investment
banks for one year. For example, if a stock is recommended 20 times by an
investment bank in a given year, then R = 20. Using IB to denote investment banks,
we construct the conflict of interest index for each investment bank:
CI_IB_WN = R W CI R r r N
∑
=1 , _ , N=1, 2; (4) CI_IB_AN = R A CI R r r N∑
=1 , _ , N=1, 2; and (5) CI_IB_SN = R S CI R r r N∑
=1 , _ , N=1, 2. (6)where the underlying r denotes the rth number of recommendations, and CI_IB_WN,
CI_IB_AN and CI_IB_SN are the average scores or measures of the investment
banks’ recommendations based on the weeks, amounts and shares, respectively. For
example, if CI_IB_W2 =3, it means that, on average, the investment bank sells its
recommended stock for three weeks out of four (i.e., the two-week period before and
that after the recommendation) for each recommendation. The higher the value of
the three indices, the greater is the occurrence of the conflict of interest. In other
words, a higher index is indicative that there is greater likelihood that there are
conflicts of interest.
3.3 Conflict of Interest Index for Stocks
It is also of interest here to identify which particular stocks have a higher measure of
that each and everyone of them has recommended. We refer to this type of stock as
the “stock most commonly tied to conflicts of interest with respect to stock
recommendations by investment banks”, or for conciseness in this paper, “conflict
of interest with respect to individual stock recommended by investment banks”, or
as most frequently used in this paper, simply “conflict of interest.”
We denote G as the number of times a given stock is recommended which, in
essence, reveals the extent of the conflict of interest associated with that stock in a
given year. Then, we calculate the average conflict of interest index for that stock
using the following formula, where IS denotes Individual Stock:
CI_IS_WN = G W CI g G g N , 1 _
∑
= , N=1, 2; (7) CI_IS_AN = G A CI g G g N , 1 _∑
= , N=1, 2; and (8) CI_IS_SN = G S CI g G g N , 1 _∑
= , N=1, 2 , (9)where subscript g denotes the gth recommendation of the stock, and CI_IS_WN,
CI_IS_AN and CI_IS_SN represent the degree of the conflict of interest of an
individual stock based on the weeks, amounts and shares, respectively. The larger
the indices are, the greater is the tendency that there are conflicts of interest
associated with that stock.
4. Empirical Models
4.1 Determinants of the Measure of Conflict of Interest A. For Investment Banks
Once we obtain the measures of the conflict of interest for investment banks
(equations (4), (5) and (6)), we investigate their determinants. We attempt three
variables, i.e., the total assets of the investment banks (SIZE), the number of years
since the investment banks were established (Duration) and the frequency with
which the investment banks issue buy recommendations (TIMES). Hence, the model
is:
YN i t, , = a0 + a1SIZEi,t + a2Durationi,t + a3TIMESi,t +εi t, , (10)
N=1,2; i=1,2,…,30; t=2000, 2001, 2002, 2003.
where YN i t, , is substituted alternatively with CI_IB_WN,i,, CI_IB_AN,i,t and
CI_IB_SN,i,t. Since there are 30 investment banks in our sample from 2000 to 2003,
subscript i is the number of investment banks from 1 to 30, and t is the year from
2000 to 2003.
With respect to SIZE and Duration, we expect that investment banks which are
larger in size and which have been established a longer period of time should
operate with a lower degree of conflict of interest since they have higher opportunity
costs, the point being that they are likely to be more concerned about their reputation
and thus more cautious about issuing biased, untrustworthy recommendations. As
concerns the third variable TIMES, there are reasons both for and against investment
banks, which frequently issue recommendations to be motivated to include conflicts
of interest in their business strategy. On the one hand, in order to take advantage of
its competitive advantage with regard to gathering inside information, an investment
bank which issues buy recommendations more frequently probably issues more
biased recommendations. On the other hand, in order to build its reputation, an
investment bank which recommends more frequently is perhaps more cautious when
it issues buy recommendations. Thus, the signs of a1and a2are expected to be
negative, while the sign of a should be uncertain. 3
This subsection focuses on the characteristics of stocks most commonly
associated with conflicts of interest. Seven determinants are suggested: the trading
volume of a recommended stock (VOLUME); the total assets of the company with a
recommended stock (SIZE); the frequency with which a particular stock is
recommended by all security houses (FREQ); the number of similar stocks in the
same industry (based on SIC 4 digits) (NUMBER); the systematic risk associated
with a particular recommended stock (Beta); the growth opportunity of a particular
stock (MVBV=Market value/Book Value); and the equity shares of the stock held by
insiders (INSIDER). Thus:
YN i t, , = a0 + a1lnVOLUMEi,t + a2SIZEi,t + a3FREQi,t + a4NUMBERi,t + a5Betai,t +
a6MVBVi,t + a7INSIDERi,t +εi t, , (11)
N=1,2; i=1,2…30; t=2000, 2001, 2002, 2003
where YN i t, , are replaced by CI_IS_WN,i,t, CI_IS_AN,i,t and CI_IS_SN,i,t from
equations (7), (8) and (9), and the notation ln is the natural logarithm. There are 80
recommended stocks in our sample from 2000 to 2003.
The relation between VOLUME and the measure of conflict of interest is
uncertain. However, since a stock with a high trading volume usually attracts a great
deal of attention from the market, it is probably more difficult for a security house to
make a buy recommendation and turn around and sell it without being caught. Thus,
it is suggested that the relationship should be negative. By stark contrast, Verrecchia
(1982) and Bhushan (1989a) make the case that a high trading volume may stem
from the high volatility of a stock due to liquidity traders. More to the point, a
security house may take advantage of such a volatile condition by selling its stocks
simply in order to earn profits. Hence, it is suggested that under this scenario, the
relationship could be positive.
The relationship between SIZE and the sign of the measure of conflict of interest
greater for companies with large assets, means that investors’ attention is highly
drawn to those companies (Bhushan (1989b); Collins, Kothari, and Rayburn (1987);
Lang and Lundholm (1996)). Thus, security houses must be more vigilant when
making a recommendation so as to avoid blemishing their reputation. On the other
hand, again on account of investors’ high demand for analysts’ reports, an ideal
opportunity is opened up for security houses to earn profits by making an undue buy
recommendation. In sum, the relationship between SIZE and the sign of the degree
of conflict of interest could be either negative or positive-- neither would be
unexpected.
The relationship between FREQ and the degree of conflict of interest is expected
to be negative. An increase in the frequency with which buy recommendations are
made for a given stock by different security houses is unquestionably indicative that
there is a clear consensus that the stock price is expected to rise. For this reason,
were the security house to sell the stock, it would in all likelihood end up with a
loss.
The variable NUMBER, i.e., the number of firms in the same industry, is also
expected to be negatively related to the measure of conflict of interest. There is no
doubt that firms in the same industry share common information about
developments in that industry; thus, it would be extremely difficult for a security
house to make a positive buy recommendation when the prices of other stocks in the
same industry are falling. On these grounds, an increase in the number of companies
in a particular industry should decrease the possibility of there being conflicts of
interest.
The relationship between Beta, i.e., the systemic risk associated with a
recommended stock, and the measure of conflict of interest is probably positive. A
high Beta means that the stock has high risk associated with high returns. Thus, its
future stock returns are ambiguous, thus signaling that security houses may be less
The relationship between MVBV, which represents the growth opportunity of a
stock, and the degree of conflict of interest is, as should be expected, positive. As
Frankel, Kothari and Weber (2003) put it, companies with a high value of MVBV are
most often newly-established stock with high growth potential. These companies
also lack a long-term, or historical, financial background. Therefore, under these
circumstances, investment banks, which make a buy recommendation and
simultaneously sell it are not likely to get caught. In other words, investment banks
should have a greater opportunity to operate with conflicts of interest when a
company has a high value of MVBV and when it does not have a long-term financial
background.
Turning to the last variable, INSIDER, which stands for the equity shares of a
particular stock held by insiders, it is expected that it is positively related to the
measure of conflict of interest. Also based on the view of Frankel, Kothari and
Weber (2003), the more equity that is held by insiders, the less transparent the
company is to outsiders. In this sense, outsiders can never be fully aware of the
prospects of the company, and for this very reason, investment banks are at great
liberty to exploit any information that is available.
4.2. Impact on the Profits of Investment Banks
We next explore whether or not it is profitable for an investment bank to operate
when it knowingly is involved in conflicts of interest. In a strict sense, in the event
that it has conflicts of interest as part of its modus operandi and that it is able to
increase profits, then it makes sense, at least on the surface, that that investment
bank tries to continue doing so since it does not risk suffering the consequences.
Should this be the case, then the market must be considered inefficient owing to the
fact that it does not fully utilize all of the available information, but instead, it
accepts information whether it be misleading or not. Against this, if the market is
capable of detecting misleading information, the investment bank can surely not
investors astray.
We use three profitability indices to investigate this claim. The first is the return
on assets of investment banks (ROA), which we employ to determine whether all
banks actually benefit from operating with conflicts of interest. The second
profitability index is the returns ratio from the proprietary division over total profits
(ROD, where D denotes the dealer), which we employ since it is this division that
makes profits if the public accepts the buy recommendations that are made. Hence,
in this case, the presence of conflicts of interest directly affects ROD. The third
index is the returns ratio from a brokerage division over total profits (ROB, where B
denotes the broker), which has the same implications as ROD. To be straight to the
point, the public buys the recommended stocks through the brokerage, and because
of this, the profits of the brokerage division increase. Our model is:
Profiti,t = a0 +a1SIZEi,t +a2Durationi,t +a3TIMESi,t +a4CI_IBi,t +εi t, , (12)
i=1,2,…,30; t=2000, 2001, 2002, 2003.
where Profit is proxied by ROA, ROD and ROB; CI_IBi,t are replaced by
CI_IB_WN,i,t, CI_IB_AN,i,t and CI_IB_SN,i,t (N=1, 2).
5. Data and Basic Statistics
5.1 Sources of the Data
The data for the stock recommendations used in this study are taken from the
columns of “This Week’s Stocks Observations” and “Strategy of Selecting Stocks”
found in every Sunday’s Commercial Newspaper and Economic Newspaper,
respectively.9 Because this information has only been made available since January
2000, this determines the beginning date of our sample, with it ending on December
9
There are many different magazines and newspapers that offer stock recommendations, but they are not referenced here because our recommendations must be published consistently and continuously. Also, the magazines and newspapers must specialize in the area of economics or
2003. There are 30 security houses randomly collected in our sample.10 The
proprietary trading information, SIZE, TIMES, Duration, the profit of investment
banks (ROA), and other financial variables of firms making recommendations are
taken from the Taiwan Economic Journal (TEJ) database. The two remaining profit
measures, ROD and ROB, are collected from the exchangeable financial reports
among security houses and are not directly available to the public.
5.2 Investment Banks and the Measure of Conflict of Interest
We first report on the measure of conflict of interest that occurs in investment
banks and then report on the measure of conflict of interest that occurs in stocks.
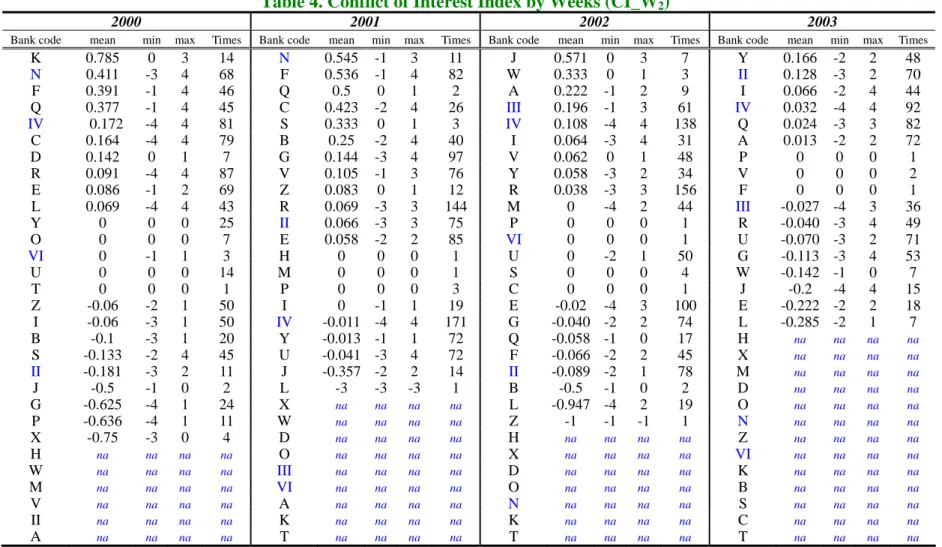
Tables 3 to 8 present the basic statistics, including the mean, minimum and
maximum of the three measures of conflict of interest: the conflict of interest by
weeks (CI_W), the conflict of interest by amounts (CI_A), and the conflict of interest by shares (CI_SN) across all recommendations issued of each of the
security houses for each year, and recallthat the mean values of these measures are also used to measure the conflict of interest index for investment banks: CI_IB_W, CI_IB_A, and CI_IB_S, respectively. A positive number is indicative of a positive
net sell, and therefore, the presence of conflicts of interest is implied. The higher
the positive number is, the more pervasive are the conflicts of interest. Banks are
listed in the tables in descending order on the basis of the mean values from positive to zero and to negative. The term na means that that security house does
not make any buy recommendations during that year.
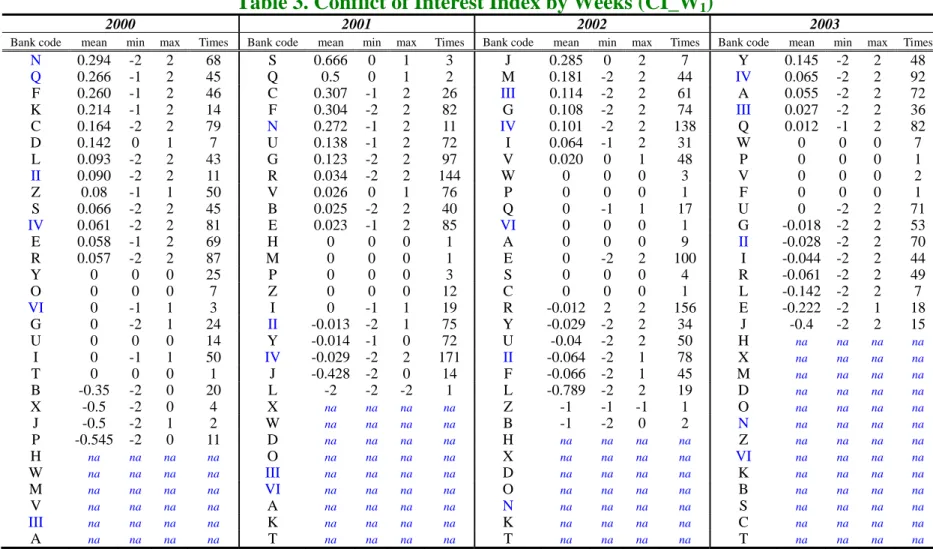
In the columns on the far left hand side of Table 3, we take the year 2000 as
the example to illustrate the extent to which each security house is involved in
conflicts of interest using CI _W1. There are 13 security houses that obtain positive
average scores, 6 that obtain zero and 4 that obtain negative average scores. As
shown, the top ranking security house N has the highest average scores as it makes
68 recommendations, and the maximum and minimum value or measure of conflict
of interest is respectively +2 and –2. A maximum of +2 means that in a particular
week, the security house sells each buy recommended stock one week both before
and one week after it issues that recommendation; in this way, it receives the highest
score when it is involved in a conflict of interest. When it is –2, it is in no conflict of
interest whatsoever since the security house also buys the buy recommended stock.
In the case of security house N, the average score is 0.294, a sign that the investment
bank sells each recommended stock, on average, for 0.294 weeks out of the possible
two weeks. The interpretation of this, of course, is that the security house is
occasionally, but certainly not always, involved in a conflict of interest.
Several other interesting findings are worth noting for the year 2000. For one,
the number of recommendations differs substantially across security houses.
Security house R, for example, makes 87 recommendations, while H, W, M, V, III
and A make none. Simply judging from the figures, all in all, a higher number of
recommendations tends to be associated with a more positive average measure of
conflict of interest. In addition, eleven security houses have a maximum of 2, a
strong indication that at no time have they wanted to hold the stocks they have
recommended; on the contrary, they have wanted to sell them. What’s more, seven
security houses have maximum scores of zero, indicating that they have not taken
any further action with a particular stock after having recommended it.
Similar findings, albeit with slight differences, are shown between 2001 to
2003. First, it is noted that the number of security houses with a positive score or
average measure of conflict of interest steadily drops from 13 to 11 in 2001, to 7 in
2002 and to 5 in 2003. Thus, the prevalence of conflicts of interest is less and less
pronounced each year. One reason for this gradual decrease may be that supervision
or governance improved during those years. The decrease could also be attributed to
worsening economic conditions throughout those three years, which could have
been more forthright when making suggestions, or alternatively, in light of the good
economic times, investors might have been more prudent and cautious. Next, the
number of firms with the maximum score of +2 is, for all intents and purposes,
stable throughout the entire four-year period: 11 in 2000, 9 in 2001, 11 in 2002 and
12 in 2003. Evidently, among those firms, the temptation to send the wrong signal
does not dissipate. Third, considerably fewer firms make recommendations in 2003,
perhaps largely because an increase in the number of mergers, acquisitions and
control may have decreased the number of security houses or because 2003 marked
the year with the worst economic conditions within the past three decades in Taiwan.
Table 4 presents the same measures of conflict of interest except that we use
a two-week window. The maximum and minimum value respectively becomes +4
and –4. We take 2000 as our benchmark; overall, among all of the security houses,
10 have positive average scores, 5 have scores of zero, and 9 have negative average
scores. The number with a positive score jumps to 12 in 2001 but dips to 9 in 2002
and suddenly plunges to only 6 in 2003. This signifies that the perceived importance
of using conflicts of interest as part of a business strategy appears to have subsided
in more recent years. Beyond this, the number of security houses with the maximum
of +4, though it fluctuates, does ultimately decrease somewhat from 8 to 6 and then
suddenly to just 2 before showing a marked increase back up to 5 in the above
consecutive years.
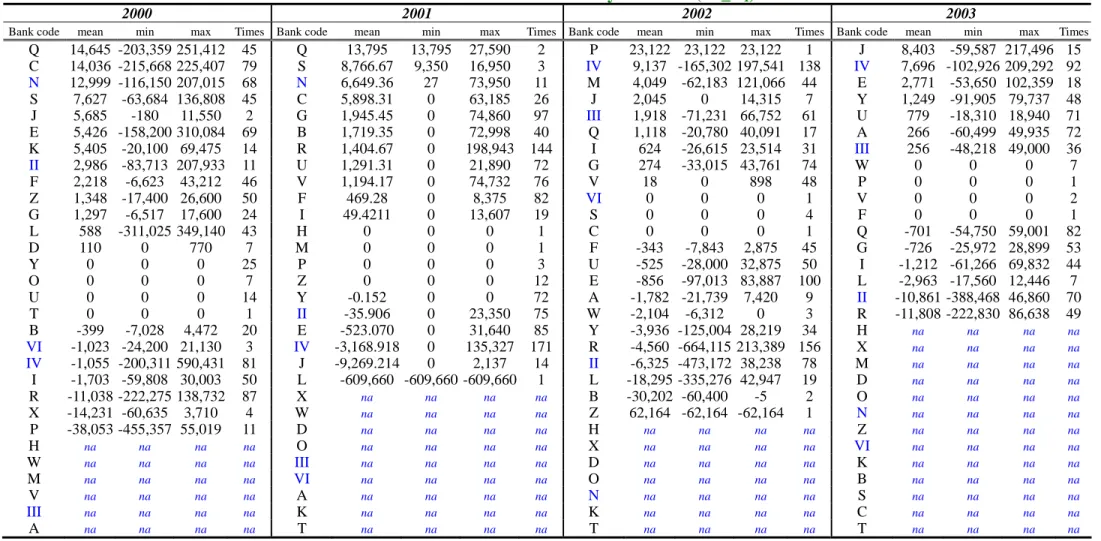
Tables 5 and 6 are the same as Tables 3 and 4 but instead of being based on
CI_W1 and CI_W2 to determine the pervasiveness of conflicts of interest, they are
based on CI_A1 and CI_A2, respectively. A positive value suggests the presence of a
higher degree of conflict of interest, whereas a negative value suggests a lower
degree of conflict of interest. The maximum value means that when a particular
security house makes a buy recommendation, the largest number of net sells occurs.
Take the year 2000, which uses a one-week window as the example (Table 5).
million ($590,431,000) new Taiwan dollars, which is quite inconsistent with the
total buy recommendations. Bear in mind, however, that the other security houses
also have noticeably high maximum positive amounts; thus, their proprietary trading
or dealer divisions must also be bringing in large profits on account of their high
measure of conflict of interest. Granted that the frequency of issuing a
recommendation does typically appear to be positively correlated with the average
measure of conflict of interest in Tables 3 and 4, but this certainly does not seem to
be the case with some security houses in Tables 5 and 6. For example, the highest
number of recommendations is 87 followed by 81, but the average value or measure
of conflict of interest for each firm is negative. Similar to the results in the previous
tables (Tables 3 and 4) nevertheless, the positive average scores decrease over the
years. Compared with 12 security houses, which have a positive average score in
2000, only 6 do in 2003. This again, signifies that the measure of conflict of interest
decreases with time.
Table 6 is the same as Table 5 except that we use the two-week period for CI_A2.
There are 11, 11, 10 and 5 security houses with a positive average score in each
consecutive year during the four-year period, suggesting that conflicts of interest are
at play. Contrast this with the respective number of security houses with zero or
negative scores: 13, 10, 13 and 12, which undoubtedly indicates the absence of any
conflicts of interest. Not unlike what is observed in Table 5, the number of security
houses with a positive average score seems to have been on the decrease over the
years, implying that fewer and fewer investment banks are making use of conflicts
of interest as a way to make gains.
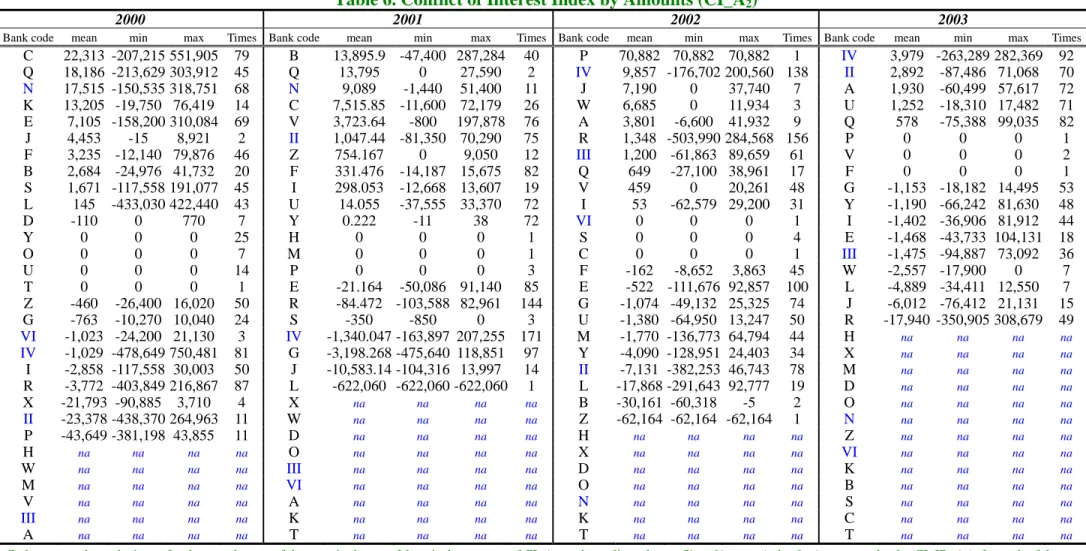
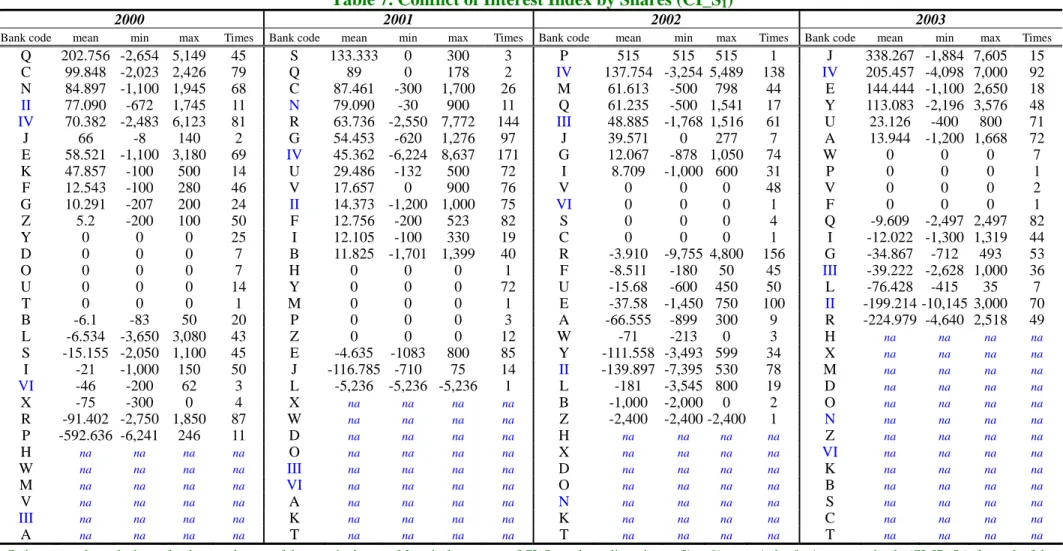
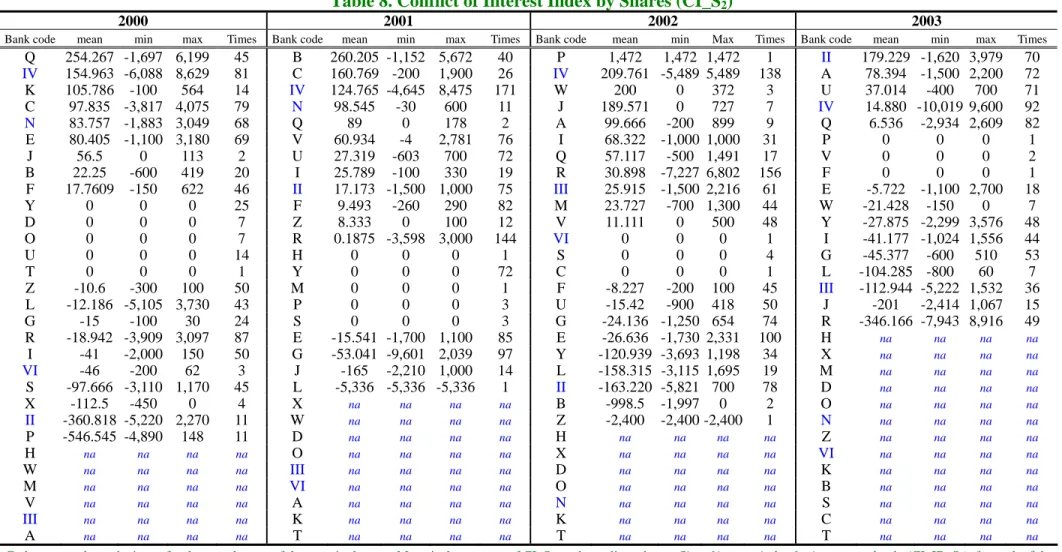
The results shown in Tables 7 and 8 correspond to those in Tables 3 to 6, except
that we use total shares as a measure of conflict of interest. The results are similar to
those in the other four tables, where the number of shares with a positive value is 11,
13, 8 and 6 for the one-week window and 9, 12, 11 and 5 for the two-week window.
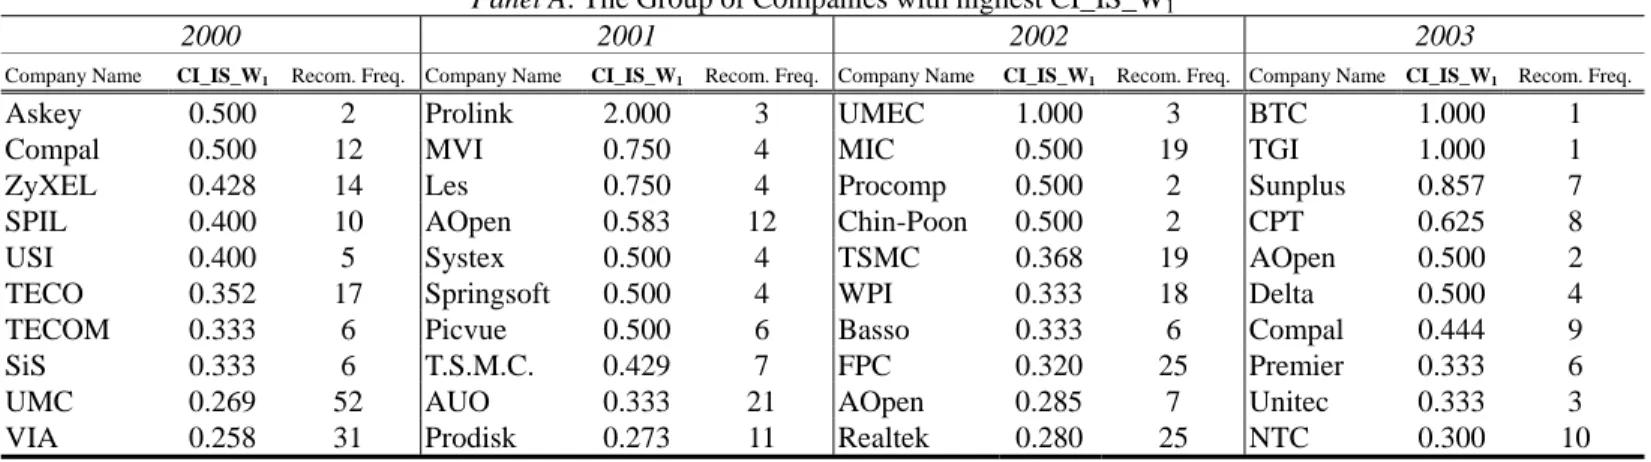
Tables 9 through 14 show the stocks, which are most likely to be associated with
conflicts of interest. We only discuss ten stocks with the highest and lowest measure
or value of conflict of interest. In Table 9, where the reported number, CI_IS_W1, is
the sum of CI_W1 divided by the number of recommendations, it is clear that the
maximum and minimum number of recommendations is +2 and –2, respectively. A
higher number is indicative of a higher measure of conflict of interest. For example,
the stocks most associated with conflicts of interest show up in 2001 when Prolink
receives three buy recommendations but is sold by the recommending security
houses one week immediately before and immediately after the recommendations.
When CI_IS_W1 is employed as the criterion, the average is +2, and the sole reason
for this is that each measure of conflict of interest, CI_W1, is also +2. (i.e.,
CI_IS_W1 = (2+2+2)/3). Stocks with the second highest measure of conflict of
interest are UMEC (in 2001), BTC (in 2003) and TGI (in 2003), each of which has a
score of +1.000. In the lower part of the same Table are those stocks that are not
only recommended but are also actually bought by the same security house. Oddly
enough, we find that TSMC and UMC, whose production represents the
“semiconductor foundry” of Taiwan and whose rank is respectively number 1 and 2
the world over, also have the stocks with the high measure of conflict of interest. In
2000, UMC stock is recommended 52 times but sold around 15 times. As for TSMC,
in 2001 and 2002, it is recommended 7 and 19 times but sold roughly 3 and 6 times.
From this, it is reasonable to conclude that even stocks with large assets and an
excellent reputation may also fall victim to conflicts of interest.
Table 10 shows similar results though we use CI_IS_W2 to compute the average
scores. The stocks with the highest extent or measure of conflict of interest are those
of Leadtec (in 2002), with an average of +3.333, possibly resulting from (4+3+3)/3.
This indicates that it is sold by the recommending security houses for 3.333 weeks
out of the possible four weeks.
shares as the criteria with which we evaluate the extent or measure of conflict of
interest. With CI_IS_A1 employed as the criterion, the stocks with the highest
measure of conflict of interest are those of Compal (in 2000), Leadtec (in 2001),
UMEC (in 2002) and Hon Hai (in 2003), as shown in Table 11. Meanwhile, Compal
(in 2000) has the highest net sells (around $47 million), but this is not in agreement
with the number of buy recommendations. Stocks with the highest scores for or
measure of conflict of interest (CI_IS_A2) in Table 12 are those of Acer (in 2003),
with average net sells of nearly $50 million. When we use shares as the criterion
with which to evaluate the extent or measure of conflict of interest, as shown in
Table 13, the stocks with the highest values of conflict of interest (CI_IS_S1) in
2000 and 2001 are those of Compal and Leadtec, respectively, a finding which
parallels that from Table 10. Table 14 shows that the stocks with the highest scores
for conflict of interest (CI_IS_S2) are those of BTC, with net sells approaching 2.47
million shares, once again illustrating a lack of consistency with the buy
recommendations.
6. Determinants of and the Impact of Conflicts of Interest on Profits
6.1 Determinants of Conflicts of Interest
A. Investment Banks. Table 15 shows the determinants of the conflicts of interest,
which are used by investment banks. SIZE is significantly negative when we use
CI_IB_W2 as the dependent variable, suggesting that the larger the assets of an
investment bank are, the less likely it is that it has conflicts of interest. Times is
significantly positive when we use CI_IB_W1, CI_IB_W2 and CI_IB_S1 as the
dependent variables, indicating that the more frequently an investment bank issues a
recommendation, the higher is the probability that that bank will let itself get
involved in conflicts of interest. Duration, i.e., the length of time a company has
been established, is found to have no effect on the presence or absence of conflicts
B. Stocks. Table 16 presents the determinants of the presence of conflicts of
interest associated with stocks. When we use CI_IS_W1 as the dependent variable,
VOLUME and SIZE are found to be significantly negative, which indicates that the greater the trading volume or asset size is, the less likely it is that the buy
recommended stocks are sold. On the other side of the coin, INSIDER is
significantly positive in one of the three specifications, which means that, to some
extent, an increase in insider holding increases the likelihood of there being conflicts
of interest. Contradicting our earlier expectation, NUMBER in the same industry is
insignificant, which implies that the number of firms in the same industry is strictly
not relevant when it comes to the presence or absence of conflicts of interest with
respect to stocks.
When we use CI_IS_W2 as the dependent variable, not one of the explanatory
variables is significant. Thus, there are no clear-cut factors that seem to explain
conflicts of interest that last for two weeks.
Table 17 employs the amounts of CI_IS_A1 and CI_IS_A2 as the dependent
variables, and the results do not change significantly from those reported in Table 16.
Thus, we skip the discussion on these results.
Table 18 differs from Table 17 in that it employs the shares rather than the
amounts of CI_IS_S1 and CI_IS_S2 as the dependent variables. Beta is found to be
significantly positive during the two-week period, suggesting that a stock with
higher systematic risk tends to be more closely associated with a higher measure of
conflict of interest.
6.2 Higher Measures of Conflict of Interest vis-à-vis Profits
A. ROA. Table 19 presents the estimated results using the ROA of investment
banks as the dependent variable. Should an investment bank choose to operate with
a conflict of interest for the sake of increasing profits, then it could be said that the
inappropriately making buy recommendations. The coefficients are significant when
conflicts of interest are proxied by CI_IS_W1 or CI_IS_W2 when one or two weeks
is used as the criterion. Hence, when investment banks, which make
recommendations that could put them into jeopardy because of their use of conflicts
of interest receive little or no retribution from the market, this automatically compels
us to flatly reject the concept of market efficiency. After all, this points out that
investment banks are truly able to exploit profits by increasing the number of
conflicts of interest they include as part of their modus operandi. By contrast, when
the remaining two variables, i.e., amounts and shares, are used as the criteria,
because the coefficients are insignificant, it seems that the argument that favors
market efficiency is fully supported.
B. ROD. The estimated results in Table 20 are similar to those in Table 19, but
they are based on ROD as the dependent variable because the proprietary trading
division is customarily the major beneficiary of a misleading buy recommendation.
Much to our surprise, none of the conflict of interest indices is significant. Hence,
from the evidence here, it would seem that the presence of conflicts of interest does
not raise the profits of a proprietary trading division.11
C. ROB. In a broad sense, just like the case with ROA but most unlike that with
ROD, the presence of conflicts of interest may benefit the brokerage department
since a misinformed investor may heavily rely on investment bank reports no matter
if they are misleading or not. Such being the case, then making buy
recommendations and concurrently selling those very stocks must really be
11
Caution should be taken regarding the insignificance of the results. Because the ROD data are obtained directly from investment banks and are not examined by accountants, they may contain profits from other transactions. For example, in addition to stock trading, the profits of a proprietary department also include the gain/loss of bond trading. In Taiwan, sometimes the trading of stocks by the underwriting department, and not by the dealer department, is also classified as profits of the dealer department, thereby muddling the issue of this department’s profits. Without more detailed information, we actually cannot identify
rewarding for investment banks. In support of this, Table 21 shows that five of the
six conflict of interest indices are significant, suggesting that, as a rule of thumb,
investors cannot generally distinguish reliable recommendations from biased ones.
Add to that and central to the issue at hand is the fact that a brokerage division is a
profitable entity whether or not investment banks are rife with our newly-defined
type of conflict of interest (i.e., that is, an investment bank issues biased
recommendations on the presumption that the amount of trading revenue it expects
their reports to generate will increase). There could very well be some truth to the
matter that the capital market in Taiwan is far from being efficient. It is, in fact,
hardly a misconception: some, but not all, investment banks are being allowed to go
on making profits simply by providing double-dealing buy recommendations.
7. Concluding Remarks
That investment banks provide the market with buy recommendations, but at the
same time, their proprietary trading division is selling the very same recommended
stocks is, in a word, troubling. We refer to this type of stock as the stock “most
commonly tied to conflicts of interest with respect to stock recommendations by
investment banks”, or for conciseness in this paper, conflict of interest with respect
to individual stock recommended by investment banks”, or as most frequently used
in this paper, simply “conflict of interest.”
The aim of this paper is to construct the conflict of interest indices based on
weeks, amounts and shares so as to determine the measure, value or extent of conflict
of interest, or similar in meaning, the pervasiveness of conflicts of interest in stock
recommendations by investment banks from January 2000 to December 2003 on
Taiwan’s stock market. There is strong evidence to support the following conclusions.
First, conflicts of interest do indeed exist, which in this study means that it is not
uncommon for some investment banks to sell their recommended stocks in the one- or
recommendations. However, the pervasiveness of such conflicts of interest, generally
speaking, dissipates over time. Secondly, those investment banks associated with
more conflicts of interest share the following characteristics: they are smaller in size; and they issue recommendations comparatively more frequently. Apart from this,
firms with stocks which are more associated with conflicts of interest have the
following features: they have smaller trading volumes; they are smaller in size; they
have higher systematic risk; they have more insider holdings; and equally important,
they make recommendations less frequently. Last but certainly not least, conflicts of
interest associated with stock recommendations are beneficial to the profits of
investment banks, especially to their brokerage division. What this clearly
demonstrates is that the market does not penalize banks, which are more heavily
involved in conflicts of interest, and for this reason alone, the incentives to issue
trustworthy and unbiased recommendations are greatly reduced.
A call is made here for future studies to compare the realized returns on stocks
with high and low measures of conflict of interest. Also, research into whether or not
foreign investment banks in Taiwan have the same measure of conflict of interest is
References
Barber, B. M., R. Lehavy, and B. Trueman, 2004, “Comparing the Stock
Recommendation Performance of Investment Banks and Independent Research Firms,” Working Paper, University of California at Davis,
http://ssrn.com/abstract=572301.
Barber, B., R. Lehavy, M. McNichols, and B. Trueman, 2001, “Can Investors Profit from the Prophets? Security Analyst Recommendations and Stock Returns,” Journal of Finance, LVI (2), 531-563.
Bhushan, R., 1989a, “Collection of Information about Publicly Traded Firms: Theory and Evidence,” Journal of Accounting & Economics, 11, 183-206.
Bhushan, R, 1989b, “Firm Characteristics and Analyst Following,” Journal of Accounting and Economics, 11, 255-274.
Chan, K. W., C. Chang, and A. Wang, 2004, “Put Your Money Where Your Mouth Is: Do Financial Firms Follow Their Own Recommendations?” Working Paper, Department of Applied Economics and Management, Cornell University. Collins, D., Kothari, S., Rayburn, J., (1987), “Firm Size and Information Content of
Prices with Respect to Earnings,” Journal of Accounting and Economics, 9, 111-138.
Dechow, P., A. Hutton, and R. Sloan, 2000, “The Relation Between Analysts’ Long-Term Earnings Forecasts and Stock Price Performance Following Equity Offerings,” Contemporary Accounting Research, 17, 1-32.
Dugar, A. and S. Nathan, 1995, “The Effect of Investment Banking Relationships on Financial Analysts’ Earnings Forecasts and Investment Recommendations,” Contemporary Accounting Research, 12, 131-160.
Ellis, K., R. Michaely, and M. O’Hara, 2004, “Competition in Investment Banking: Proactive, Reactive, or Retaliatory?” Working Paper, Cornell University. Frankel, R., S. P. Kothari and J. P. Weber (2003) “Determinants of the
Informativeness of Analyst Research,” Working Paper, MIT Sloan School of Management.
Irvine, P. J. A., 2001, “Do Analysts Generate Trade for Their Firms? Evidence from the Toronto Stock Exchange,” Journal of Accounting and Economics, 30, 209-226. Lang, M., Lundholm, R., (1996), “Corporate Disclosure Policy and Analyst
Behavior,” The Accounting Review, 71, 467-492.
Lee, Yi-Tsung, Ji-Chai Lin , and Yu-Jane Liu, 1999, “Trading Patterns of Big versus Small Players in an Emerging Market: An Empirical Analysis,” Journal of Banking and Finance 23, 701-725.
Lin, H.-W. and M. McNichols, 1998, “Underwriting Relationships and Analysts’ Earnings Forecasts and Investment Recommendations,” Journal of Accounting
and Economics, 25, 101-127.
Ljungqvist, A., F. Marston, and W. Wilhelm, 2003, “Competing for Securities
Underwriting Mandates: Banking Relationships and Analyst Recommendations,” Working Paper, New York University.
McNichols, M., O'Brien, P., 1997, “Self-Selection and Analyst Coverage,” Journal of Accounting Research (Supplement), 167-199.
Michaely, R. and K. Womack, 1999, “Conflicts of Interest and the Credibility of Underwriter Analyst Recommendations,” Review of Financial Studies, 12, 653-686.
Morgan, J. and, P. C. Stocken, 2003, “An Analysis of Stock Recommendations,” RAND Journal of Economics, vol. 34(1), 183-203.
Sirri, E., 2004, “Investment Banks, Scope, and Unavoidable Conflicts of Interest,” Economic Review (Fourth Quarter 2004), Federal Reserve Bank of Atlanta, 23-35.
Stickel, S. E., 1995, “The Anatomy of the Performance of Buy and Sell Recommendations,” Financial Analysts Journal, 51, 25-39.
Verrecchia, R. E., 1982, “Information Acquisition in a Noisy Rational Expectations Economy,” Econometrica, 50(6), 1415–1430.
Womack, K. L., 1996, “Do Brokerage Analysts’ Recommendations Have Investment Value?,” Journal of Finance, 51, 137-167.
Table 1 A Case Study
Buys/Sells of the Recommended Stocks by the Proprietary Trading Department of Securities House IV around the Buy Recommendations
Shares of Buy
(A) Amounts of Buy (B)
Shares of Sell
(C) Amounts of Sell (D) Net Trade
Stocks Recommended by
Securities House IV Weeks relative to recommendation date
unit: 1,000 shares unit: NT$1,000 unit: 1,000 shares unit : NT$1,000) Amounts
(B)-(D) Shares (A)-(C) –2 100 6,875 0 0 6,875 100 –1 950 70,825 150 10,975 59,850 800 +1 200 14,600 0 0 14,600 200 Macronix International (MXIC) (Mar 4, 2000) +2 350 25,200 0 0 25,200 350 –2 0 0 100 14,850 -14,850 -100 –1 0 0 115 16,762 -16,762 -115 +1 0 0 142 20,590 -20,590 -142 Sunplus Technology (Dec 2, 2000) +2 0 0 199 29,154 -29,154 -199 –2 500 19,670 0 0 19,670 500 –1 100 3,840 0 0 3,840 100 +1 400 14,340 0 0 14,340 400 Compal (Aug 10, 2001) +2 0 0 0 0 0 0 –2 60 22,830 150 58,449 -35,619 -90 –1 0 0 70 27,720 -27,720 -70 +1 0 0 0 0 0 0 MediaTek Incorporation (Aug 10, 2001) +2 0 0 0 0 0 0
Table 1 A Case Study (continued)
Buys/Sells of the Recommended Stocks by the Proprietary Trading Department of Securities House IV around the Buy Recommendations
Shares of Buy
(A) Amounts of Buy (B)
Shares of Sell
(C) Amounts of Sell (D) Net Trade
Stocks Recommended by Securities House IV (recommendation date)
Weeks relative to recommendation date
unit: 1,000 shares unit: NT$1,000 unit: 1,000 shares unit : NT$1,000) Amounts
(B)-(D) Shares (A)-(C) –2 0 0 700 17,960 -17,960 -700 –1 0 0 300 9,260 -9,260 -300 +1 0 0 300 9,582 -9,582 -300 AU Optronics (Dec 7, 2001) +2 0 0 1,700 53,095 -9,582 -300 –2 126 5,885 1,796 80,798 -74,913 -1,670 –1 72 3,214 574 25,443 -22,229 -502 +1 84 3,819 293 13,201 -9,382 -209 Formosa Plastic (Jul 26, 2002) +2 1,026 41,608 1,150 47,111 -5,503 -124 –2 510 28,015 1,219 66,023 -38,008 -709 –1 570 31,200 762 40,484 -9,284 -192 +1 510 28,765 755 42,293 -13,528 -245 Accton (Sep 5, 2002) +2 105 5,940 579 32,484 -26,544 -474 –2 40 17,450 190 81,330 -63,880 -150 –1 0 0 192 81,900 -81,900 -192 +1 0 0 40 12,160 -12,160 -40 MediaTek Incorporation (Aug 30, 2002) +2 0 0 118 39,881 -39,881 -118
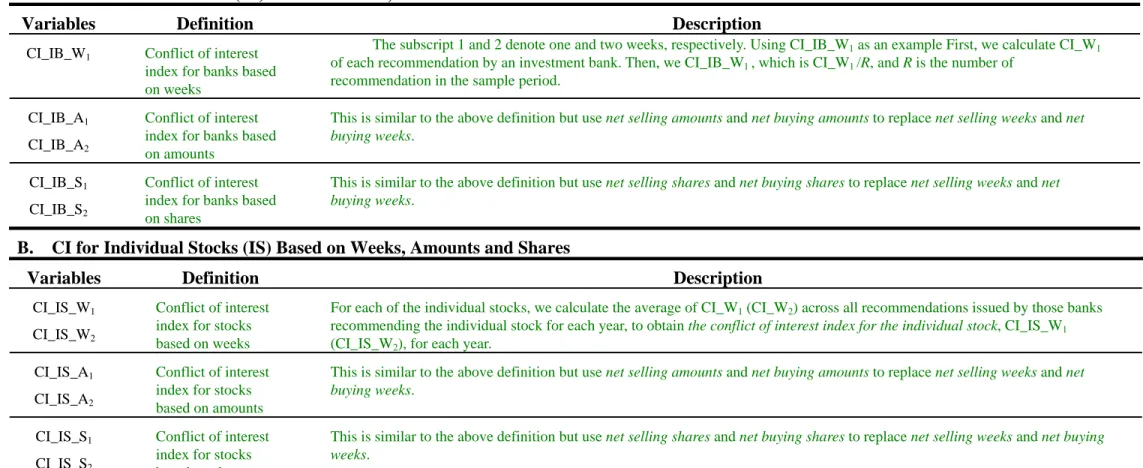
Table 2 Mnemonics, Definitions and Descriptions A. CI for Investment Banks (IB) Based on Week, Amounts and Shares
Variables Definition Description
CI_IB_W1 Conflict of interest
index for banks based on weeks
The subscript 1 and 2 denote one and two weeks, respectively. Using CI_IB_W1 as an example First, we calculate CI_W1 of each recommendation by an investment bank. Then, we CI_IB_W1 , which is CI_W1 /R, and R is the number of
recommendation in the sample period.
CI_IB_A1
CI_IB_A2
Conflict of interest index for banks based on amounts
This is similar to the above definition but use net selling amounts and net buying amounts to replace net selling weeks and net
buying weeks.
CI_IB_S1
CI_IB_S2
Conflict of interest index for banks based on shares
This is similar to the above definition but use net selling shares and net buying shares to replace net selling weeks and net
buying weeks.
B. CI for Individual Stocks (IS) Based on Weeks, Amounts and Shares
Variables Definition Description
CI_IS_W1
CI_IS_W2
Conflict of interest index for stocks based on weeks
For each of the individual stocks, we calculate the average of CI_W1 (CI_W2) across all recommendations issued by those banks recommending the individual stock for each year, to obtain the conflict of interest index for the individual stock, CI_IS_W1 (CI_IS_W2), for each year.
CI_IS_A1
CI_IS_A2
Conflict of interest index for stocks based on amounts
This is similar to the above definition but use net selling amounts and net buying amounts to replace net selling weeks and net
buying weeks.
CI_IS_S1
CI_IS_S2
Conflict of interest index for stocks based on shares
This is similar to the above definition but use net selling shares and net buying shares to replace net selling weeks and net buying